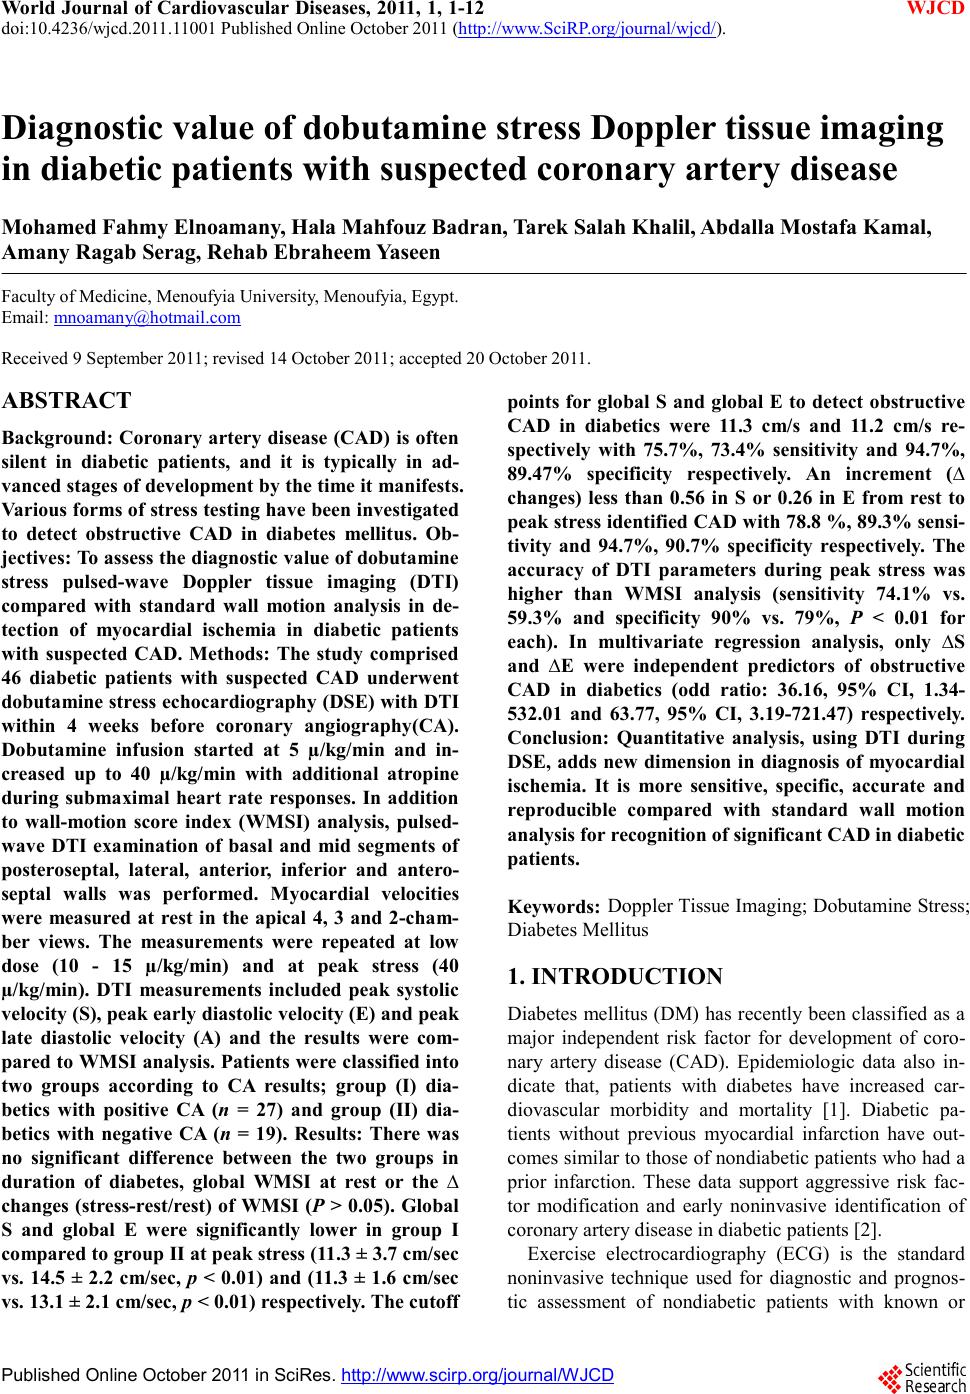
 World Journal of Cardiovascular Diseases, 2011, 1, 1-12 doi:10.4236/wjcd.2011.11001 Published Online October 2011 (http://www.SciRP.org/journal/wjcd/ WJCD ). Published Online October 2011 in SciRes. http://www.scirp.org/journal/WJCD Diagnostic value of dobutamine stress Doppler tissue imaging in diabetic patients with suspected coronary artery disease Mohamed Fahmy Elnoamany, Hala Mahfouz Badran, Tarek Salah Khalil, Abdalla Mostafa Kamal, Amany Ragab Serag, Rehab Ebraheem Yaseen Faculty of Medicine, Menoufyia University, Menoufyia, Egypt. Email: mnoamany@hotmail.com Received 9 September 2011; revised 14 October 2011; accepted 20 October 2011. ABSTRACT Background: Coronary artery disease (CAD) is often silent in diabetic patients, and it is typically in ad- vanced stages of development by the time it manifests. Various forms of stress testing have been investigated to detect obstructive CAD in diabetes mellitus. Ob- jectives: To assess the diagnostic value of dobutamine stress pulsed-wave Doppler tissue imaging (DTI) compared with standard wall motion analysis in de- tection of myocardial ischemia in diabetic patients with suspected CAD. Methods: The study comprised 46 diabetic patients with suspected CAD underwent dobutamine stress echocardiography (DSE) with DTI within 4 weeks before coronary angiography(CA). Dobutamine infusion started at 5 µ/kg/min and in- creased up to 40 µ/kg/min with additional atropine during submaximal heart rate responses. In addition to wall-motion score index (WMSI) analysis, pulsed- wave DTI examination of basal and mid segments of posteroseptal, lateral, anterior, inferior and antero- septal walls was performed. Myocardial velocities were measured at rest in the apical 4, 3 and 2-cham- ber views. The measurements were repeated at low dose (10 - 15 µ/kg/min) and at peak stress (40 µ/kg/min). DTI measurements included peak systolic velocity (S), peak early diastolic velocity (E) and peak late diastolic velocity (A) and the results were com- pared to WMSI analysis. Patients were classified into two groups according to CA results; group (I) dia- betics with positive CA (n = 27) and group (II) dia- betics with negative CA (n = 19). Results: There was no significant difference between the two groups in duration of diabetes, global WMSI at rest or the ∆ changes (stress-rest/rest) of WMSI (P > 0.05). Global S and global E were significantly lower in group I compared to group II at peak stress (11.3 ± 3.7 cm/sec vs. 14.5 ± 2.2 cm/sec, p < 0.01) and (11.3 ± 1.6 cm/sec vs. 13.1 ± 2.1 cm/sec, p < 0.01) respectively. The cutoff points for global S and global E to detect obstructive CAD in diabetics were 11.3 cm/s and 11.2 cm/s re- spectively with 75.7%, 73.4% sensitivity and 94.7%, 89.47% specificity respectively. An increment (∆ changes) less than 0.56 in S or 0.26 in E from rest to peak stress identified CAD with 78.8 %, 89.3% sensi- tivity and 94.7%, 90.7% specificity respectively. The accuracy of DTI parameters during peak stress was higher than WMSI analysis (sensitivity 74.1% vs. 59.3% and specificity 90% vs. 79%, P < 0.01 for each). In multivariate regression analysis, only ∆S and ∆E were independent predictors of obstructive CAD in diabetics (odd ratio: 36.16, 95% CI, 1.34- 532.01 and 63.77, 95% CI, 3.19-721.47) respectively. Conclusion: Quantitative analysis, using DTI during DSE, adds new dimension in diagnosis of myocardial ischemia. It is more sensitive, specific, accurate and reproducible compared with standard wall motion analysis for recognition of significant CAD in diabetic patients. Keywords: Doppler Tissue Imaging; Dobutamine Stress; Diabetes Mellitus 1. INTRODUCTION Diabetes mellitus (DM) has recently been classified as a major independent risk factor for development of coro- nary artery disease (CAD). Epidemiologic data also in- dicate that, patients with diabetes have increased car- diovascular morbidity and mortality [1]. Diabetic pa- tients without previous myocardial infarction have out- comes similar to those of nondiabetic patients who had a prior infarction. These data support aggressive risk fac- tor modification and early noninvasive identification of coronary artery disease in diabetic patients [2]. Exercise electrocardiography (ECG) is the standard noninvasive technique used for diagnostic and prognos- tic assessment of nondiabetic patients with known or  M. F. Elnoamany et al. / World Journal of Cardiovascular Diseases 1 (2011) 1-12 2 suspected CAD [3]. In diabetic patients the accuracy of exercise ECG may be lowered as a result of several fac- tors such as blunted response of blood pressure and heart rate with exercise, previous silent infarctions, high fre- quency of conduction abnormalities, left ventricular hy- pertrophy, and reduced exercise capacity resulting from peripheral vascular disease [3]. Because of the reduced diagnostic accuracy of exercise ECG, exercise or phar- macologic stress with myocardial perfusion scintigraphy has been recommended for diagnostic and prognostic assessment of diabetic subjects [4]. In nondiabetic subjects, stress echocardiography has been found to enhance diagnostic and prognostic accu- racy compared with exercise ECG [5]. The absence of ischemia on a stress echocardiogram identifies patients at low risk for future cardiovascular events [6]. Doppler tissue imaging (DTI) is a relatively recent non invasive technique that records myocardial wall motion velocities during different phases of the cardiac cycle. It evaluates global and regional systolic and dia- stolic LV function [7]. The combination of pulsed-wave tissue Doppler (PWDTI) during dobutamine stress echocardiography (DSE) may provide quantitative component to myocardial function assessment by measuring the contraction and relaxation velocities of myocardial fibers from the base to the apex [8-11]. 2. AIM OF THE WORK To assess the diagnostic value of dobutamine stress pulsed-wave DTI compared with standard wall motion analysis in detection of myocardial ischemia in diabetic patients with suspected CAD. 3. PATIENTS AND METHODS 3.1. Study Population The present study included 46 patients with known his- tory of DM. It was performed prospectively in Menou- fyia University Hospital in the period from June 2007 to February 2009. The study was approved by the appropriate Institu- tional Review Board and Institutional Ethical Committee for Human Research. All study subjects provided written informed consent regarding the study procedures. Diabetes mellitus (DM) was diagnosed according to World Health Organization (WHO) and the American Diabetes Association (ADA) [12-14] as fasting blood glucose ≥ 126 mg/dL (≥7.0 mmol/L) or 2 hour post-load plasma glucose ≥ 200 mg/dL (≥11.1 mmol/L) or random plasma glucose ≥ 200 mg/dL. Inclusion criteria: the study included all diabetic pa- tients who have one or more of the following criteria: -Known diabetic patients with 15 years duration in Type I or 10 years duration in Type II or 5 years with one or more risk factor for CAD [15]. -Resting ECG changes suggestive of ischemic heart disease. -Positive exercise stress ECG. -Regional wall motion abnormalities in resting echo- cardiography. Exclusion criteria: patients with one or more of the following were excluded from the study: 1) prior history of acute coronary syndrome; 2)valvular heart disease; 3) suspected or known aortic dissection; 4) acute pulmo- nary embolism; 5) acute myocarditis, endocarditis; 6) severe systemic hypertension (more than 180/110 mmHg); 7) pregnancy; 8) hypertrophic obstructive cardiomyopa- thy, restrictive cardiomyopathy; 9) ventricular aneurysm; 10) serious arrhythmias. 3.2. For Each Patient the Following Was Done 1) Detailed history taking. 2) Full clinical examination. 3) Standard 12-lead resting ECG. 4) Complete two-dimensional echocardiographic ex- amination was done using Acuson XP10 C (Acuson, Mountain view, Calif) system equipped with DTI tech- nology with 2.5 MHz transducer. Examination was per- formed in the left lateral decubitus position for: a) Measurement of wall thickness, dimensions, ejection fraction and resting wall motion abnormality. b) Dobutamine stress echocardiography: Dobutamine stress echocardiography (DSE) requires two-dimensional echocardiography with Doppler and an infusion pump to deliver dobutamine. The area where DSE is performed is equipped with resuscitation equip- ment (defibrillator, endotracheal intubation, etc) [16]. Preparation for Examination: the patients abstain from all oral intake for at least 3 hours before the proce- dure. β-blockers were withheld 48 hours before testing. The procedure as well as side effects and potential com- plications were explained to the patient. If baseline echo- cardiographic images are adequate for assessment of regional wall motion, an intravenous cannula was placed in an arm vein for administration of medications. An infusion solution that consists of 100 mg of dobutamine in 100 mL of 5% dextrose was prepared, and the appro- priate infusion rates in milliliters per minute, based on the patient’s body weight, to provide dosages from 5 µg/kg/min were determined. Atropine (1 mg/10 mL) was available if needed to increase the heart rate. The short- acting β-blocker, propranolol was available to be admin- istrated, if necessary, to reverse the β-adrenergic effects of dobutamine. Nitroglycerin was available for sublin- gual administration as needed. Lidocaine hydrochloride C opyright © 2011 SciRes. WJCD 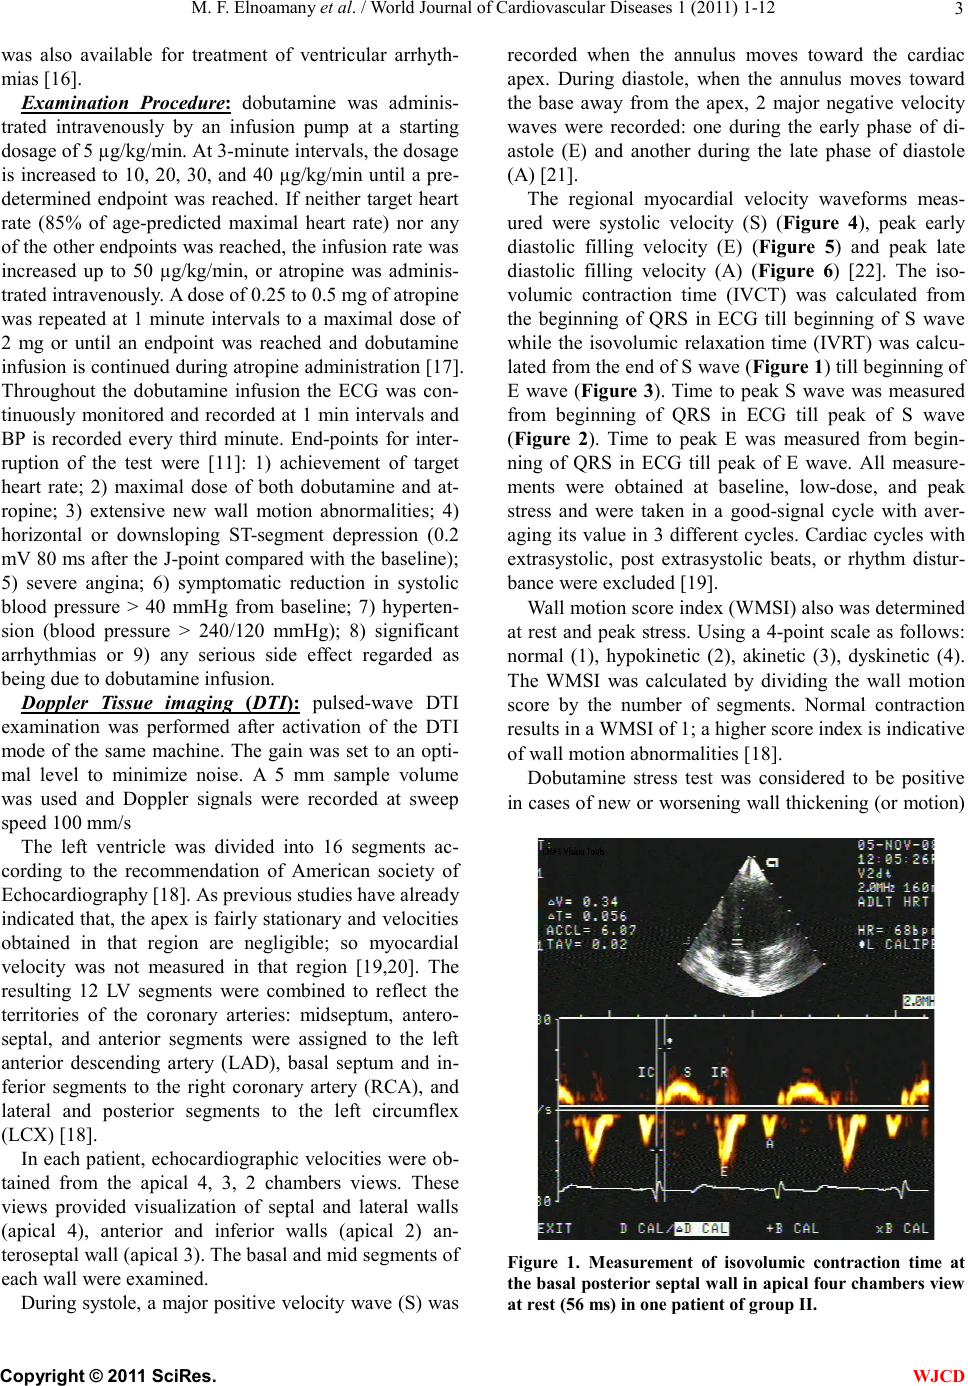 M. F. Elnoamany et al. / World Journal of Cardiovascular Diseases 1 (2011) 1-12 3 was also available for treatment of ventricular arrhyth- mias [16]. Examination Procedure: dobutamine was adminis- trated intravenously by an infusion pump at a starting dosage of 5 µg/kg/min. At 3-minute intervals, the dosage is increased to 10, 20, 30, and 40 µg/kg/min until a pre- determined endpoint was reached. If neither target heart rate (85% of age-predicted maximal heart rate) nor any of the other endpoints was reached, the infusion rate was increased up to 50 µg/kg/min, or atropine was adminis- trated intravenously. A dose of 0.25 to 0.5 mg of atropine was repeated at 1 minute intervals to a maximal dose of 2 mg or until an endpoint was reached and dobutamine infusion is continued during atropine administration [17]. Throughout the dobutamine infusion the ECG was con- tinuously monitored and recorded at 1 min intervals and BP is recorded every third minute. End-points for inter- ruption of the test were [11]: 1) achievement of target heart rate; 2) maximal dose of both dobutamine and at- ropine; 3) extensive new wall motion abnormalities; 4) horizontal or downsloping ST-segment depression (0.2 mV 80 ms after the J-point compared with the baseline); 5) severe angina; 6) symptomatic reduction in systolic blood pressure > 40 mmHg from baseline; 7) hyperten- sion (blood pressure > 240/120 mmHg); 8) significant arrhythmias or 9) any serious side effect regarded as being due to dobutamine infusion. Doppler Tissue imaging (DTI): pulsed-wave DTI examination was performed after activation of the DTI mode of the same machine. The gain was set to an opti- mal level to minimize noise. A 5 mm sample volume was used and Doppler signals were recorded at sweep speed 100 mm/s The left ventricle was divided into 16 segments ac- cording to the recommendation of American society of Echocardiography [18]. As previous studies have already indicated that, the apex is fairly stationary and velocities obtained in that region are negligible; so myocardial velocity was not measured in that region [19,20]. The resulting 12 LV segments were combined to reflect the territories of the coronary arteries: midseptum, antero- septal, and anterior segments were assigned to the left anterior descending artery (LAD), basal septum and in- ferior segments to the right coronary artery (RCA), and lateral and posterior segments to the left circumflex (LCX) [18]. In each patient, echocardiographic velocities were ob- tained from the apical 4, 3, 2 chambers views. These views provided visualization of septal and lateral walls (apical 4), anterior and inferior walls (apical 2) an- teroseptal wall (apical 3). The basal and mid segments of each wall were examined. During systole, a major positive velocity wave (S) was recorded when the annulus moves toward the cardiac apex. During diastole, when the annulus moves toward the base away from the apex, 2 major negative velocity waves were recorded: one during the early phase of di- astole (E) and another during the late phase of diastole (A) [21]. The regional myocardial velocity waveforms meas- ured were systolic velocity (S) (Figure 4), peak early diastolic filling velocity (E) (Figure 5) and peak late diastolic filling velocity (A) (Figure 6) [22]. The iso- volumic contraction time (IVCT) was calculated from the beginning of QRS in ECG till beginning of S wave while the isovolumic relaxation time (IVRT) was calcu- lated from the end of S wave (Figure 1) till beginning of E wave (Figure 3). Time to peak S wave was measured from beginning of QRS in ECG till peak of S wave (Figure 2). Time to peak E was measured from begin- ning of QRS in ECG till peak of E wave. All measure- ments were obtained at baseline, low-dose, and peak stress and were taken in a good-signal cycle with aver- aging its value in 3 different cycles. Cardiac cycles with extrasystolic, post extrasystolic beats, or rhythm distur- bance were excluded [19]. Wall motion score index (WMSI) also was determined at rest and peak stress. Using a 4-point scale as follows: normal (1), hypokinetic (2), akinetic (3), dyskinetic (4). The WMSI was calculated by dividing the wall motion score by the number of segments. Normal contraction results in a WMSI of 1; a higher score index is indicative of wall motion abnormalities [18]. Dobutamine stress test was considered to be positive in cases of new or worsening wall thickening (or motion) Figure 1. Measurement of isovolumic contraction time at the basal posterior septal wall in apical four chambers view at rest (56 ms) in one patient of group II. C opyright © 2011 SciRes. WJCD 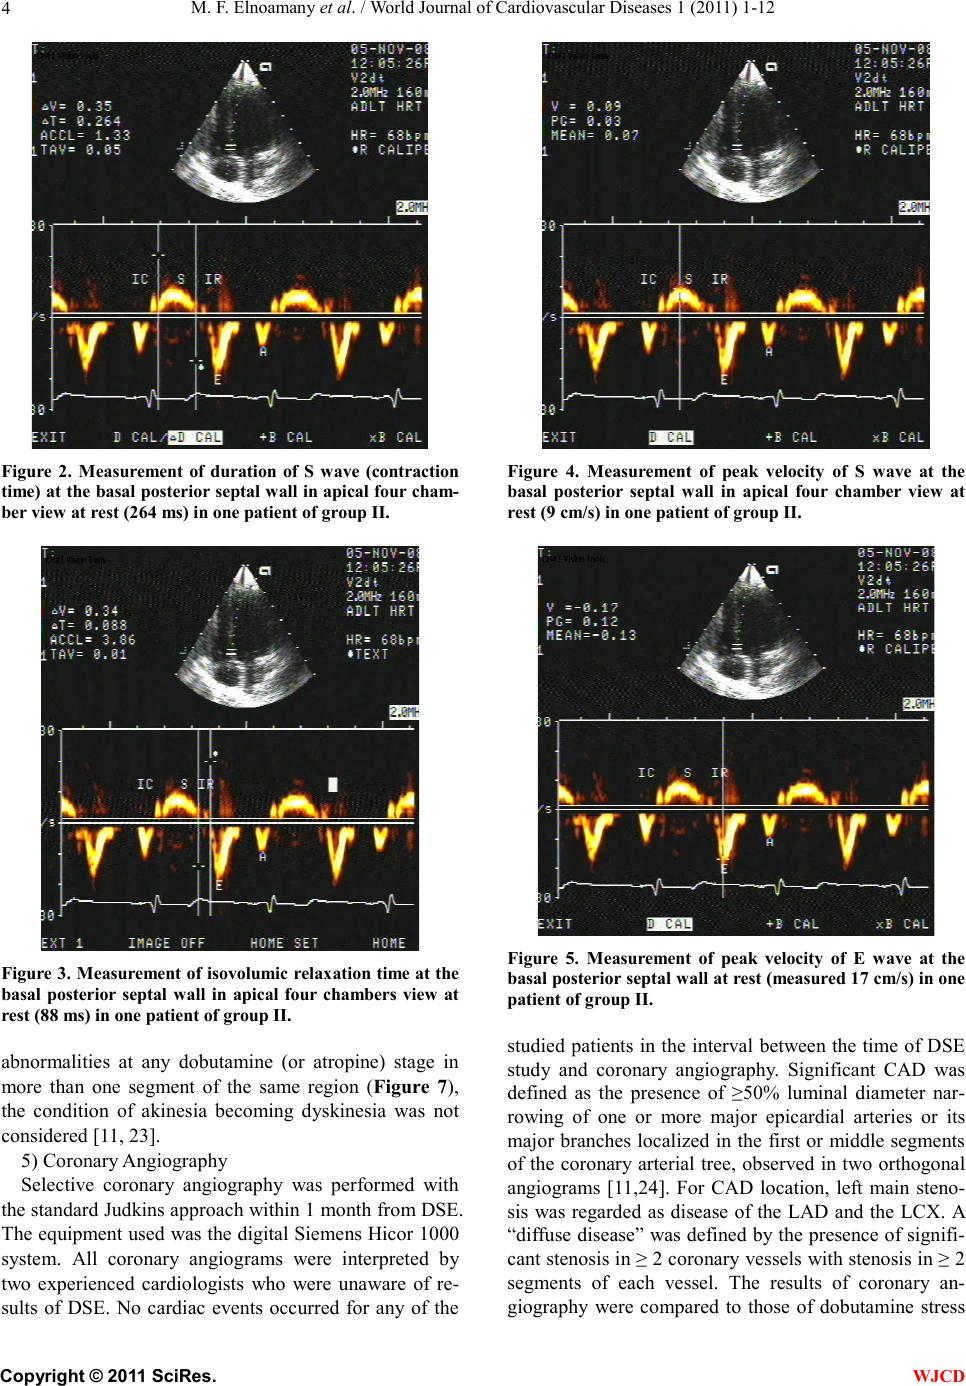 M. F. Elnoamany et al. / World Journal of Cardiovascular Diseases 1 (2011) 1-12 4 Figure 2. Measurement of duration of S wave (contraction time) at the basal posterior septal wall in apical four cham- ber view at rest (264 ms) in one patient of group II. Figure 3. Measurement of isovolumic relaxation time at the basal posterior septal wall in apical four chambers view at rest (88 ms) in one patient of group II. abnormalities at any dobutamine (or atropine) stage in more than one segment of the same region (Figure 7), the condition of akinesia becoming dyskinesia was not considered [11, 23]. 5) Coronary Angiography Selective coronary angiography was performed with the standard Judkins approach within 1 month from DSE. The equipment used was the digital Siemens Hicor 1000 system. All coronary angiograms were interpreted by two experienced cardiologists who were unaware of re- sults of DSE. No cardiac events occurred for any of the Figure 4. Measurement of peak velocity of S wave at the basal posterior septal wall in apical four chamber view at rest (9 cm/s) in one patient of group II. Figure 5. Measurement of peak velocity of E wave at the basal posterior septal wall at rest (measured 17 cm/s) in one patient of group II. studied patients in the interval between the time of DSE study and coronary angiography. Significant CAD was defined as the presence of ≥50% luminal diameter nar- rowing of one or more major epicardial arteries or its major branches localized in the first or middle segments of the coronary arterial tree, observed in two orthogonal angiograms [11,24]. For CAD location, left main steno- sis was regarded as disease of the LAD and the LCX. A “diffuse disease” was defined by the presence of signifi- cant stenosis in ≥ 2 coronary vessels with stenosis in ≥ 2 segments of each vessel. The results of coronary an- giography were compared to those of dobutamine stress C opyright © 2011 SciRes. WJCD 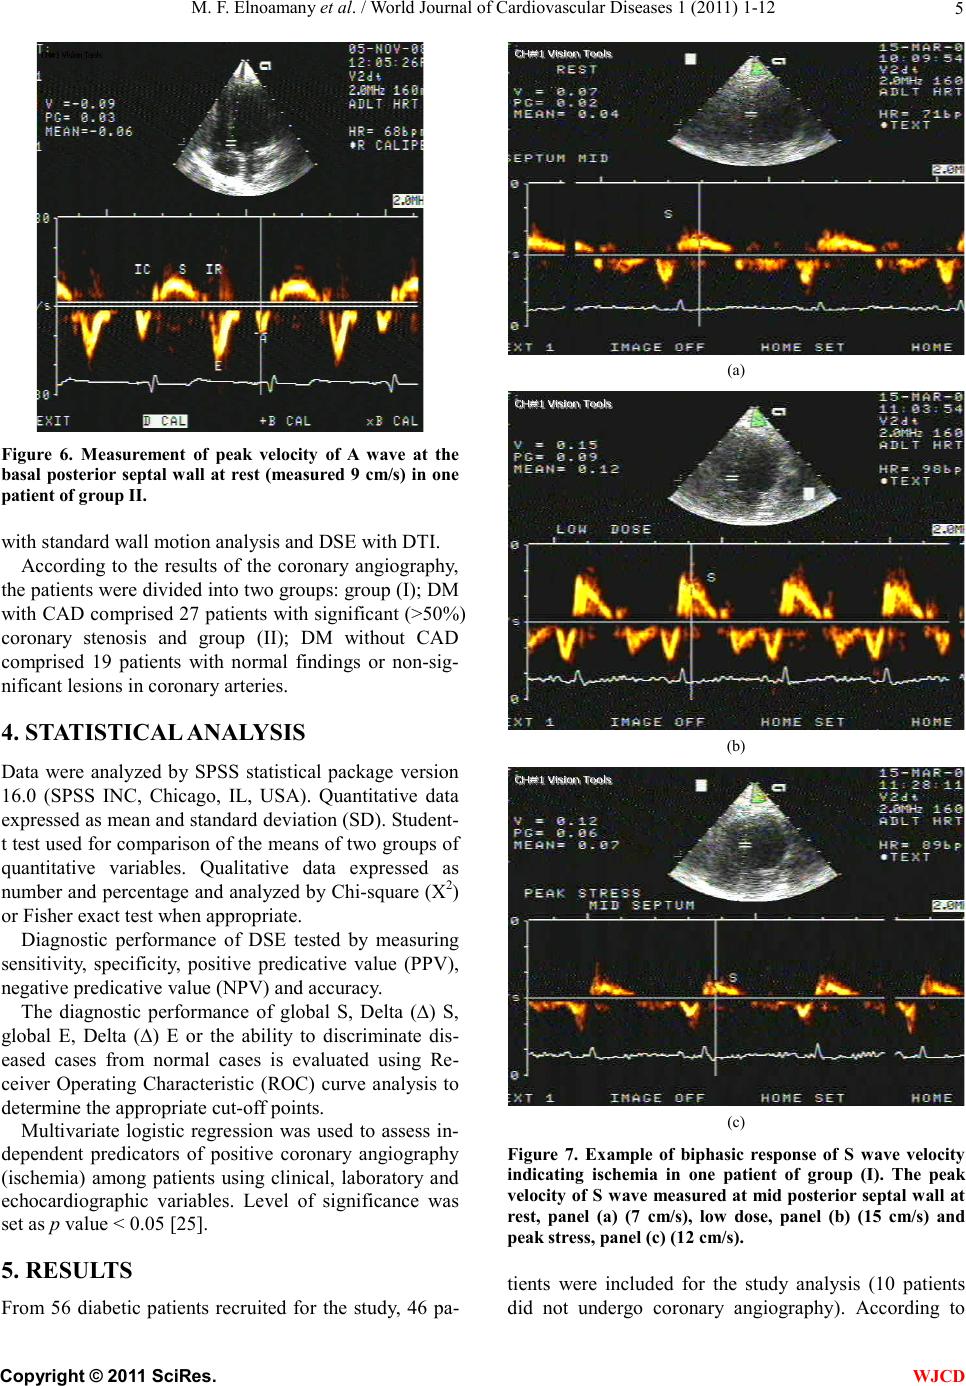 M. F. Elnoamany et al. / World Journal of Cardiovascular Diseases 1 (2011) 1-12 5 Figure 6. Measurement of peak velocity of A wave at the basal posterior septal wall at rest (measured 9 cm/s) in one patient of group II. with standard wall motion analysis and DSE with DTI. According to the results of the coronary angiography, the patients were divided into two groups: group (I); DM with CAD comprised 27 patients with significant (>50%) coronary stenosis and group (II); DM without CAD comprised 19 patients with normal findings or non-sig- nificant lesions in coronary arteries. 4. STATISTICAL ANALYSIS Data were analyzed by SPSS statistical package version 16.0 (SPSS INC, Chicago, IL, USA). Quantitative data expressed as mean and standard deviation (SD). Student- t test used for comparison of the means of two groups of quantitative variables. Qualitative data expressed as number and percentage and analyzed by Chi-square (X2) or Fisher exact test when appropriate. Diagnostic performance of DSE tested by measuring sensitivity, specificity, positive predicative value (PPV), negative predicative value (NPV) and accuracy. The diagnostic performance of global S, Delta (∆) S, global E, Delta (∆) E or the ability to discriminate dis- eased cases from normal cases is evaluated using Re- ceiver Operating Characteristic (ROC) curve analysis to determine the appropriate cut-off points. Multivariate logistic regression was used to assess in- dependent predicators of positive coronary angiography (ischemia) among patients using clinical, laboratory and echocardiographic variables. Level of significance was set as p value < 0.05 [25]. 5. RESULTS From 56 diabetic patients recruited for the study, 46 pa- (a) (b) (c) Figure 7. Example of biphasic response of S wave velocity indicating ischemia in one patient of group (I). The peak velocity of S wave measured at mid posterior septal wall at rest, panel (a) (7 cm/s), low dose, panel (b) (15 cm/s) and peak stress, panel (c) (12 cm/s). tients were included for the study analysis (10 patients did not undergo coronary angiography). According to C opyright © 2011 SciRes. WJCD 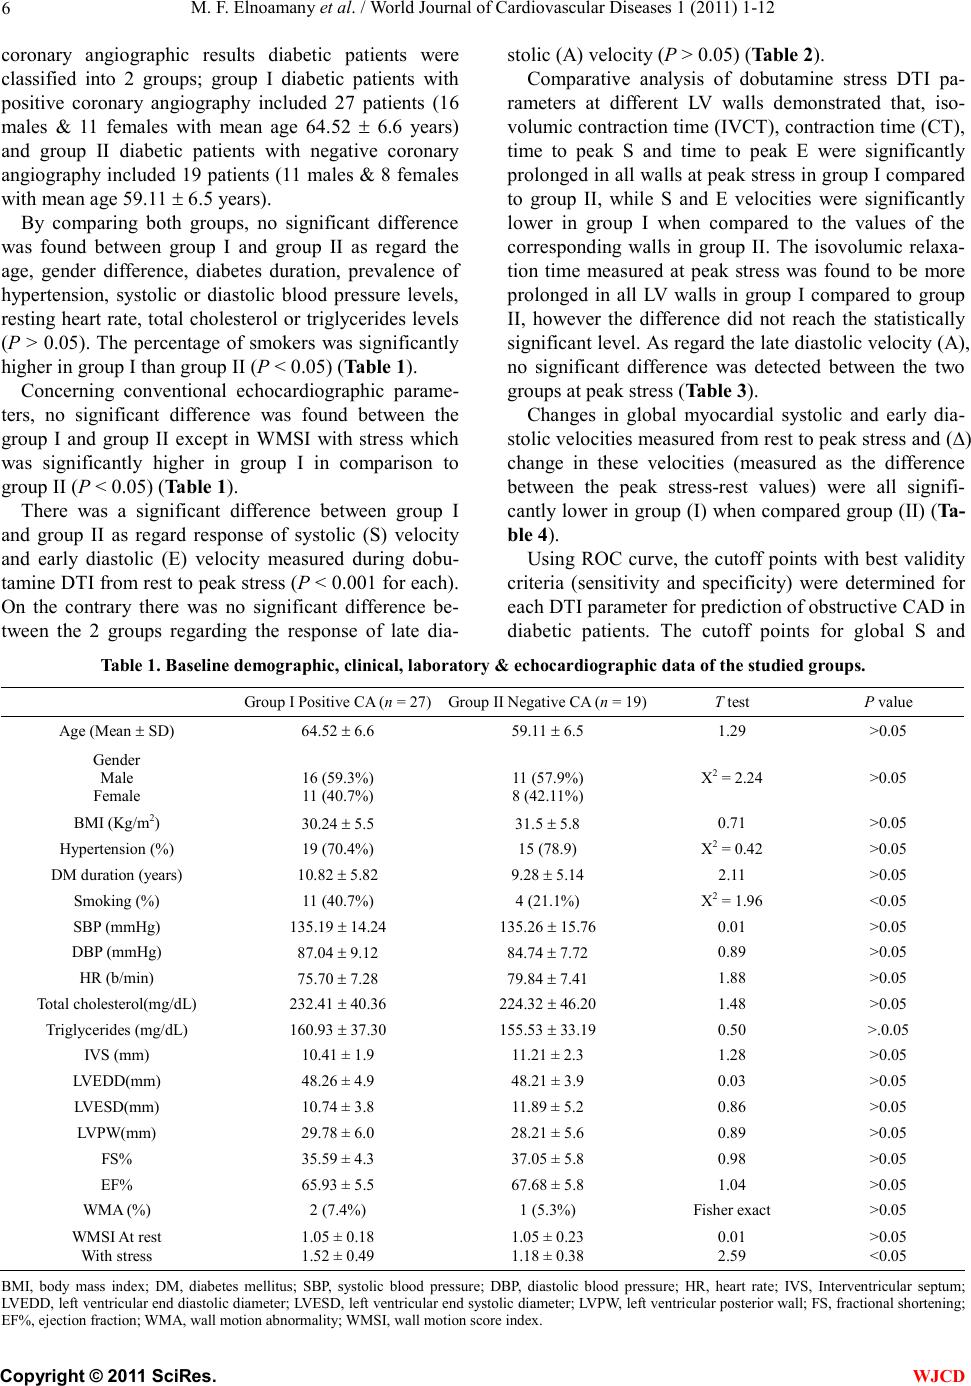 M. F. Elnoamany et al. / World Journal of Cardiovascular Diseases 1 (2011) 1-12 Copyright © 2011 SciRes. 6 WJCD coronary angiographic results diabetic patients were classified into 2 groups; group I diabetic patients with positive coronary angiography included 27 patients (16 males & 11 females with mean age 64.52 6.6 years) and group II diabetic patients with negative coronary angiography included 19 patients (11 males & 8 females with mean age 59.11 6.5 years). By comparing both groups, no significant difference was found between group I and group II as regard the age, gender difference, diabetes duration, prevalence of hypertension, systolic or diastolic blood pressure levels, resting heart rate, total cholesterol or triglycerides levels (P > 0.05). The percentage of smokers was significantly higher in group I than group II (P < 0.05) (Table 1). Concerning conventional echocardiographic parame- ters, no significant difference was found between the group I and group II except in WMSI with stress which was significantly higher in group I in comparison to group II (P < 0.05) (Table 1). There was a significant difference between group I and group II as regard response of systolic (S) velocity and early diastolic (E) velocity measured during dobu- tamine DTI from rest to peak stress (P < 0.001 for each). On the contrary there was no significant difference be- tween the 2 groups regarding the response of late dia- stolic (A) velocity (P > 0.05) (Table 2). Comparative analysis of dobutamine stress DTI pa- rameters at different LV walls demonstrated that, iso- volumic contraction time (IVCT), contraction time (CT), time to peak S and time to peak E were significantly prolonged in all walls at peak stress in group I compared to group II, while S and E velocities were significantly lower in group I when compared to the values of the corresponding walls in group II. The isovolumic relaxa- tion time measured at peak stress was found to be more prolonged in all LV walls in group I compared to group II, however the difference did not reach the statistically significant level. As regard the late diastolic velocity (A), no significant difference was detected between the two groups at peak stress (Table 3). Changes in global myocardial systolic and early dia- stolic velocities measured from rest to peak stress and (∆) change in these velocities (measured as the difference between the peak stress-rest values) were all signifi- cantly lower in group (I) when compared group (II) (Ta- ble 4). Using ROC curve, the cutoff points with best validity criteria (sensitivity and specificity) were determined for each DTI parameter for prediction of obstructive CAD in diabetic patients. The cutoff points for global S and Table 1. Baseline demographic, clinical, laboratory & echocardiographic data of the studied groups. Group I Positive CA (n = 27)Group II Negative CA (n = 19)T test P value Age (Mean SD) 64.52 6.6 59.11 6.5 1.29 >0.05 Gender Male Female 16 (59.3%) 11 (40.7%) 11 (57.9%) 8 (42.11%) X2 = 2.24 >0.05 BMI (Kg/m2) 30.24 5.5 31.5 5.8 0.71 >0.05 Hypertension (%) 19 (70.4%) 15 (78.9) X2 = 0.42 >0.05 DM duration (years) 10.82 5.82 9.28 5.14 2.11 >0.05 Smoking (%) 11 (40.7%) 4 (21.1%) X2 = 1.96 <0.05 SBP (mmHg) 135.19 14.24 135.26 15.76 0.01 >0.05 DBP (mmHg) 87.04 9.12 84.74 7.72 0.89 >0.05 HR (b/min) 75.70 7.28 79.84 7.41 1.88 >0.05 Total cholesterol(mg/dL) 232.41 40.36 224.32 46.20 1.48 >0.05 Triglycerides (mg/dL) 160.93 37.30 155.53 33.19 0.50 >.0.05 IVS (mm) 10.41 ± 1.9 11.21 ± 2.3 1.28 >0.05 LVEDD(mm) 48.26 ± 4.9 48.21 ± 3.9 0.03 >0.05 LVESD(mm) 10.74 ± 3.8 11.89 ± 5.2 0.86 >0.05 LVPW(mm) 29.78 ± 6.0 28.21 ± 5.6 0.89 >0.05 FS% 35.59 ± 4.3 37.05 ± 5.8 0.98 >0.05 EF% 65.93 ± 5.5 67.68 ± 5.8 1.04 >0.05 WMA (%) 2 (7.4%) 1 (5.3%) Fisher exact >0.05 WMSI At rest With stress 1.05 ± 0.18 1.52 ± 0.49 1.05 ± 0.23 1.18 ± 0.38 0.01 2.59 >0.05 <0.05 BMI, body mass index; DM, diabetes mellitus; SBP, systolic blood pressure; DBP, diastolic blood pressure; HR, heart rate; IVS, Interventricular septum; LVEDD, left ventricular end diastolic diameter; LVESD, left ventricular end systolic diameter; LVPW, left ventricular posterior wall; FS, fractional shortening; EF%, ejection fraction; WMA, wall motion abnormality; WMSI, wall motion score index. 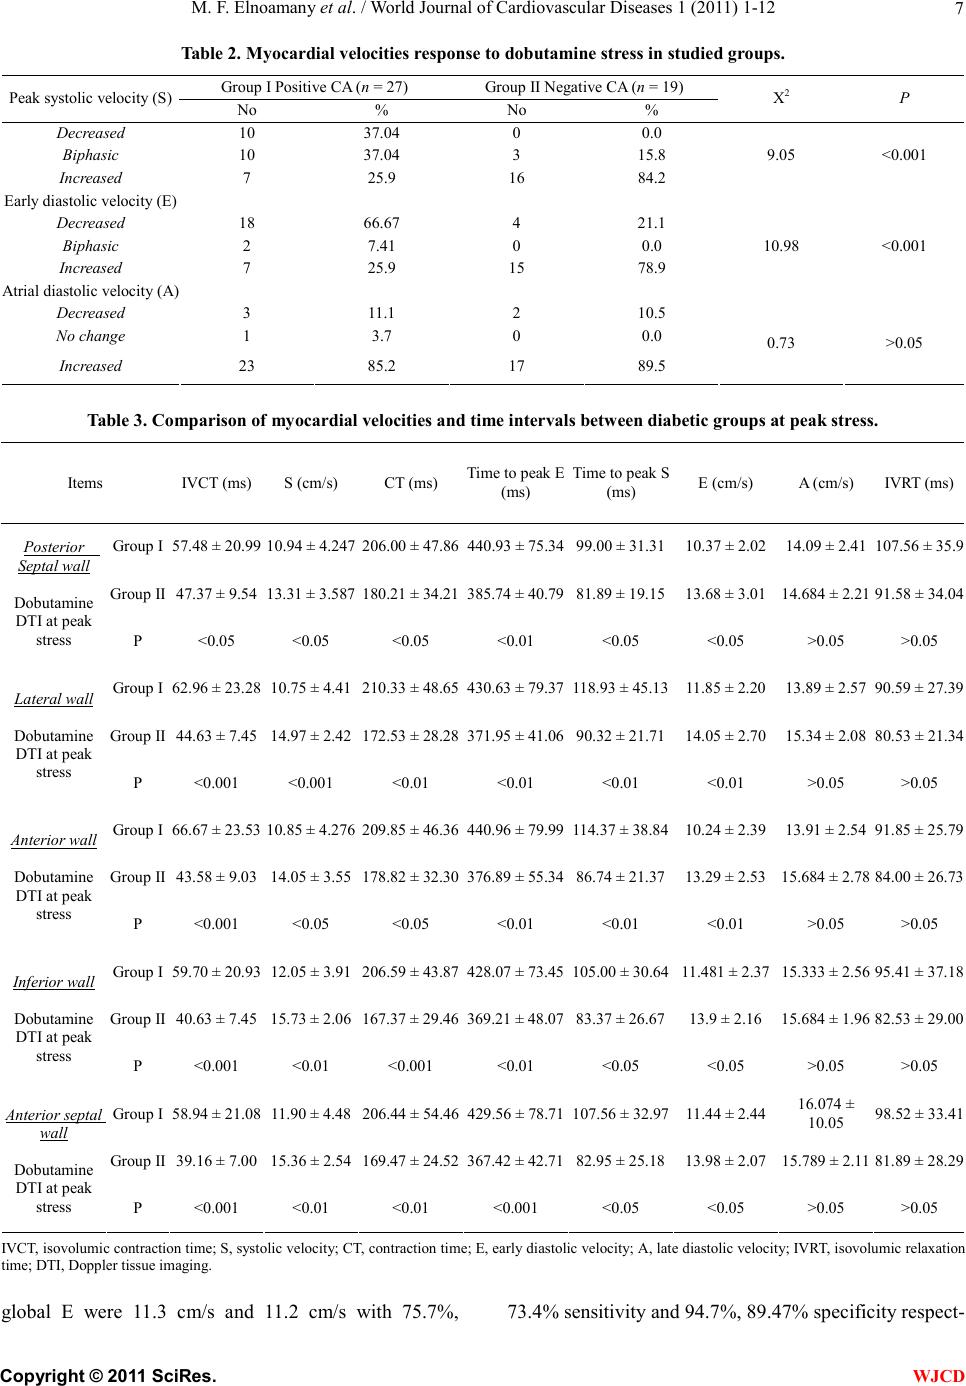 M. F. Elnoamany et al. / World Journal of Cardiovascular Diseases 1 (2011) 1-12 7 Table 2. Myocardial velocities response to dobutamine stress in studied groups. Group I Positive CA (n = 27) Group II Negative CA (n = 19) Peak systolic velocity (S) No % No % X2 P Decreased 10 37.04 0 0.0 Biphasic 10 37.04 3 15.8 Increased 7 25.9 16 84.2 9.05 <0.001 Early diastolic velocity (E) Decreased 18 66.67 4 21.1 Biphasic 2 7.41 0 0.0 Increased 7 25.9 15 78.9 10.98 <0.001 Atrial diastolic velocity (A) Decreased 3 11.1 2 10.5 No change 1 3.7 0 0.0 Increased 23 85.2 17 89.5 0.73 >0.05 Table 3. Comparison of myocardial velocities and time intervals between diabetic groups at peak stress. Items IVCT (ms)S (cm/s) CT (ms) Time to peak E (ms) Time to peak S (ms) E (cm/s) A (cm/s) IVRT (ms) Group I 57.48 ± 20.99 10.94 ± 4.247 206.00 ± 47.86440.93 ± 75.3499.00 ± 31.3110.37 ± 2.02 14.09 ± 2.41 107.56 ± 35.9 Group II 47.37 ± 9.54 13.31 ± 3.587 180.21 ± 34.21385.74 ± 40.7981.89 ± 19.1513.68 ± 3.01 14.684 ± 2.21 91.58 ± 34.04 Posterior Septal wall Dobutamine DTI at peak stress P <0.05 <0.05 <0.05 <0.01 <0.05 <0.05 >0.05 >0.05 Group I 62.96 ± 23.28 10.75 ± 4.41 210.33 ± 48.65430.63 ± 79.37118.93 ± 45.1311.85 ± 2.20 13.89 ± 2.57 90.59 ± 27.39 Group II 44.63 ± 7.45 14.97 ± 2.42 172.53 ± 28.28371.95 ± 41.0690.32 ± 21.7114.05 ± 2.70 15.34 ± 2.08 80.53 ± 21.34 Lateral wall Dobutamine DTI at peak stress P <0.001 <0.001 <0.01 <0.01 <0.01 <0.01 >0.05 >0.05 Group I 66.67 ± 23.53 10.85 ± 4.276 209.85 ± 46.36440.96 ± 79.99114.37 ± 38.8410.24 ± 2.39 13.91 ± 2.54 91.85 ± 25.79 Group II 43.58 ± 9.03 14.05 ± 3.55 178.82 ± 32.30376.89 ± 55.3486.74 ± 21.3713.29 ± 2.53 15.684 ± 2.78 84.00 ± 26.73 Anterior wall Dobutamine DTI at peak stress P <0.001 <0.05 <0.05 <0.01 <0.01 <0.01 >0.05 >0.05 Group I 59.70 ± 20.93 12.05 ± 3.91 206.59 ± 43.87428.07 ± 73.45105.00 ± 30.6411.481 ± 2.37 15.333 ± 2.56 95.41 ± 37.18 Group II 40.63 ± 7.45 15.73 ± 2.06 167.37 ± 29.46369.21 ± 48.0783.37 ± 26.6713.9 ± 2.16 15.684 ± 1.96 82.53 ± 29.00 Inferior wall Dobutamine DTI at peak stress P <0.001 <0.01 <0.001 <0.01 <0.05 <0.05 >0.05 >0.05 Group I 58.94 ± 21.08 11.90 ± 4.48 206.44 ± 54.46429.56 ± 78.71107.56 ± 32.9711.44 ± 2.44 16.074 ± 10.05 98.52 ± 33.41 Group II 39.16 ± 7.00 15.36 ± 2.54 169.47 ± 24.52367.42 ± 42.7182.95 ± 25.1813.98 ± 2.07 15.789 ± 2.11 81.89 ± 28.29 Anterior septal wall Dobutamine DTI at peak stress P <0.001 <0.01 <0.01 <0.001 <0.05 <0.05 >0.05 >0.05 IVCT, isovolumic contraction time; S, systolic velocity; CT, contraction time; E, early diastolic velocity; A, late diastolic velocity; IVRT, isovolumic relaxation time; DTI, Doppler tissue imaging. global E were 11.3 cm/s and 11.2 cm/s with 75.7%, 73.4% sensitivity and 94.7%, 89.47% specificity respect- C opyright © 2011 SciRes. WJCD 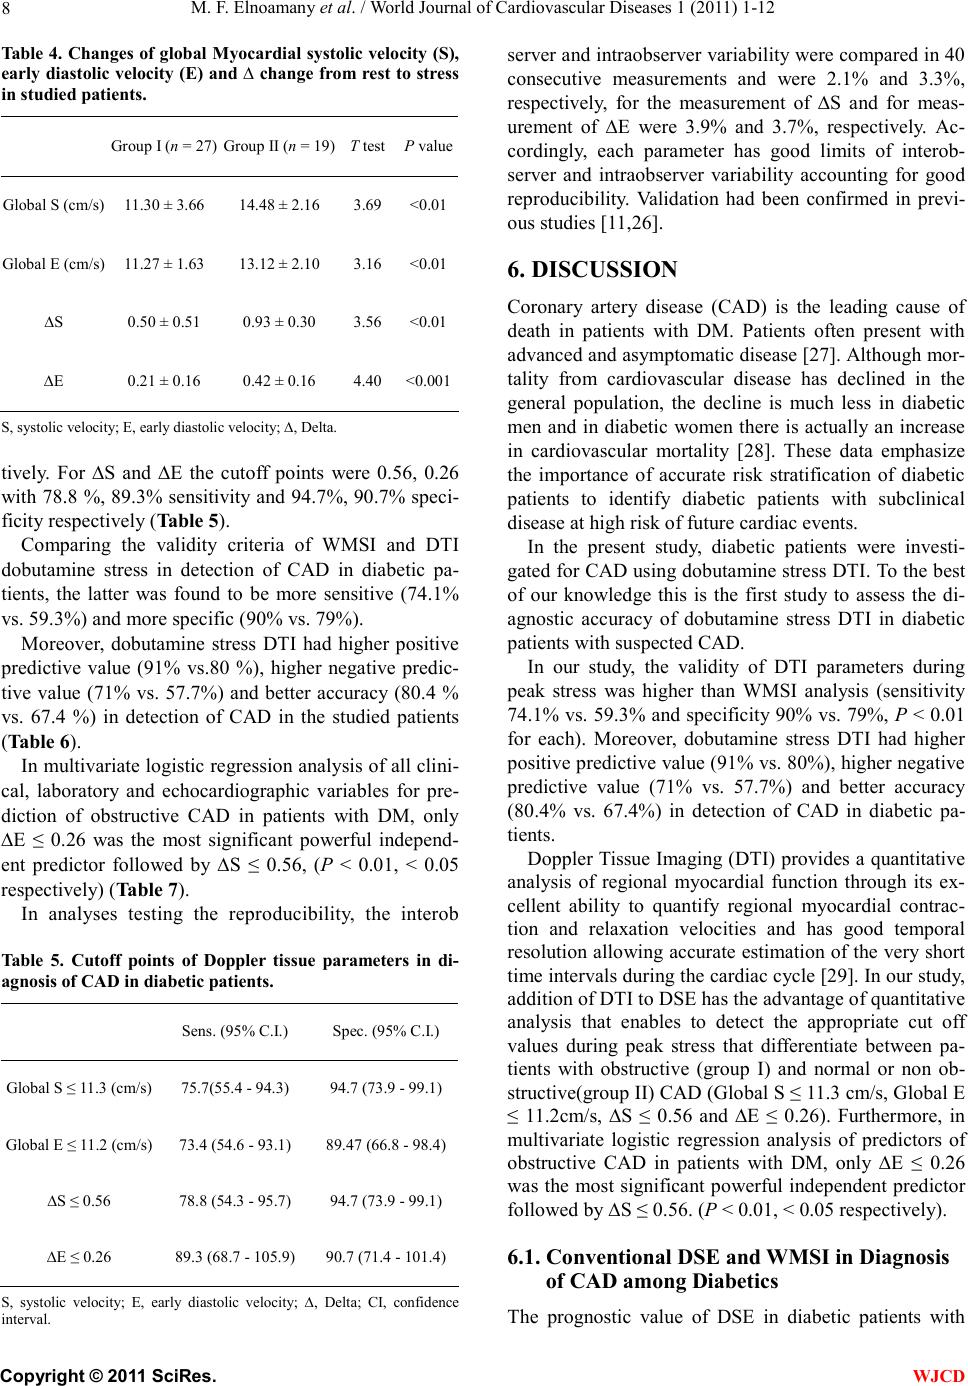 M. F. Elnoamany et al. / World Journal of Cardiovascular Diseases 1 (2011) 1-12 8 Table 4. Changes of global Myocardial systolic velocity (S), early diastolic velocity (E) and ∆ change from rest to stress in studied patients. Group I (n = 27) Group II (n = 19) T testP value Global S (cm/s) 11.30 ± 3.66 14.48 ± 2.16 3.69 <0.01 Global E (cm/s) 11.27 ± 1.63 13.12 ± 2.10 3.16 <0.01 ∆S 0.50 ± 0.51 0.93 ± 0.30 3.56 <0.01 ∆E 0.21 ± 0.16 0.42 ± 0.16 4.40 <0.001 S, systolic velocity; E, early diastolic velocity; ∆, Delta. tively. For ∆S and ∆E the cutoff points were 0.56, 0.26 with 78.8 %, 89.3% sensitivity and 94.7%, 90.7% speci- ficity respectively (Table 5). Comparing the validity criteria of WMSI and DTI dobutamine stress in detection of CAD in diabetic pa- tients, the latter was found to be more sensitive (74.1% vs. 59.3%) and more specific (90% vs. 79%). Moreover, dobutamine stress DTI had higher positive predictive value (91% vs.80 %), higher negative predic- tive value (71% vs. 57.7%) and better accuracy (80.4 % vs. 67.4 %) in detection of CAD in the studied patients (Table 6). In multivariate logistic regression analysis of all clini- cal, laboratory and echocardiographic variables for pre- diction of obstructive CAD in patients with DM, only ∆E ≤ 0.26 was the most significant powerful independ- ent predictor followed by ∆S ≤ 0.56, (P < 0.01, < 0.05 respectively) (Table 7). In analyses testing the reproducibility, the interob Table 5. Cutoff points of Doppler tissue parameters in di- agnosis of CAD in diabetic patients. Sens. (95% C.I.) Spec. (95% C.I.) Global S ≤ 11.3 (cm/s) 75.7(55.4 - 94.3) 94.7 (73.9 - 99.1) Global E ≤ 11.2 (cm/s) 73.4 (54.6 - 93.1) 89.47 (66.8 - 98.4) ∆S ≤ 0.56 78.8 (54.3 - 95.7) 94.7 (73.9 - 99.1) ∆E ≤ 0.26 89.3 (68.7 - 105.9) 90.7 (71.4 - 101.4) S, systolic velocity; E, early diastolic velocity; ∆, Delta; CI, confidence interval. server and intraobserver variability were compared in 40 consecutive measurements and were 2.1% and 3.3%, respectively, for the measurement of ∆S and for meas- urement of ∆E were 3.9% and 3.7%, respectively. Ac- cordingly, each parameter has good limits of interob- server and intraobserver variability accounting for good reproducibility. Validation had been confirmed in previ- ous studies [11,26]. 6. DISCUSSION Coronary artery disease (CAD) is the leading cause of death in patients with DM. Patients often present with advanced and asymptomatic disease [27]. Although mor- tality from cardiovascular disease has declined in the general population, the decline is much less in diabetic men and in diabetic women there is actually an increase in cardiovascular mortality [28]. These data emphasize the importance of accurate risk stratification of diabetic patients to identify diabetic patients with subclinical disease at high risk of future cardiac events. In the present study, diabetic patients were investi- gated for CAD using dobutamine stress DTI. To the best of our knowledge this is the first study to assess the di- agnostic accuracy of dobutamine stress DTI in diabetic patients with suspected CAD. In our study, the validity of DTI parameters during peak stress was higher than WMSI analysis (sensitivity 74.1% vs. 59.3% and specificity 90% vs. 79%, P < 0.01 for each). Moreover, dobutamine stress DTI had higher positive predictive value (91% vs. 80%), higher negative predictive value (71% vs. 57.7%) and better accuracy (80.4% vs. 67.4%) in detection of CAD in diabetic pa- tients. Doppler Tissue Imaging (DTI) provides a quantitative analysis of regional myocardial function through its ex- cellent ability to quantify regional myocardial contrac- tion and relaxation velocities and has good temporal resolution allowing accurate estimation of the very short time intervals during the cardiac cycle [29]. In our study, addition of DTI to DSE has the advantage of quantitative analysis that enables to detect the appropriate cut off values during peak stress that differentiate between pa- tients with obstructive (group I) and normal or non ob- structive(group II) CAD (Global S ≤ 11.3 cm/s, Global E ≤ 11.2cm/s, ∆S ≤ 0.56 and ∆E ≤ 0.26). Furthermore, in multivariate logistic regression analysis of predictors of obstructive CAD in patients with DM, only ∆E ≤ 0.26 was the most significant powerful independent predictor followed by ∆S ≤ 0.56. (P < 0.01, < 0.05 respectively). 6.1. Conventional DSE and WMSI in Diagnosis of CAD among Diabetics T he prognostic value of DSE in diabetic patients with C opyright © 2011 SciRes. WJCD 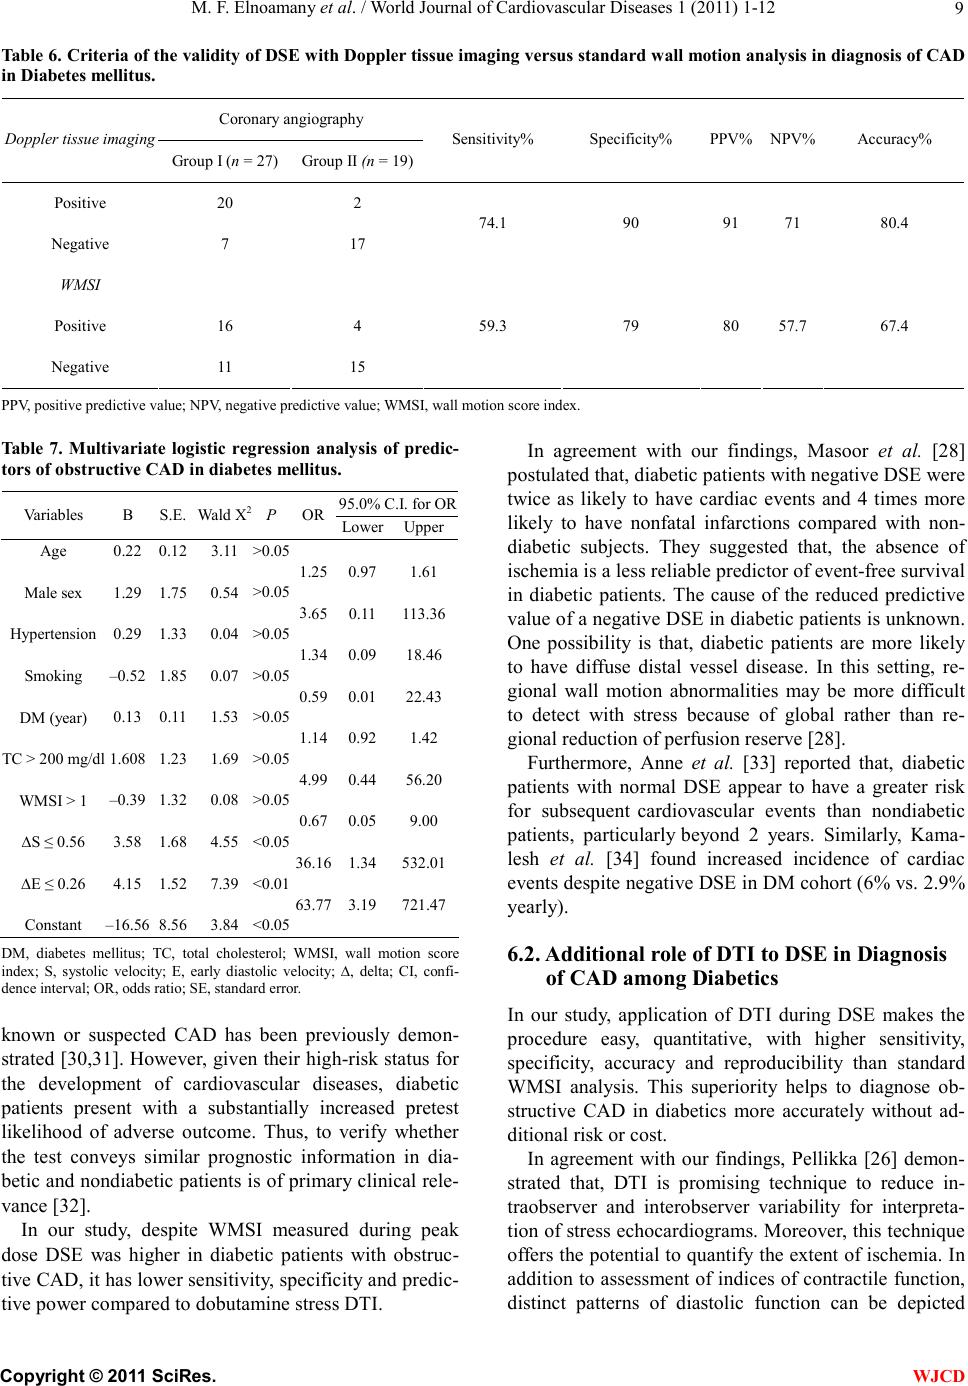 M. F. Elnoamany et al. / World Journal of Cardiovascular Diseases 1 (2011) 1-12 Copyright © 2011 SciRes. 9 WJCD Table 6. Criteria of the validity of DSE with Doppler tissue imaging versus standard wall motion analysis in diagnosis of CAD in Diabetes mellitus. Coronary angiography Doppler tissue imaging Group I (n = 27) Group II (n = 19) Sensitivity% Specificity% PPV% NPV% Accuracy% Positive 20 2 Negative 7 17 74.1 90 91 71 80.4 WMSI Positive 16 4 Negative 11 15 59.3 79 80 57.7 67.4 PPV, positive predictive value; NPV, negative predictive value; WMSI, wall motion score index. Table 7. Multivariate logistic regression analysis of predic- tors of obstructive CAD in diabetes mellitus. 95.0% C.I. for OR Variables B S.E. Wald X2P OR Lower Upper Age Male sex Hypertension Smoking DM (year) TC > 200 mg/dl WMSI > 1 ∆S ≤ 0.56 ∆E ≤ 0.26 Constant 0.22 1.29 0.29 –0.52 0.13 1.608 –0.39 3.58 4.15 –16.56 0.12 1.75 1.33 1.85 0.11 1.23 1.32 1.68 1.52 8.56 3.11 0.54 0.04 0.07 1.53 1.69 0.08 4.55 7.39 3.84 >0.05 >0.05 >0.05 >0.05 >0.05 >0.05 >0.05 <0.05 <0.01 <0.05 1.25 3.65 1.34 0.59 1.14 4.99 0.67 36.16 63.77 0.97 0.11 0.09 0.01 0.92 0.44 0.05 1.34 3.19 1.61 113.36 18.46 22.43 1.42 56.20 9.00 532.01 721.47 DM, diabetes mellitus; TC, total cholesterol; WMSI, wall motion score index; S, systolic velocity; E, early diastolic velocity; ∆, delta; CI, confi- dence interval; OR, odds ratio; SE, standard error. known or suspected CAD has been previously demon- strated [30,31]. However, given their high-risk status for the development of cardiovascular diseases, diabetic patients present with a substantially increased pretest likelihood of adverse outcome. Thus, to verify whether the test conveys similar prognostic information in dia- betic and nondiabetic patients is of primary clinical rele- vance [32]. In our study, despite WMSI measured during peak dose DSE was higher in diabetic patients with obstruc- tive CAD, it has lower sensitivity, specificity and predic- tive power compared to dobutamine stress DTI. In agreement with our findings, Masoor et al. [28] postulated that, diabetic patients with negative DSE were twice as likely to have cardiac events and 4 times more likely to have nonfatal infarctions compared with non- diabetic subjects. They suggested that, the absence of ischemia is a less reliable predictor of event-free survival in diabetic patients. The cause of the reduced predictive value of a negative DSE in diabetic patients is unknown. One possibility is that, diabetic patients are more likely to have diffuse distal vessel disease. In this setting, re- gional wall motion abnormalities may be more difficult to detect with stress because of global rather than re- gional reduction of perfusion reserve [28]. Furthermore, Anne et al. [33] reported that, diabetic patients with normal DSE appear to have a greater risk for subsequent cardiovascular events than nondiabetic patients, particularly beyond 2 years. Similarly, Kama- lesh et al. [34] found increased incidence of cardiac events despite negative DSE in DM cohort (6% vs. 2.9% yearly). 6.2. Additional role of DTI to DSE in Diagnosis of CAD among Diabetics In our study, application of DTI during DSE makes the procedure easy, quantitative, with higher sensitivity, specificity, accuracy and reproducibility than standard WMSI analysis. This superiority helps to diagnose ob- structive CAD in diabetics more accurately without ad- ditional risk or cost. In agreement with our findings, Pellikka [26] demon- strated that, DTI is promising technique to reduce in- traobserver and interobserver variability for interpreta- tion of stress echocardiograms. Moreover, this technique offers the potential to quantify the extent of ischemia. In addition to assessment of indices of contractile function, distinct patterns of diastolic function can be depicted  M. F. Elnoamany et al. / World Journal of Cardiovascular Diseases 1 (2011) 1-12 10 during ischemia with an accuracy which probably cannot be appreciated by the naked eye [26]. Fraser et al. [35] in the MYDISE (Myocardial Dop- pler in Stress Echocardiography) study, used myocardial Doppler velocities during DSE for diagnosis of CAD comparing its results with coronary angiography. They demonstrated that, CAD can be diagnosed accurately and objectively, from off-line measurements of myocar- dial velocities recorded non-invasively by DTI during DSE. Furthermore the accuracy of DTI in diagnosis of CAD is much more than conventional analysis of wall motion abnormalities. [35] Wall motion analysis of the inferobasal segment of the left ventricle is a common problem during DSE and may be a cause for unnecessary coronary angiography. Even resting imaging of the inferobasal segment often demon- strates abnormal motion as a result of close proximity of the mitral valve and atrioventricular groove. During DSE, this impairment may become more prominent and can be interpreted incorrectly as ischemia [36]. Leitman et al. [36] investigated changes of the inferobasal segment during DSE with DTI in 50 patients with more than 70% stenosis of RCA and compared the results with coronary angiography. They reported that, conventional stress echocardiography was falsely positive in 10.3% and falsely negative in 27.3%. When DTI was combined with conventional stress echocardiography, it enhances the diagnosis of inferior ischemia during DSE and it improves sensitivity and specificity up to 81.8% and 97.4% respectively and accordingly can be added to conventional imaging protocol in those patients [36]. 6.3. Changes in Myocardial Velocities and Time Intervals during Dobutamine Stress-DTI In our study, comparing measurements of dobutamine stress DTI parameters at different walls in the two stud- ied groups with results of coronary angiography revealed that, peak systolic velocity (S) and early diastolic veloc- ity (E) become significantly lower in all walls at peak stress in group I compared to group II. Regarding late diastolic velocity (A), there was no significant difference between the two groups. These results are in agreement with data reported by Von Bibra et al. [37] using pulsed Doppler myocardial mapping of 12 left ventricular segments during DSE, and reported, a stress-induced reduction of peak length- ening of early diastolic velocity which was accurate and superior to peak systolic tissue Doppler recordings for detecting coronary artery stenosis [37]. Several investigators had shown Doppler myocardial velocity imaging to be a sensitive alternative to the con- ventional echocardiographic and scintigraphic imaging techniques to evaluate stress tests. The peak velocity response for both systole and diastole has been shown to be significantly lower during dobutamine stress in mal- perfused myocardial regions compared to normal [37, 38]. Jelena et al. [39] examined 60 patients without previ- ous myocardial infarction who underwent DSE. Peak systolic, early and late diastolic velocities were meas- ured at rest and during stress and they found that, there was no significant difference between ischemic and non-ischemic groups in systolic and both diastolic ve- locities at rest. However, pronounced differences devel- oped during stress in all segments, peak systolic velocity in the ischemic group during stress was lower than in the non-ischemic group (P < 0.05). Furthermore clear dif- ference between the two groups was found in the mag- nitud e of early diastolic filling wave (E') during stress (P < 0.04) [39]. Concordant to our findings, Ofelia et al. [40] studied 63 patients for CAD by measuring regional diastolic velocities using DTI during DSE and comparing it to results of coronary angiography and they concluded that, E velocity in patients with CAD showed a lower value at peak stress compared with control (P < 0.001). On the other hand, the A velocity in both groups did not show any significant difference at baseline and peak stress [40]. Similraly, Yamada et al. [38] reported blunting of the E velocity from baseline to peak stress in ischemic compared with nonischemic segments. In our study, the isovolumic contraction time, contrac- tion time, time to peak S and time to peak E showed significant prolongation during peak stress in group I compared with group II. These parameters represent more deterioration of myocardial function (both systolic and diastolic) during peak stress. Although the iso- volumic relaxation time measured at peak stress was found to be more prolonged in group I compared to group II, the difference did not reach the statistically significant level. Similar to our data, Jun et al. [41] reported prolonga- tion of isometric contraction time and ejection time in ischemic patients using pulsed-wave DTI with DSE. Kugacka et al. [42] reported that, the value of iso- volumic relaxtion time corrected for heart rate (IVRTc) = 80 ms at peak dobutamine infusion is able to discrimi- nate patients with residual ischemia from those without with a sensitivity of 80% and a specificity of 70%. However, these time intervals are not so reliable due to different variability of its measurement especially at a higher heart rate when both systolic and diastolic time intervals are getting shorter. Study limitations: the limited number of patients could limit the strength of the findings obtained from the study; future large scale studies are recommended for C opyright © 2011 SciRes. WJCD  M. F. Elnoamany et al. / World Journal of Cardiovascular Diseases 1 (2011) 1-12 11 more validation of the results. The difficulty of quanti- fying the apical segments using myocardial Doppler velocities because of the relatively immobile nature of the apex, and therefore an inherent limitation of the as- sessment of base-apex axis function. However, despite the inability of the test to identify apical wall motion abnormalities, this did not emerge as a major impedi- ment to overall sensitivity in this study. When using the pulsed wave-DTI technique, the procedure is relatively time consuming because of the large number of meas- urements needed to be recorded from the standard myo- cardial segments. Doppler tissue imaging measurements are affected by cardiac translational movements, tether- ing effect and angulations however these could be mini- mized by using more relatively recent DTI techniques and choosing myocardial regions of interest within 15 - 20 degrees of the axis of Doppler interrogation. 7. CONCLUSIONS Doppler tissue imaging is promising technique allowing accurate quantification of ischemia induced regional diastolic and systolic dysfunction and when used during dobutamine stress echocardiography, it adds new dimen- sion in diagnosis of myocardial ischemia in diabetic pa- tients. It is more sensitive, specific, accurate and repro- ducible than standard wall motion analysis for recogni- tion of significant CAD in such category of patients. REFERENCES [1] Haffner, S.M., Lehto, S., Rönnemaa, T., Pyörälä, K. and Laakso, M. (1998) Mortality from coronary artery dis- ease in subjects with type 2 diabetes and in nondiabetic subjects with and without prior myocardial infarction. The New England Journal of Medicine, 339, 229-234. doi:10.1056/NEJM199807233390404 [2] Herlitz, J., Malmberg, K., Karlsson, B., Ryden, L. and Hjalmarson, A. (1988) Mortality and morbidity during a five year follow up of diabetics with myocardial infarc- tion. Acta Medical Scandinavica, 24, 31-38. [3] Cosson, E., Paycha, F., Paries, J., Cattan, S., Ramadan, A., Meddah, D., Attali, J.R. and Valensi, P. (2004) De- tecting silent coronary stenosis and stratifying cardiac risk in patients with diabetes: ECG stress test or exercise myocardial scintigraphy. Diabet Medicine, 21, 342-348. d oi : 10 . 1111/j. 1 464-5491.2004.01157.x [4] Nesto, R.W. and Phillips, RT. (1986) Asymptomatic myocardial ischemia in diabetic patients. The American Journal of Medicine, 80, 40-47. do i:1 0. 10 16 / 00 02 - 93 43 (86 ) 90 45 1- 1 [5] Chuah, S., Pellika, P.A. and Roger, V.L. (1998) Role of dobutamine stress echocardiography in predicting out- come in 860 patients with known or suspected coronary artery disease. Circulation, 97, 1474-1480. [6] Carlos, M.E., Smart, S.C. and Wynsen, J.C. (1997) Dobutamine stress echocardiography for risk stratifica- tion after myocardial infarction. Circulation, 95, 1402- 1410. [7] Rambaldi, R., Poldermans, D., Bax, J., Boersma, E., Elhendy, A., Vletter, W., Roelandt, J. and Valkema, R. (2000) Doppler tissue velocity sampling improves diag- nostic accuracy during dobutamine stress echocardi- ography for the assessment of viable myocardium in pa- tients with severe left ventricular dysfunction. European Heart Journal, 21, 1091-1098. do i:1 0. 10 53/euhj. 19 99 .1 85 7 [8] Isaa, K., Munoz del Romeral, L., Lee, E. and Schiller, N.B. (1993) Quantitation of the motion of cardiac base in normal subjects by Doppler echocardiography. Journal of the American Society Echocardiography, 6, 166-176. [9] Galiuto, L., Ignone, G. and De Maria, A. (1998) Contrac- tion and relaxation velocities of the normal left ventricle using pulsed-wave tissue Doppler echocardiography. The American Journal of Cardiology, 81, 609-614. doi:10.1016/S0002-9149(97)00990-9 [10] Sutherland, G.R., Stewart, M.J., Groundstroem, K.W., Moran, C.M., Fleming, A., Guell-Peris, F.J., Riemersma, R.A., Fenn, L.N., Fox, K.A. and McDicken, W.N. (1994) Color Doppler myocardial imaging: A new technique for the assessment of myocardial function. Journal of the American Society Echocardiography, 7, 441-458. [11] Badran, H.M., Elnoamany, M.F and Seteha, M. (2007) Tissue velocity imaging with dobutamine stress echocar- diography—A quantitative technique for identification of coronary artery disease in patients with left bundle branch block. Journal of the American Society Echocar- diog ra phy, 20, 820-831. doi:10.1016/j.echo.2007.01.007 [12] WHO Consultation (1999) Definition, diagnosis and classification of diabetes mellitus and its complications. Part 1: diagnosis and classification of diabetes mellitus. Report No. 99.2. World Health Organization, Geneva. [13] MacIndoe, J., Hoffman, R. and Kraus, V. (1997) Report of the expert committee on the diagnosis and classifica- tion of diabetes mellitus. Diabetes Care, 20, 1183-1197. [14] American Diabetes Association (2005) Diagnosis and classification of diabetes mellitus. Diabetes Care, 28, S37-S42. doi:10.2337 /diacare.2 8 .suppl_1.S37 [15] American Diabetes Association (2003) Physical activ- ity/exercise and diabetes mellitus: position statement of the American Diabetes Association. Diabetes Care, 26, S73-S77. doi:10.2337 /diacare.2 6 .2007 .S73 [16] Becher, H., Chambers, J., Fox, K., Jones, R., Leech, G., Masani, N., Monaghan, M., More, R., Nihoyannopoulos, P., Rimington, H., Senior, R. and Warton, G. (2004) Brit- ish Society of Echocardiography Policy Committee. BSE procedure guidelines for the clinical application of stress echocardiography, recommendations for performance and interpretation of stress echocardiography: A report of the British Society of Echocardiography Policy Commit- tee. Hea rt, 90 , 23-30. doi:10.1136/hrt.2004.047985 [17] Bellotti, P., Fioretti, P., Forster, T., McNeill, A., El Said, M. and Salustri, A. (1993) Reproducibility of the dobu- tamine-atropine echocardiography stress test. Echocar- diog ra phy, 10, 93-97. doi:10.1111/j.1540-8175.1993.tb00017.x [18] Committee on Physician Training and Education of the American Society of Echocardiography (1998) Recom- mendations for performance and interpretation of stress C opyright © 2011 SciRes. WJCD  M. F. Elnoamany et al. / World Journal of Cardiovascular Diseases 1 (2011) 1-12 Copyright © 2011 SciRes. 12 WJCD echocardiography. Journal of the American Society Echo- cardiography, 11, 97-104. doi:10.1016/S0894-7317(98)70132-4 [19] Cain, P., Baglin, T., Case, C., Spicer, D., Short, L. and Marwick, T. (2001) Application of tissue Doppler to in- terpretation of dobutamine echocardiography: Compari- son with quantitative coronary angiography. The Ameri- can Journal of Cardiology, 87, 525-531. doi:10.1016/S0002-9149(00)01425-9 [20] Pasquet, A., Armstrong, G., Beachler, L., Lauer, M. and Marwick, T. (1999) Use of segmental tissue Doppler ve- locity to quantitate exercise echocardiography. Journal of the American Society Echocardiography, 12, 901-912. doi:10.1016/S0894-7317(99)70142-2 [21] Erbel, R., Wallbridge, D.R., Zamorano, J., Drozdz, J. and Nesser, J. (1999) Tissue Doppler echocardiography. Heart, 76 , 193-196. doi:10.1136/hrt.76.3.193 [22] Pai, R. and Gill, K. (1998) Amplitudes, durations, and timings of apically directed left ventricular myocardial velocities: Their normal pattern and coupling to ven- tricular filling and ejection. Journal of the American Soci- ety Echocardiography, 11 , 105-111. doi:10.1016/S0894-7317(98)70067-7 [23] Geleijnse, M.L., Fioretti, P.M. and Roelandt, J.R. (1997) Methodology, feasibility, safety and diagnostic accuracy of dobutamine stress echocardiography. Journal of American College Cardiology, 30, 595-606. doi:10.1016/S0735-1097(97)00206-4 [24] Reiber, J.H., Serrus, P.W., Kooijman, C.J., Wijns, W., Slager, C.J., Gerbrands, J.J., Schuurbiers, J.C., den Boer, A. and Hugen-Holtz, P.G. (1985) Assessment of short-, medium-, and long-term variations in arterial dimensions from computer-assisted quantitation of coronary cinean- giograms. Circulation, 71, 280-288. doi:10.1161/01.CIR.71.2.280 [25] Saunders, B.D. and Trapp, R.G. (1994) Basic and clinical biostatistics. 2nd Edition, Appleton & Lange, Norwalk. [26] Pellikka, P. (2005) Stress echocardiography for the diag- nosis of coronary artery disease: Progress towards quan- tification. Current Opinion in Cardiology, 20 , 395-398. do i:1 0. 10 97 / 01 . h co. 00 00 17 2705.9064 0. 40 [27] Dhakshinamurthy, V., Eric, L., Avijit, L. and Jeroen, J. (2006) The role of non-invasive imaging in the risk stratification of asymptomatic diabetic subjects. Euro- pean Heart Journal, 27, 905-912 [28] Masoor, K., Robert, M. and Stephen, S. (2002) Prognos- tic value of a negative stress echocardiographic study in diabetic patients. American Heart Journal, 143, 163-168. do i:1 0. 10 67 / mh j. 2 00 2. 11937 7 [29] McDicken, W.N., Sutherland, G.R., Moran, C.M. and Gordon, L.N. (1992) Colour Doppler velocity imaging of the myocardium. Ultrasound in Medicine Biology, 18, 651-654. doi:10.1016/0301-5629(92)90080-T [30] Marwick, T.H., Case, C., Sawada, S., Vasey, C., Short, L., Lauer, M. (2002) Use of stress echocardiography to pre- dict mortality in patients with diabetes and known or sus- pected coronary artery disease. Diabetes Care, 25, 1042- 1048. doi :10. 2337 / d iacare. 25 .6. 1042 [31] Sozzi, F.B., Elhendy, A., Roelandt, J.R., Van Domburg, R.T., Schinkel, A.F., Vourvouri, E.C., Bax, J.J., De Sutter, J., Borghetti, A. and Poldermans, D. (2003) Prognostic value of dobutamine stress echocardiography in patients with diabetes. Diabetes Care, 26, 1074-1048. doi :10. 2337 / d iacare.2 6. 4.1 07 4 [32] Lauro, C., Riccardo, B., Rosa, S., Patrizia, L., Francesco, B. and Eugenio, P. (2006) Prognostic value of pharma- cological stress echocardiography in diabetic and nondiabetic patients with known or suspected coronary artery disease. Journal of American College Cardiology, 47, 605-610. doi :10 .101 6 /j.j acc.20 0 5.09 .03 5 [33] Anne, R., Marc, Z. and Gary, J.B. (2006) Stress testing in patients with diabetes mellitus. Circulation, 113, 583- 592. doi:10.1161/CIRCULATIONAHA.105.584524 [34] Kamalesh, M., Matorin, R. and Sawada, S. (2002) Prog- nostic value of a negative stress echocardiographic study in diabetic patients. American Heart Journal, 143, 163- 168. doi:10.1067/mhj.2002.119377 [35] Fraser, A.G., Mädler, C.F., Payne, N., Wilkenshoff, U. and Sutherland, G.R. (2003) Non-invasive diagnosis of coronary artery disease by quantitative stress echocardi- ography: Optimal diagnostic models using off-line tissue Doppler in the MYDISE study. European Heart Journal, 24, 1584-1594. doi:10.1016/S0195-668X(03)00099-X [36] Leitman, M., Sidenko, S., Wolf, R., Sucher, E., Rosenblatt, S., Peleg, E., Krakover, R. and Vered, Z. (2003) Improved detection of inferobasal ischemia dur- ing dobutamine echocardiography with Doppler tissue imaging. Journal of the American Society Echocardi- ography, 16, 403-408. doi:10.1016/S0894-7317(03)00015-4 [37] Von Bibra, H., Tuchnitz, A., Klein, A., Schneider-Eicke, J., Schömig, A. and Schwaiger, M. (2000) Regional dia- stolic function by pulsed Doppler myocardial mapping for the detection of left ventricular ischemia during pharmacologic stress testing. Journal of American Col- lege Cardiology, 36, 444-452. doi:10.1016/S0735-1097(00)00735-X [38] Yamada, E., Garcia, M., Thomas, J.D. and Marwick, T.H. (1998) Myocardial Doppler velocity imaging—A quanti- tative technique for interpretation of dobutamine echo- cardiography. Journal of American College Cardiology, 82, 806-809. [39] Jelena, C., George, R., Aleksandras, L., Diana, Z., Alfre- das R. and Virginija, G. (2004) Is post-systolic motion the optimal ultrasound parameter to detect induced ischemia during dobutamine stress echocardiography? European Heart Journal, 25, 932-942. do i:1 0. 10 16 / j . eh j. 20 04 . 04 .0 05 [40] Ofelia, N., Peter, C., Colin, C., Sudhir, W. and Thomas, H. (2002) Determinants of tissue Doppler measures of regional diastolic function during dobutamine stress echocardiography. American Heart Journal, 144, 516- 523. doi:10.1067/mhj.2002.123836 [41] Jun, T., Hirono, O., Kubota, I., Okuyama, M., Fukui, A., Ya ma ki , M. and Tomoike, H. (2000) Dobutamine stress echocardiography for the diagnosis of myocardial viabil- ity: Assessment of left ventricular systolic velocities in longitudinal axis by pulsed Doppler tissue imaging. Japanese Heart Journal, 41, 435-443. do i:1 0. 15 36/jhj.41 .4 35 [42] Kugacka, A., Claeys, M., Rademakers, F. (1998) Dia- stolic indexes during dobutamine stress echocardiogra- phy in patients early after myocardial infarction. Journal of the American Society Echocardiography, 11 , 26-35. doi:10.1016/S0894-7317(98)70117-8
|