 Materials Sciences and Applicatio ns, 2011, 2, 1355-1366 doi:10.4236/msa.2011.210184 Published Online October 2011 (http://www.SciRP.org/journal/msa) Copyright © 2011 SciRes. MSA 1355 Theoretical Investigations of Ti-Based Binary Shape Memory Alloys Rita John1, Hannah Ruben2,3 1Department of Theoretical Physics, University of Madras, Chennai, India; 2Post Graduate Department of Physics, Women’s Chris- tian College, Chennai, India; 3Mother Teresa Women’s University, Kodaikanal, India. Email: rita_john@sify.com, hancath2007@yahoo.co.in Received June 15th, 2011; revised July 8th, 2011; accepted August 17th, 2011. ABSTRACT The electronic structure and ground state properties of TiX (X = Fe, Ni, Pd, Pt and Cu) type Shape Memory alloys have been calculated using the self consistent Tight-Binding Linear Muffin Tin Orbital (TB-LMTO) method. The systematic total energy studies made on TiX alloys in both B2 and (B19/B19’) structures successfully explain the structural stabil- ity of these compounds. The equilibrium lattice parameters, bulk moduli (Bo), cohesive energy (Ecoh) and heat of forma- tion (∆H) are calculated for these systems and compared with the available experimental and other theoretical results. The bonding nature of these TiX alloys is analyzed via the density of states (DOS) histogram. Keywords: Shape Memory Alloys, TB-LMTO, B2-B19 Phases, Structural Parameters 1. Introduction Martensitic alloys have been a hot topic for several dec- ades due to shape memory effect and many other peculiar properties present during their martensitic phase trans- formation [1,2]. A lot of experimental and theoretical works have been devoted to study this phenomenon yet many aspects of the transformation are still elusive. It has stimulated many investigations in exploring the differ- ence in electronic structure of different structural phases involved in the transformation from martensite phase (B19/B19’) to austenite phase (B2). To investigate Martensitic phase transformation from the electronic point of view, Ye et al. [3] have used first principles total energy calculations to show some inter- esting correlations between the relative stability of B2 and (B19/B19’) phases with the electronic structure for TiNi, TiPd and TiPt alloys. The main objective of the paper is to study the elec- tronic and structural properties of TiX (X = Fe, Ni, Pd, Pt and Cu) alloys in both (B2) and (B19/B19’) phases cal- culated using the self consistent Tight-Binding Linear Muffin Tin Orbital (TB-LMTO) method. The paper is divided into six sections. Section 2 gives a brief outline of the computational details of the Tight-Binding Linear Muffin Tin Orbital scheme. The results of the total en- ergy calculations obtained for cubic (B2) and ortho- rhombic/monoclinic (B19/B19’) phases of TiX alloys are presented in Section 3. The band structure and density of states (DOS) for TiX (X = Fe, Ni, Pd, Pt and Cu) alloys in both phases are reported in Section 4. Section 5 deals with the theoretically calculated cohesive energy, heat of formation which are compared with the experimentally reported available values. The bulk modulus values ob- tained for the alloys using the universal equation of state (UEOS) analysis are reported in Section 6. The important conclusions arrived from the above studies are given in the last Section. 2. Method of Calculation The band structure and total energy studies are made within the atomic-sphere approximation by means of Tight Binding-Linear Muffin Tin Orbital method (TB- LMTO) [4], which is the exact transformation of Ander- sen’s linear muffin-tin orbitals [5] to localize short- ranged or tight-binding orbitals. The potential is calcu- lated within the density-functional prescription under local-density approximation (LDA) using the parame- terization scheme of von Barth and Hedin [6]. The TB (screened) representation of the LMTO method makes the computation fast for the following reasons: 1) the MTO’s are linear in energy and hence, unlike the aug- mented plane-wave or Korringa-Kohn-Rostoker methods we can get the eigen values within single diagonalization; 2) a solution to an eigen value equation of size only 9 × 9 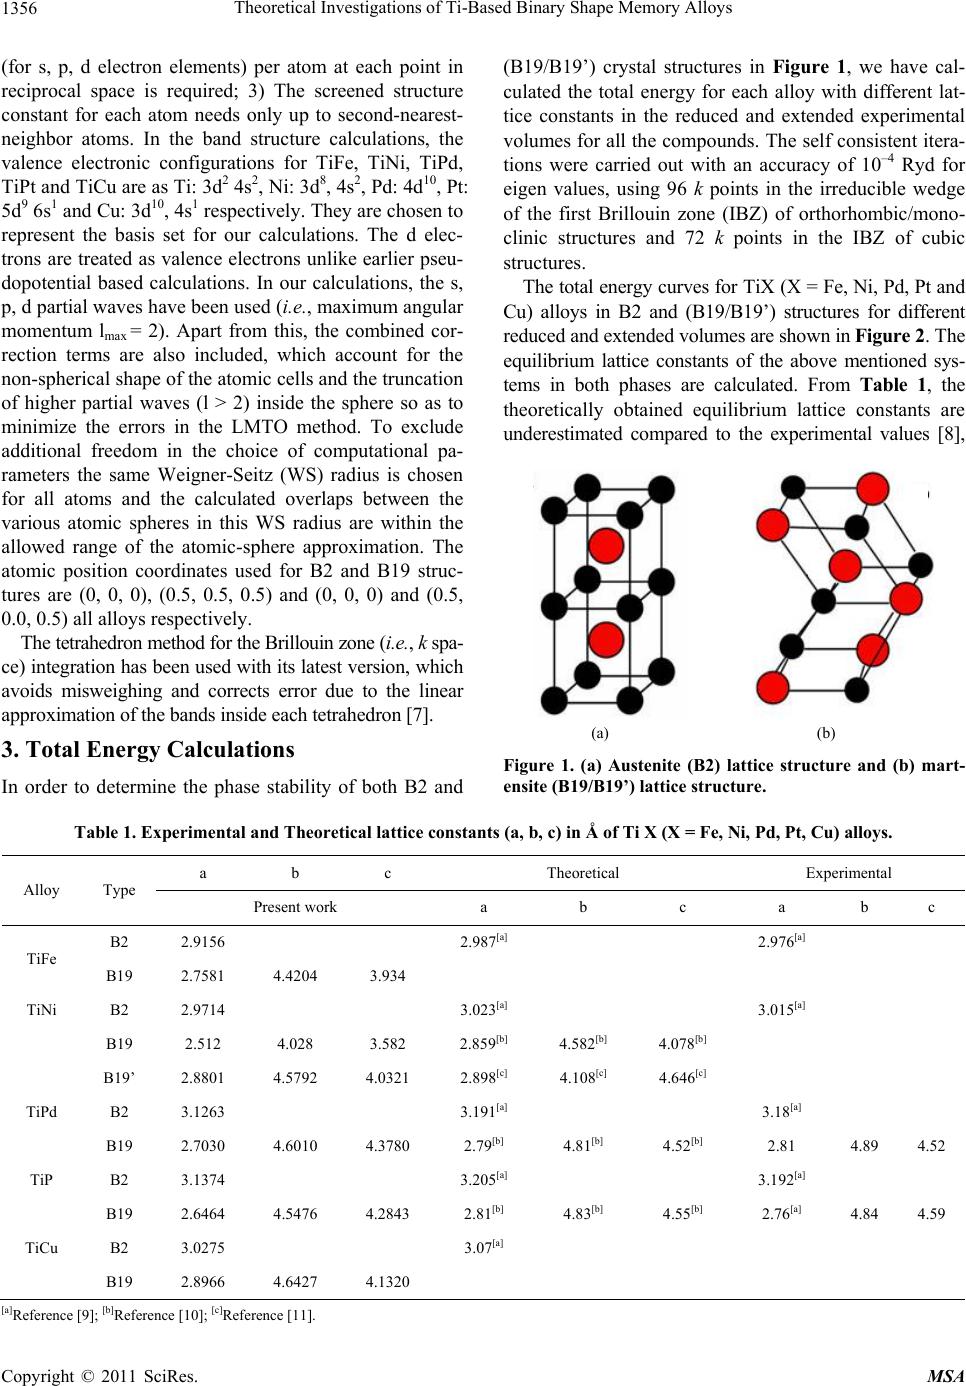 Theoretical Investigations of Ti-Based Binary Shape Memory Alloys 1356 (for s, p, d electron elements) per atom at each point in reciprocal space is required; 3) The screened structure constant for each atom needs only up to second-nearest- neighbor atoms. In the band structure calculations, the valence electronic configurations for TiFe, TiNi, TiPd, TiPt and TiCu are as Ti: 3d2 4s2, Ni: 3d8, 4s2, Pd: 4d10, Pt: 5d9 6s1 and Cu: 3d10, 4s1 respectively. They are chosen to represent the basis set for our calculations. The d elec- trons are treated as valence electrons unlike earlier pseu- dopotential based calculations. In our calculations, the s, p, d partial waves have been used (i.e., maximum angular momentum lmax = 2). Apart from this, the combined cor- rection terms are also included, which account for the non-spherical shape of the atomic cells and the truncation of higher partial waves (l > 2) inside the sphere so as to minimize the errors in the LMTO method. To exclude additional freedom in the choice of computational pa- rameters the same Weigner-Seitz (WS) radius is chosen for all atoms and the calculated overlaps between the various atomic spheres in this WS radius are within the allowed range of the atomic-sphere approximation. The atomic position coordinates used for B2 and B19 struc- tures are (0, 0, 0), (0.5, 0.5, 0.5) and (0, 0, 0) and (0.5, 0.0, 0.5) all alloys respectively. The tetrahedron method for the Brillouin zone (i.e., k spa- ce) integration has been used with its latest version, which avoids misweighing and corrects error due to the linear approximation of the bands inside each tetrahedron [7]. 3. Total Energy Calculations In order to determine the phase stability of both B2 and (B19/B19’) crystal structures in Figure 1, we have cal- culated the total energy for each alloy with different lat- tice constants in the reduced and extended experimental volumes for all the compounds. The self consistent itera- tions were carried out with an accuracy of 10–4 Ryd for eigen values, using 96 k points in the irreducible wedge of the first Brillouin zone (IBZ) of orthorhombic/mono- clinic structures and 72 k points in the IBZ of cubic structures. The total energy curves for TiX (X = Fe, Ni, Pd, Pt and Cu) alloys in B2 and (B19/B19’) structures for different reduced and extended volumes are shown in Figure 2. The equilibrium lattice constants of the above mentioned sys- tems in both phases are calculated. From Table 1, the theoretically obtained equilibrium lattice constants are underestimated compared to the experimental values [8], (a) (b) Figure 1. (a) Austenite (B2) lattice structure and (b) mart- ensite (B19/B19’) lattice structure. Table 1. Experimental and Theoretical lattice constants (a, b, c) in Å of Ti X (X = Fe, Ni, Pd, Pt, Cu) alloys. a b c Theoretical Experimental Alloy Type Present work a b c a b c B2 2.9156 2.987[a] 2.976[a] TiFe B19 2.7581 4.4204 3.934 TiNi B2 2.9714 3.023[a] 3.015[a] B19 2.512 4.028 3.582 2.859[b] 4.582[b] 4.078[b] B19’ 2.8801 4.5792 4.0321 2.898[c] 4.108[c] 4.646[c] TiPd B2 3.1263 3.191[a] 3.18[a] B19 2.7030 4.6010 4.3780 2.79[b] 4.81[b] 4.52[b] 2.81 4.89 4.52 TiP B2 3.1374 3.205[a] 3.192[a] B19 2.6464 4.5476 4.2843 2.81[b] 4.83[b] 4.55[b] 2.76[a] 4.84 4.59 TiCu B2 3.0275 3.07[a] B19 2.8966 4.6427 4.1320 [a]Reference [9]; [b]Reference [10]; [c]Reference [11]. Copyright © 2011 SciRes. MSA  Theoretical Investigations of Ti-Based Binary Shape Memory Alloys1357 Figure 2. Total energy as a function of volume for TiX (X = Fe, Ni, Pd, Pt and Cu) alloys Continuous line indicate B2 struc- ture and line with points indicate B19’/B19 structure. and this is partly ascribed to the local density approxima- tion (LDA) used in the calculations. To minimize the deviations, it is argued that the zero point vibrations have to be included in the calculation [12]. The total energy curves of TiX (X = Fe, Ni, Pd Pt and Cu) alloys in B2 and (B19/B19’) phases, as seen in Fig- ure 2 show that these alloys are stable in B2 structure [13] though the energy difference between the two is very small of the order of 0.2502 Ry/F.u. 4. Band Structure and Density of State Studies on TiX (X = Fe, Ni, Pd, Pt and Cu) Alloys The correlation of structural stability with electronic structure is performed using band structure calculations [14]. The band structures of TiX (X = Fe, Ni, Pd, Pt and Cu) alloys have the same generic nature in B2 and B19 structures respectively. They are plotted along high sym- metry lines; Figures 3(a) and 3( b) show the band struc- tures of TiX alloys in both phases for several symmetry directions in k-space. The (B19/B19’) structure of TiX alloys possesses lower symmetry leading to splitting of degenerate bands in the interior of brillouin zone as seen in Figure 3(b). The size of the brillouin zone is twice as big as B2 structure since it possesses four atoms per unit cell. Hence the band structure of (B19/B19’) phase has complicated brillouin zone compared to B2. The band structure of TiNi in B2 structure is shown in Figure 3(a). The s-orbitals of Ti and Ni sites around −8 eV are the lowest lying valence bands and do not con- tribute much in deciding the properties of these alloys. The top most valence band below EF between −4 eV and −2 eV are due to Ti-d states followed by Ni-d states. Be- low them, the contribution from Ni-p state predominates. The band dispersions of (B19/B19’) phase have simi- lar generic nature as B2 at more bound states as seen in Figure 3(b), yet there are significant differences that can be detected at higher energies near the Fermi level EF. This is reflected in the corresponding density of states (DOS) curve there by influencing various physical prop- erties such as susceptibilities and optical conductivities in both phases [15]. The widths of the valence band for all alloys are tabu- lated in Table 3. We observe the width of the band to be narrower for (B19/B19’) phase compared to B2. Hence the interactions between Ti and X (X = Fe, Ni, Pd, Pt and Cu) atoms are much stronger in (B19/B19’) phase com- pared to B2, which is also reflected in their correspond- ing DOS curves [15]. In both phases TiPt possess wider bandwidth com- pared to all other TiX (X = Fe, Ni, Pd and Cu) alloys. The higher localization of t atom towards the bound P Copyright © 2011 SciRes. MSA  Theoretical Investigations of Ti-Based Binary Shape Memory Alloys 1358 (a) (b) Figure 3. (a) Band structure of TiX (X = Fe, Ni, Pd, Pt and Cu) in B2 phase at V/Vo = 1; (b) Band structure of TiX (X = Fe, Ni, d, Pt and Cu) in B19 phase at V/Vo = 1. P Copyright © 2011 SciRes. MSA  Theoretical Investigations of Ti-Based Binary Shape Memory Alloys1359 state in comparison to other X (X = Fe, Ni, Pd, and Cu) atoms results in decrease in overlap of bands between Ti and Pt. This weakens the interaction between the two, and consequently the strength of the covalent bonding between them is decreased. Density of States To study the phase stability at microscopic level, the DOS are calculated for the TiX (X = Fe, Ni, Pd, and Cu) alloys at their equilibrium volumes and are plotted using linear tetrahedron method. In present study, the double peak structure is the most typical two peak structure of the total DOS curve which is shown in Figures 4(a) and 4(b). The DOS curves for B19/B19’ structures are similar in nature to that of the B2. Due to lower symmetry the DOS peaks of the B19 and B19’ structures tend to be broader than B2. There are some changes noticed in the lower portion of the DOS curves of B19/B19’ structure at a range of ±1.5 eV around Fermi. From Figures 4(a) and 4(b) we observe the dividing dip of the DOS in B2 structure at about −1.5 eV around Fermi becomes less conspicuous in B19 structures. In B19’ structure, near the Fermi level within a range of ±1.5 eV there is an upward shift of the dip of the DOS curve. The DOS curve of TiFe alloy in both phases is found to be in good agreement with the reported results of Y. Ye et al. The typical feature of the total DOS curve of TiFe in B2 phase is the presence of pseudo gap. Two mechanisms were proposed for the formation of pseudo gap in the binary alloys [16]. One is of ionic origin, and other is owing to hybridization effects. As the electro negativity difference between Ti and X is low, the ionic- ity does not play a major role on bonding behavior of these compounds. Consequently the pseudo gap present in TiFe alloys is believed to be due to covalent hybridi- zation between Ti and Fe atoms. Such a strong hybridi- zation gives not only an important mixing between the states of conduction bands but also leads to a separation of bonding states creating a pseudo gap. In the present work we observe that in B2 structure the shape of the DOS curve of TiNi is similar to TiFe. For both alloys the EF falls on a dip as shown in Figure 4(a). It is well known fact that if the Fermi level EF falls on the dip, the corresponding structure may be regarded as a save energy system as compared with one whose Fermi level EF does not fall on a dip. Therefore TiFe and TiNi alloys are more stable than other transition metals Pd, Pt and noble metal Cu. On going from TiPd, TiPt and TiCu the B2 structure becomes relatively less stable, as the Fermi level EF shifts from the dip towards higher peaks of the DOS [17]. This is accounted by the increase in valence electrons which will tend to shift the Fermi level EF from the dip towards the anti-bonding states. From Figure 4(b) similar dip is observed for TiPd, wherein the Fermi level EF falls on the dip. Hence TiNi and TiFe in B2 structure and TiFe and TiPd in B19 structure have low N (EF) values at Fermi and are considered to be most stable structures. However the stability of TiPd in B19 contradicts the inference for the total energy calculations shown in Figure 2. As the energy of TiPd at Fermi is lower for B2 (−0.0523 eV) when compared to B19 (0.0271 eV) structure, TiPd can be considered to be sta- ble in B2 structure. This is in line with the results re- ported by Ravindran et al. [17] in the case of Ni3Al and Ni3Al0.75Nb0.25. As the electrons around EF play an important role in deciding the electronic, structural and mechanical prop- erties of the alloys, we carry out the investigations on the electronic structure histogram using the projected DOS of TiX alloys. General nature of the DOS histograms of all TiX (X = Fe, Ni, Pd, Pt and Cu) alloys are observed to be similar of which the DOS histogram of TiNi alloy is shown in Figure 4(c). consists of three parts 1) the peak present in the lower energy part of the DOS curve is mainly due to the localized or tightly bound s-electrons of Ni and Ti atoms; 2) the bonding sates of Ti-d and Ni-p orbitals are near (to the left of) the Fermi level EF; 3) the DOS curve due to anti-bonding states. It is found that Ti-s state and Ni-s-state electrons in TiX alloy are local- ized and its effect in bonding is very small. Thus the electrons from Ti-d and Ni-d, Ni-p states predominately contribute to the density of states at the Fermi level EF. In order to explore the role of X (X = Fe, Ni, Pd, Pt and Cu) atoms in the Ti-based alloys we compare the d-partial DOS curves of these alloys as shown in Figures 4(d) and 4(e). We observe that the d-states of Ti atom at Fermi shows a dominance compared to X (X = Ni, Pd, Pt, Cu) atoms. The XPS studies by Shabaloskaya et al. [18] show that as elemental X atoms combine with Ti atom to form TiX (X = Ni, Pd, Pt, Cu) compound, it results in enhancement of localization of d-electron of X atoms towards bound state. Hence the intensity of the d-band of X atom in TiX (X = Ni, Pd, Pt, Cu) alloys considerably decreases at Fermi and that of Ti atom increases. How- ever in case of TiFe alloy, we observe the d-states of Fe atom to dominate that of Ti at Fermi. This is because as elemental Fe forms TiFe compound on combination with Ti atom, the position of d-band peaks of Fe atom does not change [19], (i.e.) (the Fe atom does not undergo much localization as other X (X = Ni, Pd, Pt, Cu) atoms). Thus the d-band of Fe atom shows much dominance at Fermi when compared to that of d-band of Ti. This is also well supported by the DOS values of TiX (X = Ni, Pd, Pt, Cu) alloys at EF which are tabulated in Table 2. From Table 2 in both B2 and B19 structure, we Copyright © 2011 SciRes. MSA 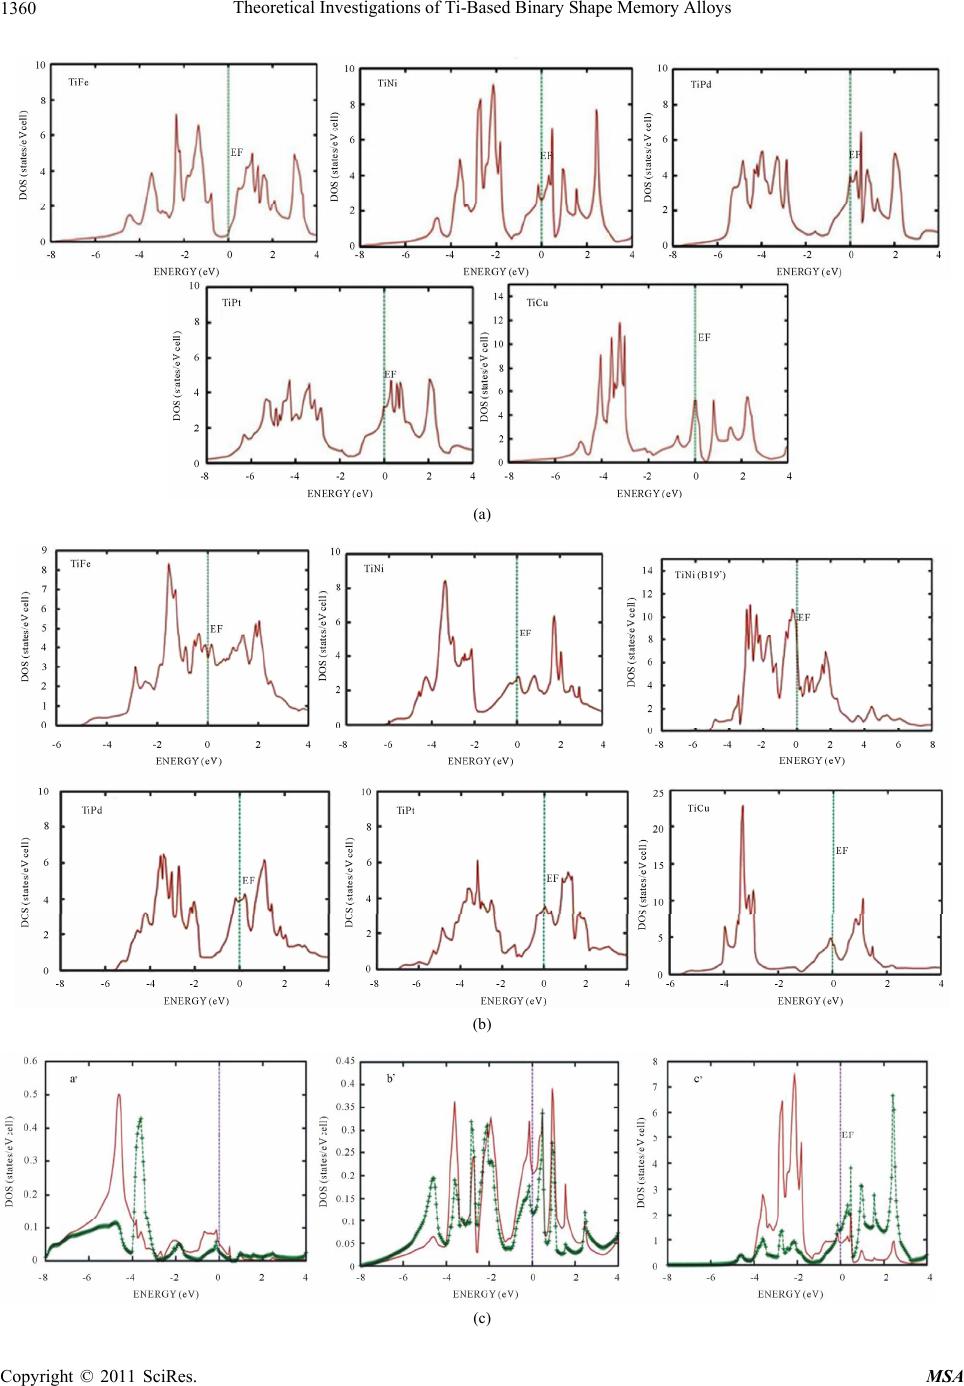 Theoretical Investigations of Ti-Based Binary Shape Memory Alloys 1360 (a) (b) (c) Copyright © 2011 SciRes. MSA 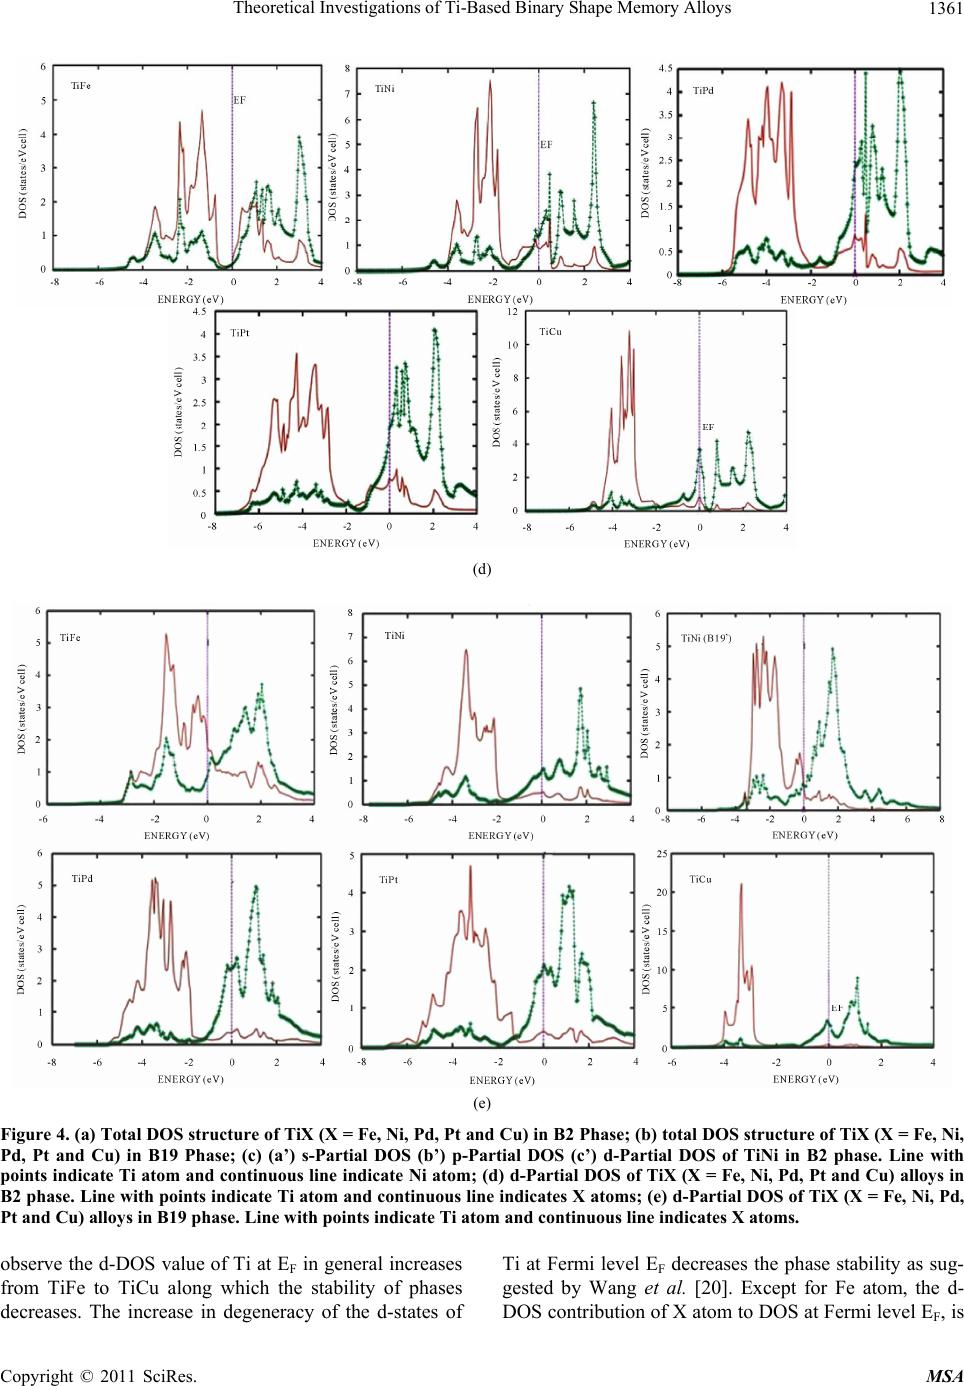 Theoretical Investigations of Ti-Based Binary Shape Memory Alloys1361 (d) (e) Figure 4. (a) Total DOS structure of TiX (X = Fe, Ni, Pd, Pt and Cu) in B2 Phase; (b) total DOS structure of TiX (X = Fe, Ni, Pd, Pt and Cu) in B19 Phase; (c) (a’) s-Partial DOS (b’) p-Partial DOS (c’) d-Partial DOS of TiNi in B2 phase. Line with points indicate Ti atom and continuous line indicate Ni atom; (d) d-Partial DOS of TiX (X = Fe, Ni, Pd, Pt and Cu) alloys in B2 phase. Line with points indicate Ti atom and continuous line indicates X atoms; (e) d-Partial DOS of TiX (X = Fe, Ni, Pd, Pt and Cu) alloys in B19 phase. Line with points indicate Ti atom and continuous line indicates X atoms. observe the d-DOS value of Ti at EF in general increases from TiFe to TiCu along which the stability of phases decreases. The increase in degeneracy of the d-states of Ti at Fermi level EF decreases the phase stability as sug- gested by Wang et al. [20]. Except for Fe atom, the d- DOS contribution of X atomto DOS at Fermi level EF, is Copyright © 2011 SciRes. MSA 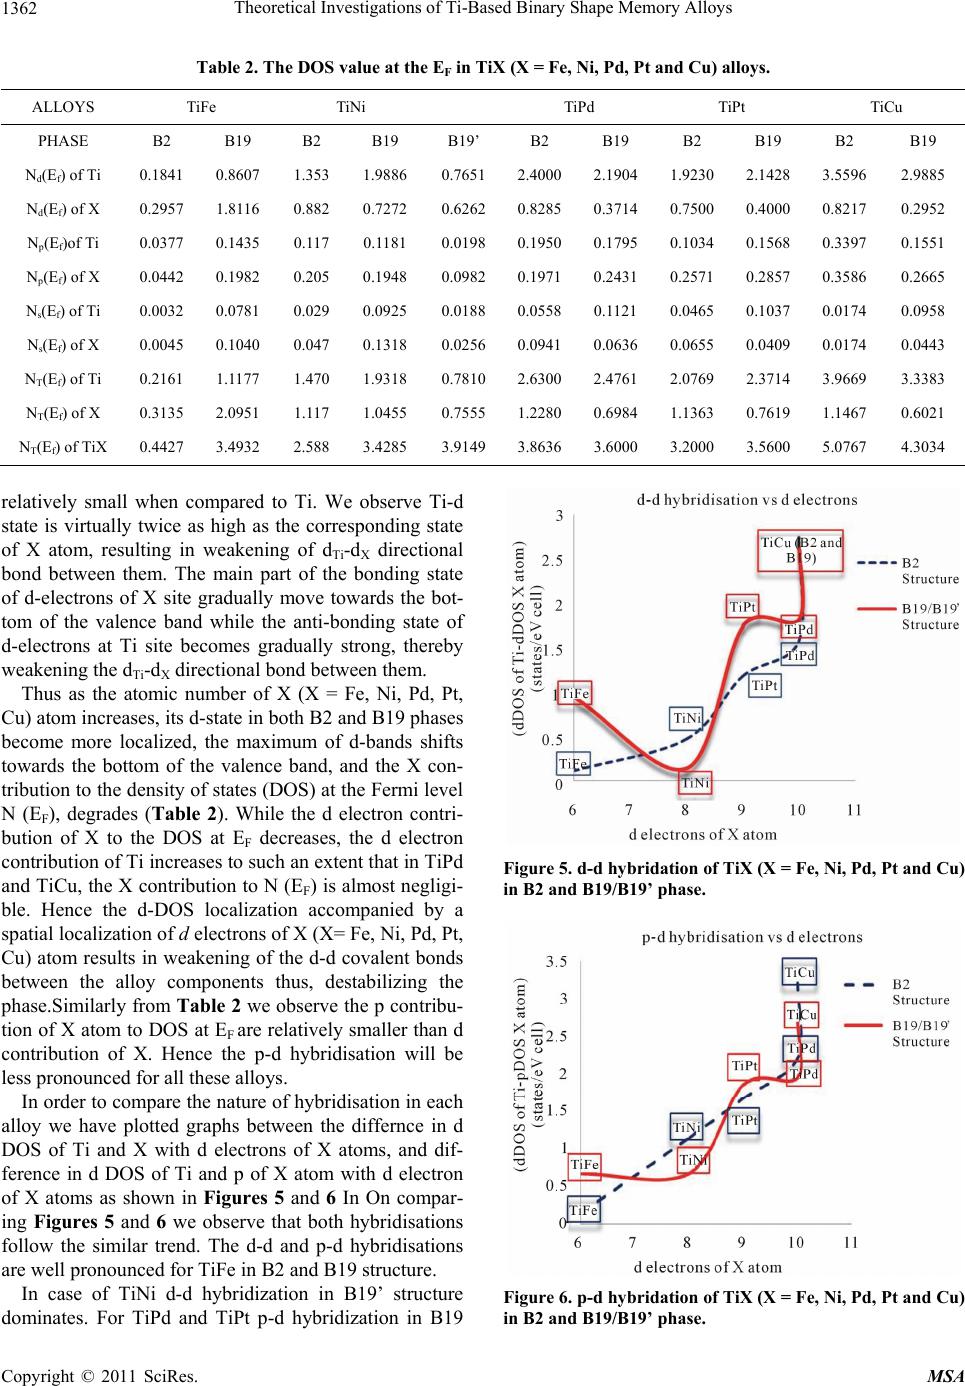 Theoretical Investigations of Ti-Based Binary Shape Memory Alloys 1362 Table 2. The DOS value at the EF in TiX (X = Fe, Ni, Pd, Pt and Cu) alloys. ALLOYS TiFe TiNi TiPd TiPt TiCu PHASE B2 B19 B2 B19 B19’ B2 B19 B2 B19 B2 B19 Nd(Ef) of Ti 0.1841 0.8607 1.353 1.9886 0.7651 2.40002.1904 1.92302.1428 3.5596 2.9885 Nd(Ef) of X 0.2957 1.8116 0.882 0.7272 0.6262 0.82850.3714 0.75000.4000 0.8217 0.2952 Np(Ef)of Ti 0.0377 0.1435 0.117 0.1181 0.0198 0.1950 0.1795 0.1034 0.1568 0.3397 0.1551 Np(Ef) of X 0.0442 0.1982 0.205 0.1948 0.0982 0.19710.2431 0.25710.2857 0.3586 0.2665 Ns(Ef) of Ti 0.0032 0.0781 0.029 0.0925 0.0188 0.05580.1121 0.04650.1037 0.0174 0.0958 Ns(Ef) of X 0.0045 0.1040 0.047 0.1318 0.0256 0.09410.0636 0.06550.0409 0.0174 0.0443 NT(Ef) of Ti 0.2161 1.1177 1.470 1.9318 0.7810 2.63002.4761 2.07692.3714 3.9669 3.3383 NT(Ef) of X 0.3135 2.0951 1.117 1.0455 0.7555 1.22800.6984 1.13630.7619 1.1467 0.6021 NT(Ef) of TiX 0.4427 3.4932 2.588 3.4285 3.9149 3.86363.6000 3.20003.5600 5.0767 4.3034 relatively small when compared to Ti. We observe Ti-d state is virtually twice as high as the corresponding state of X atom, resulting in weakening of dTi-d X directional bond between them. The main part of the bonding state of d-electrons of X site gradually move towards the bot- tom of the valence band while the anti-bonding state of d-electrons at Ti site becomes gradually strong, thereby weakening the dTi-dX directional bond between them. Thus as the atomic number of X (X = Fe, Ni, Pd, Pt, Cu) atom increases, its d-state in both B2 and B19 phases become more localized, the maximum of d-bands shifts towards the bottom of the valence band, and the X con- tribution to the density of states (DOS) at the Fermi level N (EF), degrades (Table 2). While the d electron contri- bution of X to the DOS at EF decreases, the d electron contribution of Ti increases to such an extent that in TiPd and TiCu, the X contribution to N (EF) is almost negligi- ble. Hence the d-DOS localization accompanied by a spatial localization of d electrons of X (X= Fe, Ni, Pd, Pt, Cu) atom results in weakening of the d-d covalent bonds between the alloy components thus, destabilizing the phase.Similarly from Table 2 we observe the p contribu- tion of X atom to DOS at EF are relatively smaller than d contribution of X. Hence the p-d hybridisation will be less pronounced for all these alloys. In order to compare the nature of hybridisation in each alloy we have plotted graphs between the differnce in d DOS of Ti and X with d electrons of X atoms, and dif- ference in d DOS of Ti and p of X atom with d electron of X atoms as shown in Figures 5 and 6 In On compar- ing Figures 5 and 6 we observe that both hybridisations follow the similar trend. The d-d and p-d hybridisations are well pronounced for TiFe in B2 and B19 structure. In case of TiNi d-d hybridization in B19’ structure dominates. For TiPd and TiPt p-d hybridization in B19 Figure 5. d-d hybridation of TiX (X = Fe, Ni, Pd, Pt and Cu) in B2 and B19/B19’ phase. Figure 6. p-d hybridation of TiX (X = Fe, Ni, Pd, Pt and Cu) in B2 and B19/B19’ phase. Copyright © 2011 SciRes. MSA 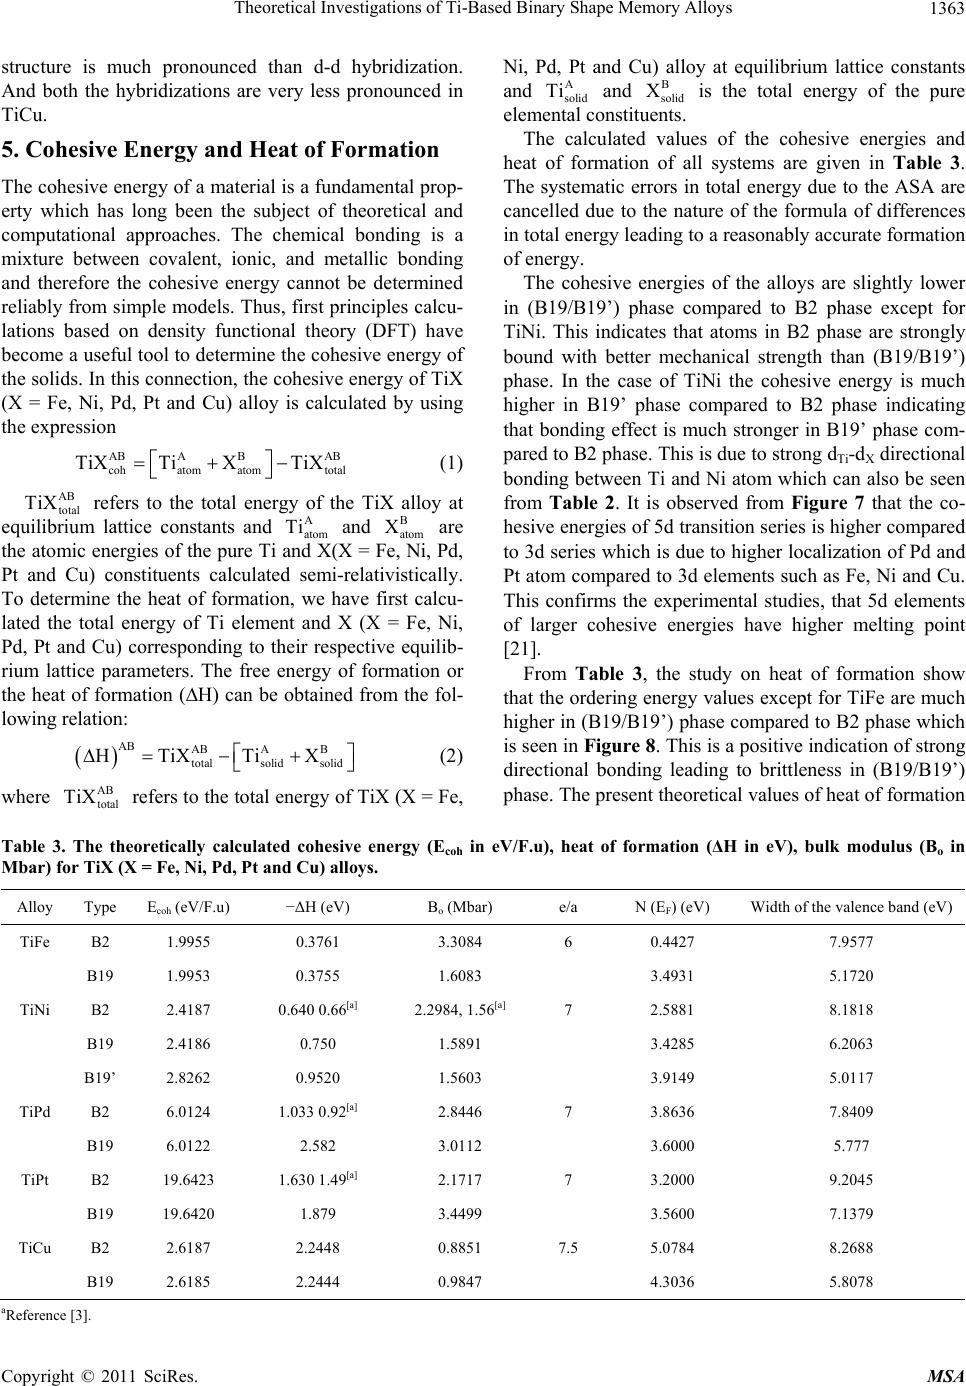 Theoretical Investigations of Ti-Based Binary Shape Memory Alloys1363 structure is much pronounced than d-d hybridization. And both the hybridizations are very less pronounced in TiCu. 5. Cohesive Energy and Heat of Formation The cohesive energy of a material is a fundamental prop- erty which has long been the subject of theoretical and computational approaches. The chemical bonding is a mixture between covalent, ionic, and metallic bonding and therefore the cohesive energy cannot be determined reliably from simple models. Thus, first principles calcu- lations based on density functional theory (DFT) have become a useful tool to determine the cohesive energy of the solids. In this connection, the cohesive energy of TiX (X = Fe, Ni, Pd, Pt and Cu) alloy is calculated by using the expression AB A BAB cohatom atomtotal TiXTiXTiX (1) AB total TiX refers to the total energy of the TiX alloy at equilibrium lattice constants and and are the atomic energies of the pure Ti and X(X = Fe, Ni, Pd, Pt and Cu) constituents calculated semi-relativistically. To determine the heat of formation, we have first calcu- lated the total energy of Ti element and X (X = Fe, Ni, Pd, Pt and Cu) corresponding to their respective equilib- rium lattice parameters. The free energy of formation or the heat of formation (∆H) can be obtained from the fol- lowing relation: A atom Ti B atom X AB ABAB totalsolidsolid HTiX TiX (2) where refers to the total energy of TiX (X = Fe, AB total TiX Ni, Pd, Pt and Cu) alloy at equilibrium lattice constants and and is the total energy of the pure elemental constituents. A solid Ti B solid X The calculated values of the cohesive energies and heat of formation of all systems are given in Table 3. The systematic errors in total energy due to the ASA are cancelled due to the nature of the formula of differences in total energy leading to a reasonably accurate formation of energy. The cohesive energies of the alloys are slightly lower in (B19/B19’) phase compared to B2 phase except for TiNi. This indicates that atoms in B2 phase are strongly bound with better mechanical strength than (B19/B19’) phase. In the case of TiNi the cohesive energy is much higher in B19’ phase compared to B2 phase indicating that bonding effect is much stronger in B19’ phase com- pared to B2 phase. This is due to strong dTi-dX directional bonding between Ti and Ni atom which can also be seen from Table 2. It is observed from Figure 7 that the co- hesive energies of 5d transition series is higher compared to 3d series which is due to higher localization of Pd and Pt atom compared to 3d elements such as Fe, Ni and Cu. This confirms the experimental studies, that 5d elements of larger cohesive energies have higher melting point [21]. From Table 3, the study on heat of formation show that the ordering energy values except for TiFe are much higher in (B19/B19’) phase compared to B2 phase which is seen in Figure 8. This is a positive indication of strong directional bonding leading to brittleness in (B19/B19’) phase. The present theoretical values of heat of formation Table 3. The theoretically calculated cohesive energy (Ecoh in eV/F.u), heat of formation (ΔH in eV), bulk modulus (Bo in Mbar) for TiX (X = Fe, Ni, Pd, Pt and Cu) alloys. Alloy Type Ecoh (eV/F.u) −ΔH (eV) Bo (Mbar) e/a N (EF) (eV) Width of the valence band (eV) TiFe B2 1.9955 0.3761 3.3084 6 0.4427 7.9577 B19 1.9953 0.3755 1.6083 3.4931 5.1720 TiNi B2 2.4187 0.640 0.66[a] 2.2984, 1.56[a] 7 2.5881 8.1818 B19 2.4186 0.750 1.5891 3.4285 6.2063 B19’ 2.8262 0.9520 1.5603 3.9149 5.0117 TiPd B2 6.0124 1.033 0.92[a] 2.8446 7 3.8636 7.8409 B19 6.0122 2.582 3.0112 3.6000 5.777 TiPt B2 19.6423 1.630 1.49[a] 2.1717 7 3.2000 9.2045 B19 19.6420 1.879 3.4499 3.5600 7.1379 TiCu B2 2.6187 2.2448 0.8851 7.5 5.0784 8.2688 B19 2.6185 2.2444 0.9847 4.3036 5.8078 aR eference [3]. Copyright © 2011 SciRes. MSA 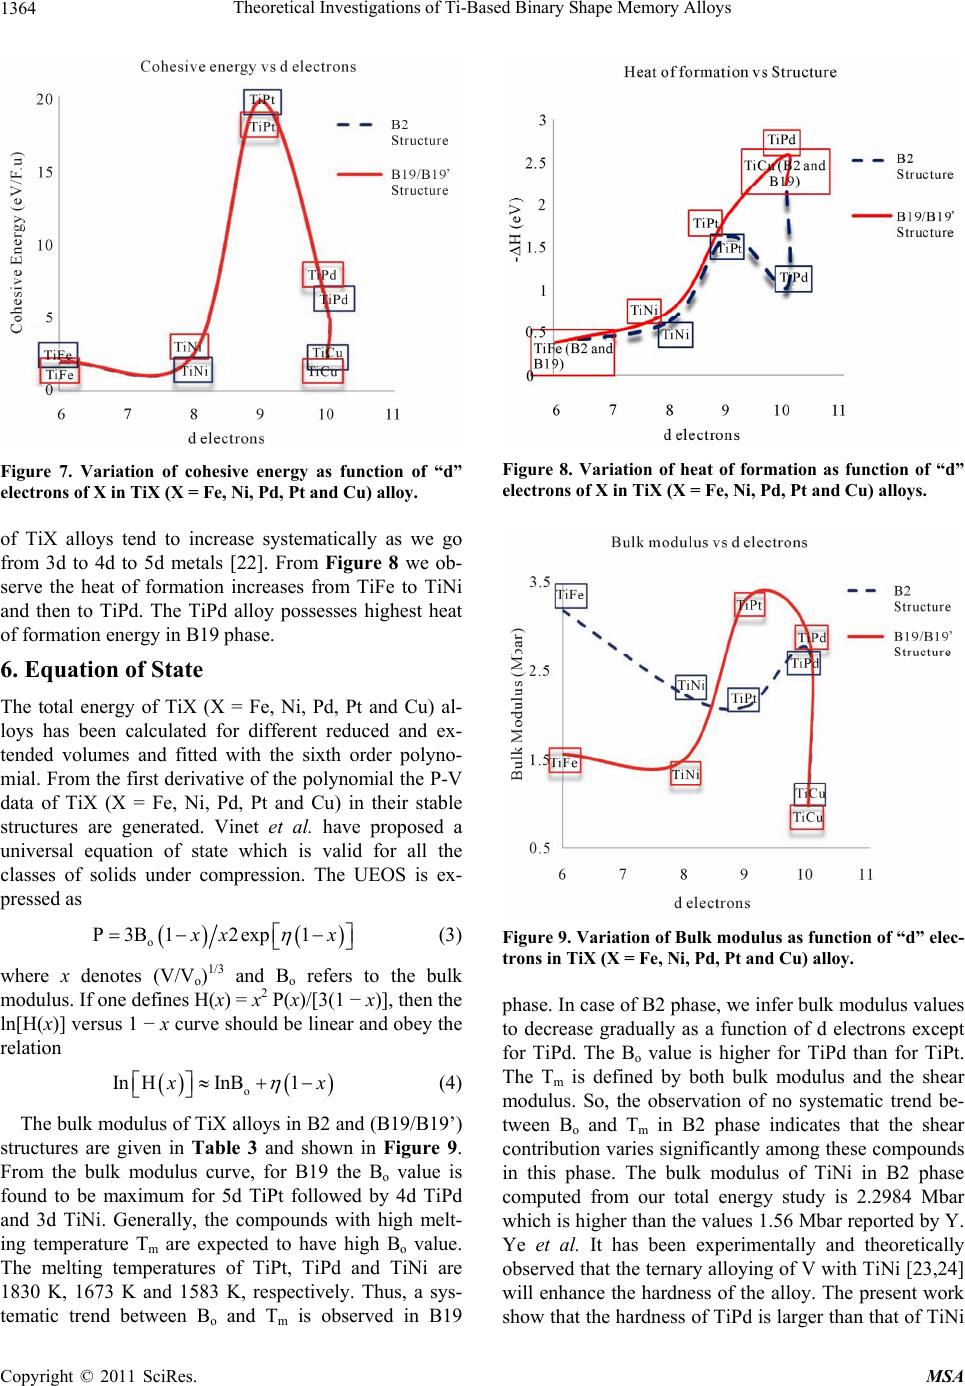 Theoretical Investigations of Ti-Based Binary Shape Memory Alloys 1364 Figure 7. Variation of cohesive energy as function of “d” electrons of X in TiX (X = Fe, Ni, Pd, Pt and Cu) alloy. of TiX alloys tend to increase systematically as we go from 3d to 4d to 5d metals [22]. From Figure 8 we ob- serve the heat of formation increases from TiFe to TiNi and then to TiPd. The TiPd alloy possesses highest heat of formation energy in B19 phase. 6. Equation of State The total energy of TiX (X = Fe, Ni, Pd, Pt and Cu) al- loys has been calculated for different reduced and ex- tended volumes and fitted with the sixth order polyno- mial. From the first derivative of the polynomial the P-V data of TiX (X = Fe, Ni, Pd, Pt and Cu) in their stable structures are generated. Vinet et al. have proposed a universal equation of state which is valid for all the classes of solids under compression. The UEOS is ex- pressed as o P3B12exp 1 x x (3) where x denotes (V/Vo)1/3 and Bo refers to the bulk modulus. If one defines H(x) = x2 P(x)/[3(1 − x)], then the ln[H(x)] versus 1 − x curve should be linear and obey the relation o In HInB1 x (4) The bulk modulus of TiX alloys in B2 and (B19/B19’) structures are given in Table 3 and shown in Figure 9. From the bulk modulus curve, for B19 the Bo value is found to be maximum for 5d TiPt followed by 4d TiPd and 3d TiNi. Generally, the compounds with high melt- ing temperature Tm are expected to have high Bo value. The melting temperatures of TiPt, TiPd and TiNi are 1830 K, 1673 K and 1583 K, respectively. Thus, a sys- tematic trend between Bo and Tm is observed in B19 Figure 8. Variation of heat of formation as function of “d” electrons of X in TiX (X = Fe, Ni, Pd, Pt and Cu) alloys. Figure 9. Variation of Bulk modulus as function of “d” elec- trons in TiX (X = Fe, Ni, Pd, Pt and Cu) alloy. phase. In case of B2 phase, we infer bulk modulus values to decrease gradually as a function of d electrons except for TiPd. The Bo value is higher for TiPd than for TiPt. The Tm is defined by both bulk modulus and the shear modulus. So, the observation of no systematic trend be- tween Bo and Tm in B2 phase indicates that the shear contribution varies significantly among these compounds in this phase. The bulk modulus of TiNi in B2 phase computed from our total energy study is 2.2984 Mbar which is higher than the values 1.56 Mbar reported by Y. Ye et al. It has been experimentally and theoretically observed that the ternary alloying of V with TiNi [23,24] will enhance the hardness of the alloy. The present work show that the hardness of TiPd is larger than that of TiNi Copyright © 2011 SciRes. MSA 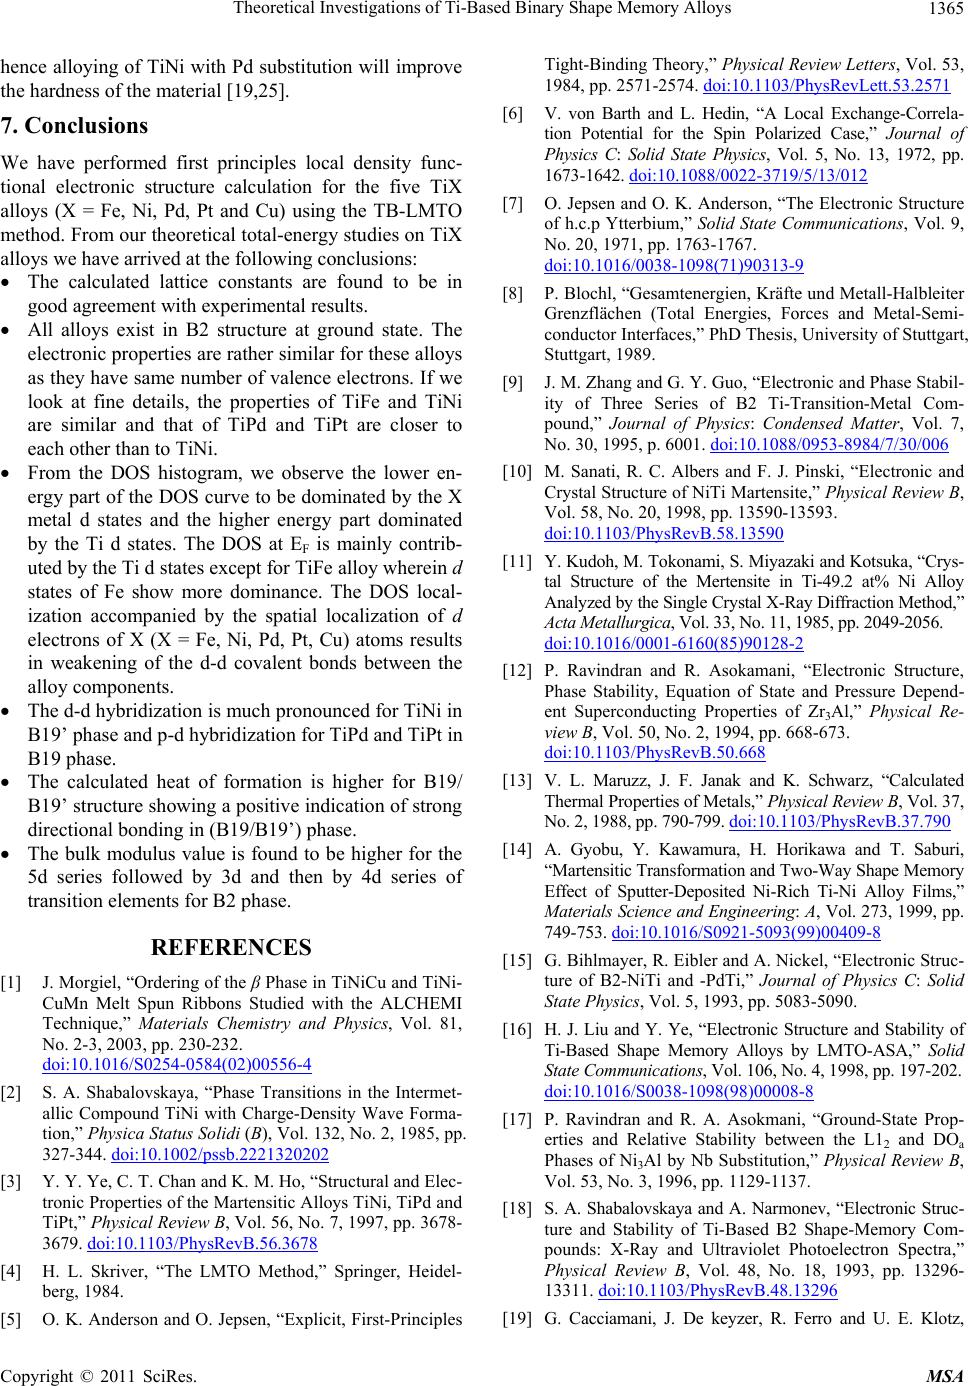 Theoretical Investigations of Ti-Based Binary Shape Memory Alloys1365 hence alloying of TiNi with Pd substitution will improve the hardness of the material [19,25]. 7. Conclusions We have performed first principles local density func- tional electronic structure calculation for the five TiX alloys (X = Fe, Ni, Pd, Pt and Cu) using the TB-LMTO method. From our theoretical total-energy studies on TiX alloys we have arrived at the following conclusions: The calculated lattice constants are found to be in good agreement with experimental results. All alloys exist in B2 structure at ground state. The electronic properties are rather similar for these alloys as they have same number of valence electrons. If we look at fine details, the properties of TiFe and TiNi are similar and that of TiPd and TiPt are closer to each other than to TiNi. From the DOS histogram, we observe the lower en- ergy part of the DOS curve to be dominated by the X metal d states and the higher energy part dominated by the Ti d states. The DOS at EF is mainly contrib- uted by the Ti d states except for TiFe alloy wherein d states of Fe show more dominance. The DOS local- ization accompanied by the spatial localization of d electrons of X (X = Fe, Ni, Pd, Pt, Cu) atoms results in weakening of the d-d covalent bonds between the alloy components. The d-d hybridization is much pronounced for TiNi in B19’ phase and p-d hybridization for TiPd and TiPt in B19 phase. The calculated heat of formation is higher for B19/ B19’ structure showing a positive indication of strong directional bonding in (B19/B19’) phase. The bulk modulus value is found to be higher for the 5d series followed by 3d and then by 4d series of transition elements for B2 phase. REFERENCES [1] J. Morgiel, “Ordering of the β Phase in TiNiCu and TiNi- CuMn Melt Spun Ribbons Studied with the ALCHEMI Technique,” Materials Chemistry and Physics, Vol. 81, No. 2-3, 2003, pp. 230-232. doi:10.1016/S0254-0584(02)00556-4 [2] S. A. Shabalovskaya, “Phase Transitions in the Intermet- allic Compound TiNi with Charge-Density Wave Forma- tion,” Physica Status Solidi (B), Vol. 132, No. 2, 1985, pp. 327-344. doi:10.1002/pssb.2221320202 [3] Y. Y. Ye, C. T. Chan and K. M. Ho, “Structural and Elec- tronic Properties of the Martensitic Alloys TiNi, TiPd and TiPt,” Physical Review B, Vol. 56, No. 7, 1997, pp. 3678- 3679. doi:10.1103/PhysRevB.56.3678 [4] H. L. Skriver, “The LMTO Method,” Springer, Heidel- berg, 1984. [5] O. K. Anderson and O. Jepsen, “Explicit, First-Principles Tight-Binding Theory,” Physical Review Letters, Vol. 53, 1984, pp. 2571-2574. doi:10.1103/PhysRevLett.53.2571 [6] V. von Barth and L. Hedin, “A Local Exchange-Correla- tion Potential for the Spin Polarized Case,” Journal of Physics C: Solid State Physics, Vol. 5, No. 13, 1972, pp. 1673-1642. doi:10.1088/0022-3719/5/13/012 [7] O. Jepsen and O. K. Anderson, “The Electronic Structure of h.c.p Ytterbium,” Solid State Communications, Vol. 9, No. 20, 1971, pp. 1763-1767. doi:10.1016/0038-1098(71)90313-9 [8] P. Blochl, “Gesamtenergien, Kräfte und Metall-Halbleiter Grenzflächen (Total Energies, Forces and Metal-Semi- conductor Interfaces,” PhD Thesis, University of Stuttgart, Stuttgart, 1989. [9] J. M. Zhang and G. Y. Guo, “Electronic and Phase Stabil- ity of Three Series of B2 Ti-Transition-Metal Com- pound,” Journal of Physics: Condensed Matter, Vol. 7, No. 30, 1995, p. 6001. doi:10.1088/0953-8984/7/30/006 [10] M. Sanati, R. C. Albers and F. J. Pinski, “Electronic and Crystal Structure of NiTi Martensite,” Physical Review B, Vol. 58, No. 20, 1998, pp. 13590-13593. doi:10.1103/PhysRevB.58.13590 [11] Y. Kudoh, M. Tokonami, S. Miyazaki and Kotsuka, “Crys- tal Structure of the Mertensite in Ti-49.2 at% Ni Alloy Analyzed by the Single Crystal X-Ray Diffraction Method,” Acta Metallurgica, Vol. 33, No. 11, 1985, pp. 2049-2056. doi:10.1016/0001-6160(85)90128-2 [12] P. Ravindran and R. Asokamani, “Electronic Structure, Phase Stability, Equation of State and Pressure Depend- ent Superconducting Properties of Zr3Al,” Physical Re- view B, Vol. 50, No. 2, 1994, pp. 668-673. doi:10.1103/PhysRevB.50.668 [13] V. L. Maruzz, J. F. Janak and K. Schwarz, “Calculated Thermal Properties of Metals,” Physical Review B, Vol. 37, No. 2, 1988, pp. 790-799. doi:10.1103/Phy sRevB.37.790 [14] A. Gyobu, Y. Kawamura, H. Horikawa and T. Saburi, “Martensitic Transformation and Two-Way Shape Memory Effect of Sputter-Deposited Ni-Rich Ti-Ni Alloy Films,” Materials Science and Engineering: A, Vol. 273, 1999, pp. 749-753. doi:10.1016/S0921-5093(99)00409-8 [15] G. Bihlmayer, R. Eibler and A. Nickel, “Electronic Struc- ture of B2-NiTi and -PdTi,” Journal of Physics C: Solid State Physics, Vol. 5, 1993, pp. 5083-5090. [16] H. J. Liu and Y. Ye, “Electronic Structure and Stability of Ti-Based Shape Memory Alloys by LMTO-ASA,” Solid State Communications, Vol. 106, No. 4, 1998, pp. 197-202. doi:10.1016/S0038-1098(98)00008-8 [17] P. Ravindran and R. A. Asokmani, “Ground-State Prop- erties and Relative Stability between the L12 and DOa Phases of Ni3Al by Nb Substitution,” Physical Review B, Vol. 53, No. 3, 1996, pp. 1129-1137. [18] S. A. Shabalovskaya and A. Narmonev, “Electronic Struc- ture and Stability of Ti-Based B2 Shape-Memory Com- pounds: X-Ray and Ultraviolet Photoelectron Spectra,” Physical Review B, Vol. 48, No. 18, 1993, pp. 13296- 13311. doi:10.1103/PhysRevB.48.13296 [19] G. Cacciamani, J. De keyzer, R. Ferro and U. E. Klotz, Copyright © 2011 SciRes. MSA 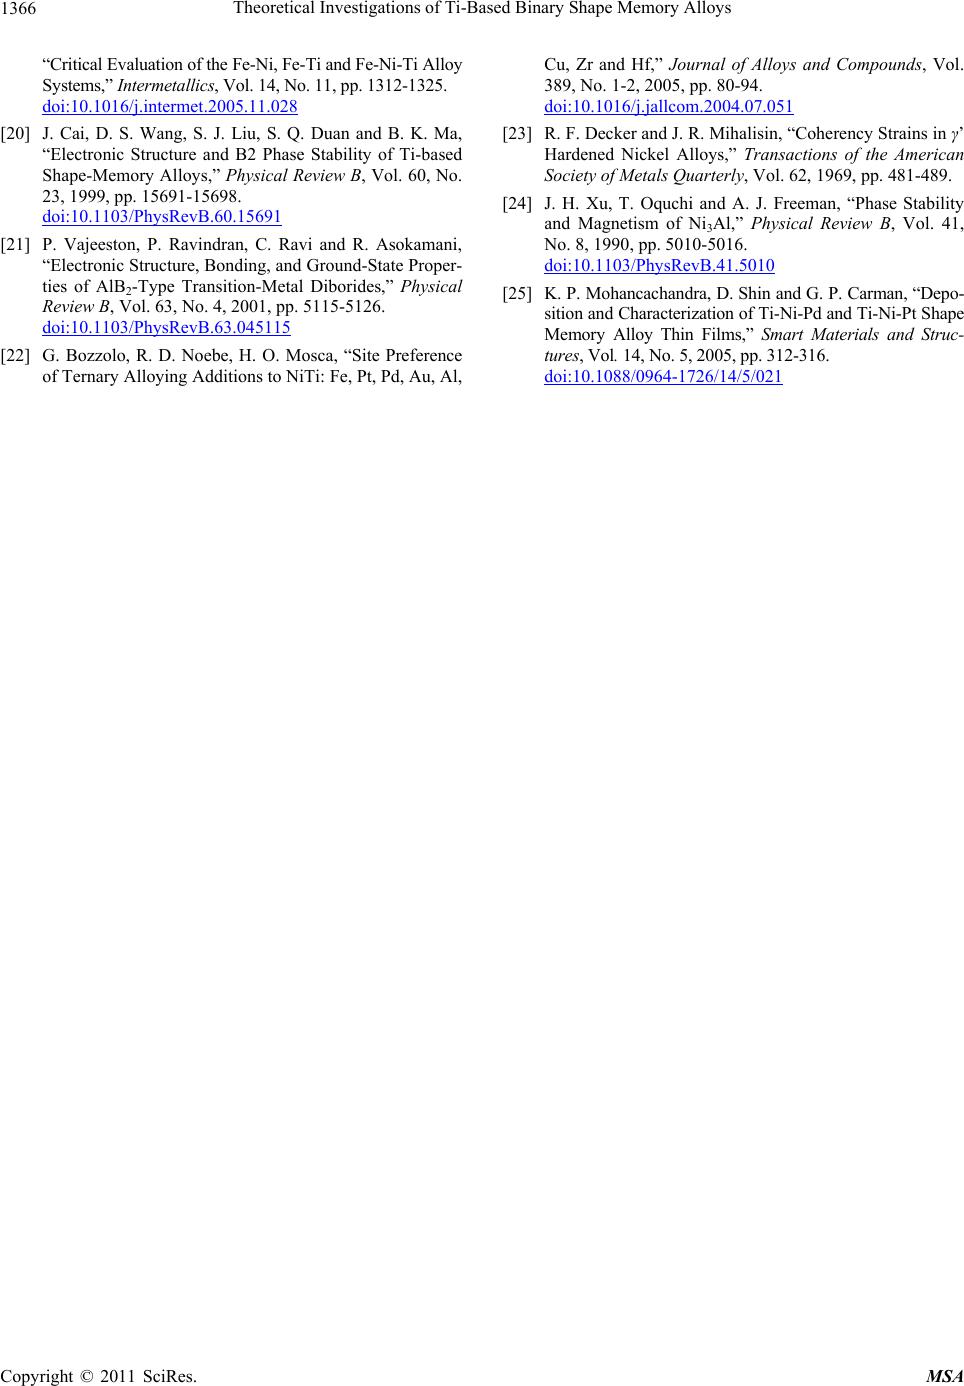 Theoretical Investigations of Ti-Based Binary Shape Memory Alloys Copyright © 2011 SciRes. MSA 1366 “Critical Evaluation of the Fe-Ni, Fe-Ti and Fe-Ni-Ti Alloy Systems,” Intermetallics, Vol. 14, No. 11, pp. 1312-1325. doi:10.1016/j.intermet.2005.11.028 [20] J. Cai, D. S. Wang, S. J. Liu, S. Q. Duan and B. K. Ma, “Electronic Structure and B2 Phase Stability of Ti-based Shape-Memory Alloys,” Physical Review B, Vol. 60, No. 23, 1999, pp. 15691-15698. doi:10.1103/PhysRevB.60.15691 [21] P. Vajeeston, P. Ravindran, C. Ravi and R. Asokamani, “Electronic Structure, Bonding, and Ground-State Proper- ties of AlB2-Type Transition-Metal Diborides,” Physical Review B, Vol. 63, No. 4, 2001, pp. 5115-5126. doi:10.1103/PhysRevB.63.045115 [22] G. Bozzolo, R. D. Noebe, H. O. Mosca, “Site Preference of Ternary Alloying Additions to NiTi: Fe, Pt, Pd, Au, Al, Cu, Zr and Hf,” Journal of Alloys and Compounds, Vol. 389, No. 1-2, 2005, pp. 80-94. doi:10.1016/j.jallcom.2004.07.051 [23] R. F. Decker and J. R. Mihalisin, “Coherency Strains in γ’ Hardened Nickel Alloys,” Transactions of the American Society of Metals Quarterly, Vol. 62, 1969, pp. 481-489. [24] J. H. Xu, T. Oquchi and A. J. Freeman, “Phase Stability and Magnetism of Ni3Al,” Physical Review B, Vol. 41, No. 8, 1990, pp. 5010-5016. doi:10.1103/PhysRevB.41.5010 [25] K. P. Mohancachandra, D. Shin and G. P. Carman, “Depo- sition and Characterization of Ti-Ni-Pd and Ti-Ni-Pt Shape Memory Alloy Thin Films,” Smart Materials and Struc- tures, Vol. 14, No. 5, 2005, pp. 312-316. doi:10.1088/0964-1726/14/5/021
|