Paper Menu >>
Journal Menu >>
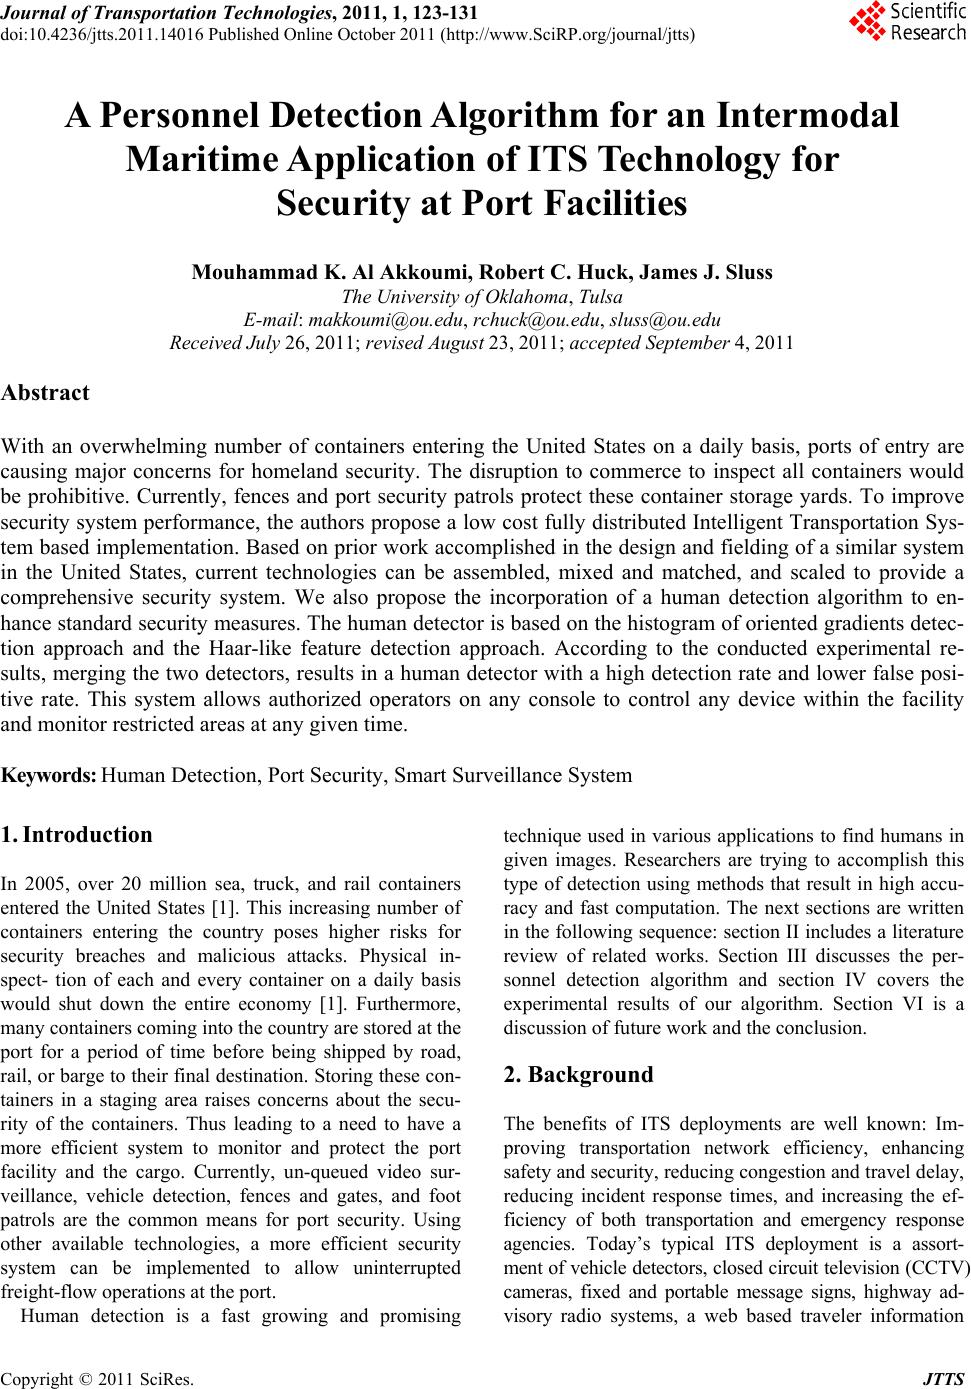 Journal of Transportation Technologies, 2011, 1, 123-131 doi:10.4236/jtts.2011.14016 Published Online October 2011 (http://www.SciRP.org/journal/jtts) Copyright © 2011 SciRes. JTTS A Personnel Detection Algorithm for an Intermodal Maritime Application of ITS Technology for Security at Port Facilities Mouhammad K. Al Akkoumi, Robert C. Huck, James J. Sluss The University of Oklahoma, Tulsa E-mail: makkoumi@ou.edu, rchuck@ou.edu, sluss@ou.edu Received July 26, 201 1; revised August 23, 2011; accepted September 4, 2011 Abstract With an overwhelming number of containers entering the United States on a daily basis, ports of entry are causing major concerns for homeland security. The disruption to commerce to inspect all containers would be prohibitive. Currently, fences and port security patrols protect these container storage yards. To improve security system performance, the authors propose a low cost fully distributed Intelligent Transportation Sys- tem based implementation. Based on prior work accomplished in the design and fielding of a similar system in the United States, current technologies can be assembled, mixed and matched, and scaled to provide a comprehensive security system. We also propose the incorporation of a human detection algorithm to en- hance standard security measures. The human detector is based on the histogram of oriented gradients detec- tion approach and the Haar-like feature detection approach. According to the conducted experimental re- sults, merging the two detectors, results in a human detector with a high detection rate and lower false posi- tive rate. This system allows authorized operators on any console to control any device within the facility and monitor restricted areas at any given time. Keywords: Human Detection, Port Security, Smart Surveillance System 1. Introduction In 2005, over 20 million sea, truck, and rail containers entered the United States [1]. This increasing number of containers entering the country poses higher risks for security breaches and malicious attacks. Physical in- spect- tion of each and every container on a daily basis would shut down the entire economy [1]. Furthermore, many containers coming into the country are stored at the port for a period of time before being shipped by road, rail, or barge to their final destination. Storing these con- tainers in a staging area raises concerns about the secu- rity of the containers. Thus leading to a need to have a more efficient system to monitor and protect the port facility and the cargo. Currently, un-queued video sur- veillance, vehicle detection, fences and gates, and foot patrols are the common means for port security. Using other available technologies, a more efficient security system can be implemented to allow uninterrupted freight-flow operations at the port. Human detection is a fast growing and promising technique used in various applications to find humans in given images. Researchers are trying to accomplish this type of detection using methods that result in high accu- racy and fast computation. The next sections are written in the following sequence: sectio n II includes a literature review of related works. Section III discusses the per- sonnel detection algorithm and section IV covers the experimental results of our algorithm. Section VI is a discussion of futu re wo rk and the conclusion. 2. Background The benefits of ITS deployments are well known: Im- proving transportation network efficiency, enhancing safety and security, reducing cong estion and travel delay, reducing incident response times, and increasing the ef- ficiency of both transportation and emergency response agencies. Today’s typical ITS deployment is a assort- ment of vehicle detectors, closed circuit television (CCTV) cameras, fixed and portable message signs, highway ad- visory radio systems, a web based traveler information 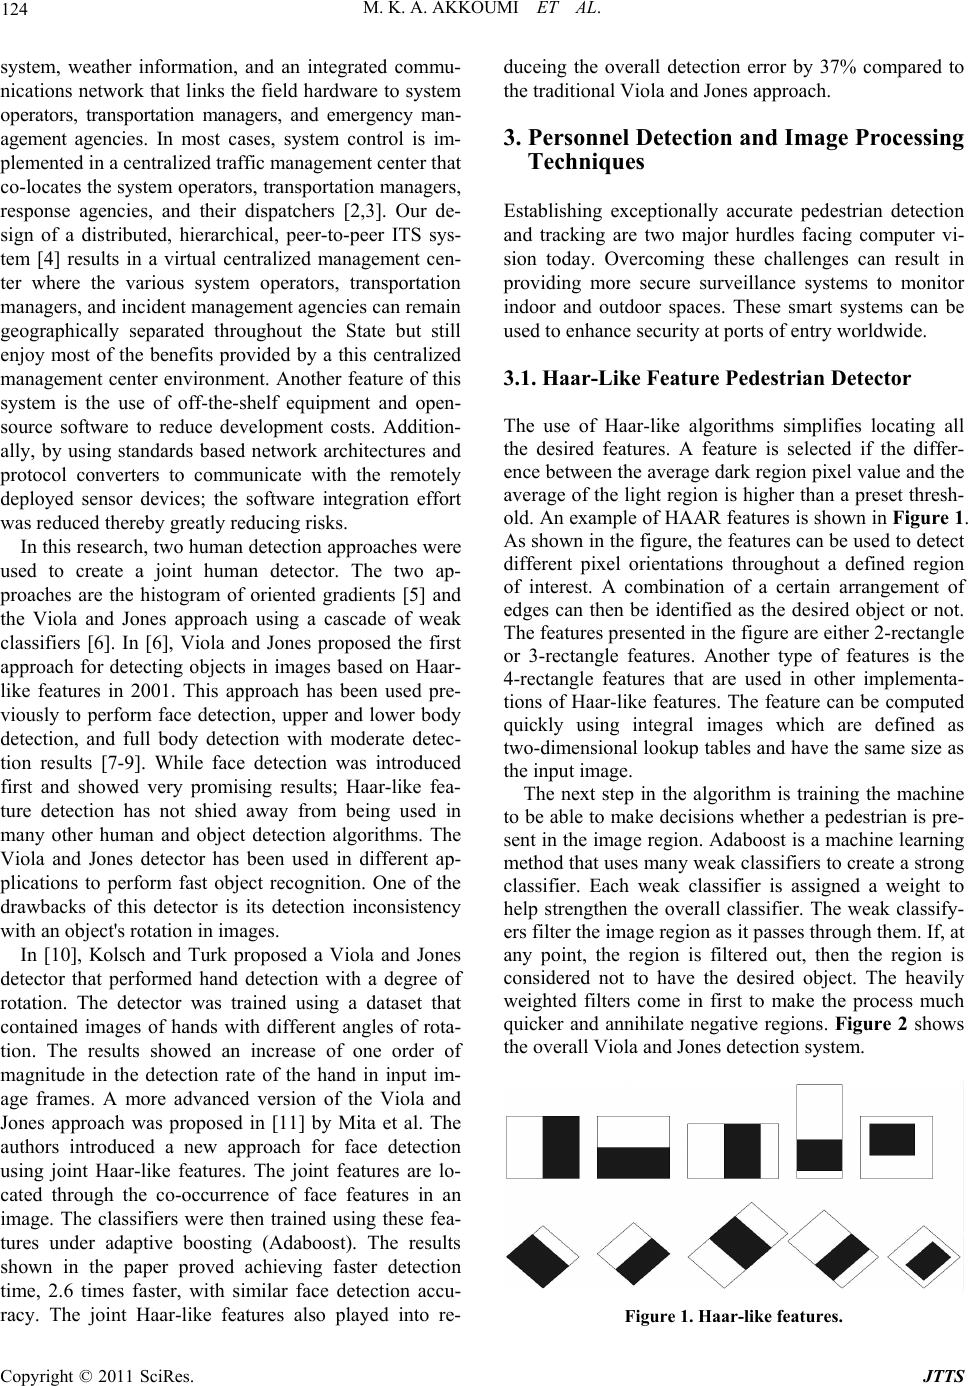 M. K. A. AKKOUMI ET AL. 124 system, weather information, and an integrated commu- nications network that links the field hardware to system operators, transportation managers, and emergency man- agement agencies. In most cases, system control is im- plemented in a centralized traffic management center that co-locates the system operators, transportation managers, response agencies, and their dispatchers [2,3]. Our de- sign of a distributed, hierarchical, peer-to-peer ITS sys- tem [4] results in a virtual centralized management cen- ter where the various system operators, transportation managers, and incident management agencies can remain geographically separated throughout the State but still enjoy most of the benefits provided by a this centralized management center environment. Another feature of this system is the use of off-the-shelf equipment and open- source software to reduce development costs. Addition- ally, by using standards based network architectures and protocol converters to communicate with the remotely deployed sensor devices; the software integration effort was reduced thereby greatly reducing risks. In this research, two human detection approaches were used to create a joint human detector. The two ap- proaches are the histogram of oriented gradients [5] and the Viola and Jones approach using a cascade of weak classifiers [6]. In [6], Viola and Jones proposed the first approach for detecting objects in images based on Haar- like features in 2001. This approach has been used pre- viously to perform face detection, upper and lower body detection, and full body detection with moderate detec- tion results [7-9]. While face detection was introduced first and showed very promising results; Haar-like fea- ture detection has not shied away from being used in many other human and object detection algorithms. The Viola and Jones detector has been used in different ap- plications to perform fast object recognition. One of the drawbacks of this detector is its detection inconsistency with an object's rotation in images. In [10], Kolsch and Turk proposed a Viola and Jones detector that performed hand detection with a degree of rotation. The detector was trained using a dataset that contained images of hands with different angles of rota- tion. The results showed an increase of one order of magnitude in the detection rate of the hand in input im- age frames. A more advanced version of the Viola and Jones approach was proposed in [11] by Mita et al. The authors introduced a new approach for face detection using joint Haar-like features. The joint features are lo- cated through the co-occurrence of face features in an image. The classifiers were then trained using these fea- tures under adaptive boosting (Adaboost). The results shown in the paper proved achieving faster detection time, 2.6 times faster, with similar face detection accu- racy. The joint Haar-like features also played into re- duceing the overall detection error by 37% compared to the traditional Viola and Jones approach. 3. Personnel Detection and Image Processing Techniques Establishing exceptionally accurate pedestrian detection and tracking are two major hurdles facing computer vi- sion today. Overcoming these challenges can result in providing more secure surveillance systems to monitor indoor and outdoor spaces. These smart systems can be used to enhance security at ports of entry worldwide. 3.1. Haar-Like Feature Pedestrian Detector The use of Haar-like algorithms simplifies locating all the desired features. A feature is selected if the differ- ence between the average dark region pixel value and the average of the light region is higher than a preset thresh- old. An example of HAAR features is shown in Figure 1. As shown in the figure, the features can be used to detect different pixel orientations throughout a defined region of interest. A combination of a certain arrangement of edges can then be identified as the desired object or not. The features presented in the figure are either 2-rectangle or 3-rectangle features. Another type of features is the 4-rectangle features that are used in other implementa- tions of Haar-like features. The feature can be computed quickly using integral images which are defined as two-dimensional lookup tables and have the same size as the input image. The next step in the algorithm is training the machine to be able to make decisions whether a pedestrian is pre- sent in the image region. Adaboost is a machine learn ing method that uses many weak classifiers to create a strong classifier. Each weak classifier is assigned a weight to help strengthen the overall classifier. The weak classify- ers filter the image region as it passes through th em. If, at any point, the region is filtered out, then the region is considered not to have the desired object. The heavily weighted filters come in first to make the process much quicker and annihilate negative regions. Figure 2 shows the overall Viola and Jones detection system. Figure 1. Haar-like features. Copyright © 2011 SciRes. JTTS 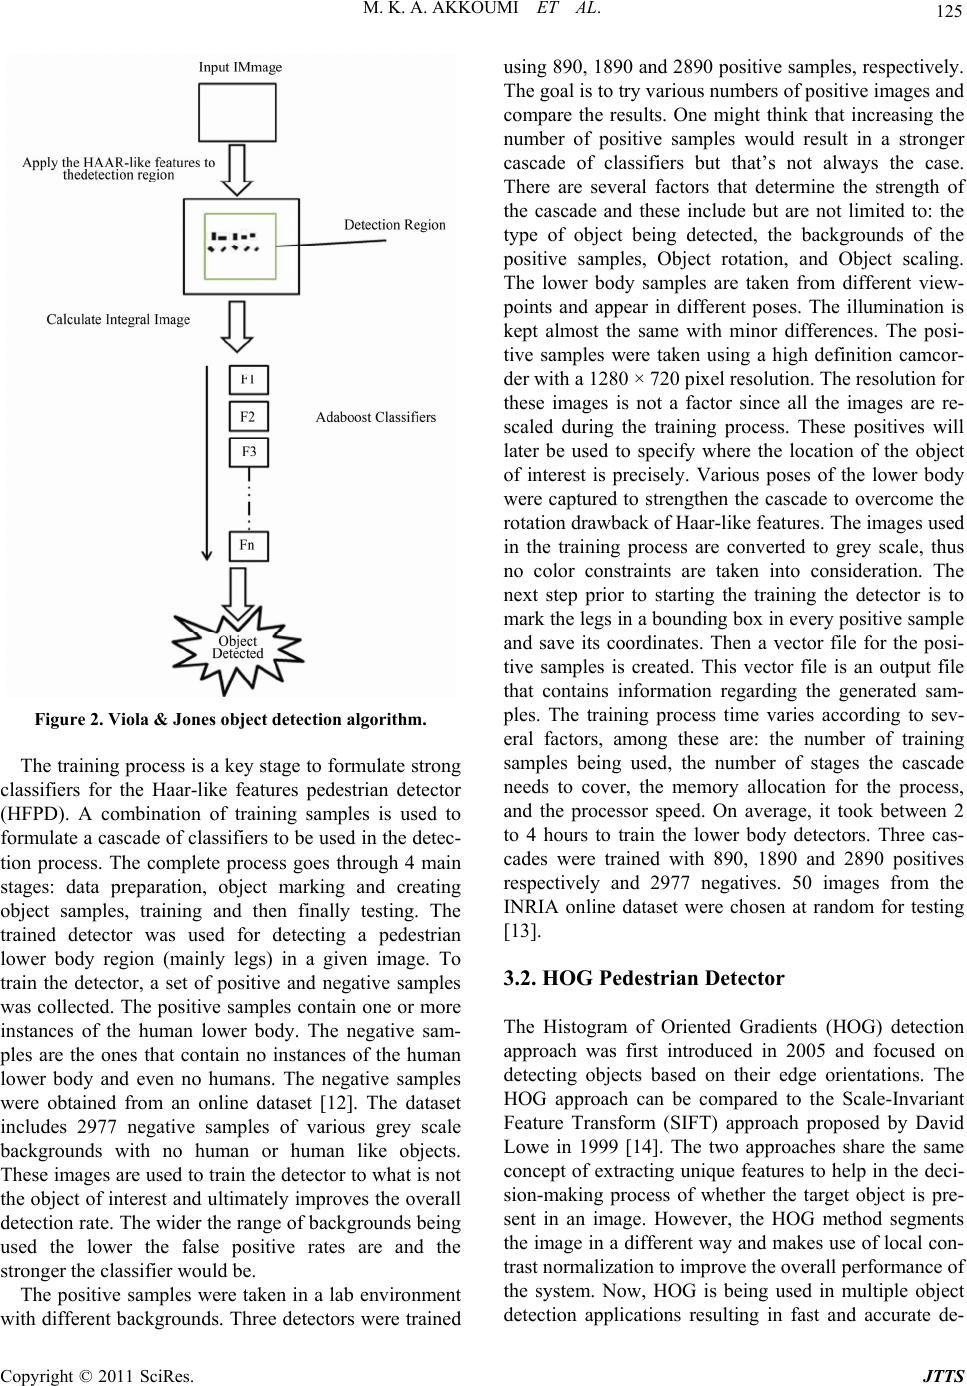 125 M. K. A. AKKOUMI ET AL. Figure 2. Viola & Jones object detection algorit hm. The training process is a key stage to formulate strong classifiers for the Haar-like features pedestrian detector (HFPD). A combination of training samples is used to formulate a cascade of classifiers to be used in the detec- tion process. The complete process goes through 4 main stages: data preparation, object marking and creating object samples, training and then finally testing. The trained detector was used for detecting a pedestrian lower body region (mainly legs) in a given image. To train the detector, a set of positive and negative samples was collected. The positive samples contain on e or more instances of the human lower body. The negative sam- ples are the ones that contain no instances of the human lower body and even no humans. The negative samples were obtained from an online dataset [12]. The dataset includes 2977 negative samples of various grey scale backgrounds with no human or human like objects. These images are used to train the detector to what is not the object of interest and ultimately improves th e overall detection ra te. The wider the range of b ackgroun ds being used the lower the false positive rates are and the stronger the classifier would be. The positive samples were taken in a lab environment with different backgrounds. Three detectors were trained using 890, 1890 and 2890 p ositive samples, respectively. The goal is to try various numbers of positive images and compare the results. One might think that increasing the number of positive samples would result in a stronger cascade of classifiers but that’s not always the case. There are several factors that determine the strength of the cascade and these include but are not limited to: the type of object being detected, the backgrounds of the positive samples, Object rotation, and Object scaling. The lower body samples are taken from different view- points and appear in different poses. The illumination is kept almost the same with minor differences. The posi- tive samples were taken using a high definition camcor- der with a 1280 × 720 p ixel resolution. The resolutio n for these images is not a factor since all the images are re- scaled during the training process. These positives will later be used to specify where the location of the object of interest is precisely. Various poses of the lower body were captured to strengthen the cascade to overcome the rotation drawback of Haar-like features. The images used in the training process are converted to grey scale, thus no color constraints are taken into consideration. The next step prior to starting the training the detector is to mark the legs in a bounding box in every positive sample and save its coordinates. Then a vector file for the posi- tive samples is created. This vector file is an output file that contains information regarding the generated sam- ples. The training process time varies according to sev- eral factors, among these are: the number of training samples being used, the number of stages the cascade needs to cover, the memory allocation for the process, and the processor speed. On average, it took between 2 to 4 hours to train the lower body detectors. Three cas- cades were trained with 890, 1890 and 2890 positives respectively and 2977 negatives. 50 images from the INRIA online dataset were chosen at random for testing [13]. 3.2. HOG Pedestrian Detector The Histogram of Oriented Gradients (HOG) detection approach was first introduced in 2005 and focused on detecting objects based on their edge orientations. The HOG approach can be compared to the Scale-Invariant Feature Transform (SIFT) approach proposed by David Lowe in 1999 [14]. The two approaches share the same concept of extracting unique features to help in the deci- sion-making process of whether the target object is pre- sent in an image. However, the HOG method segments the image in a different way and makes use of local con- trast normalization to improve the overall performance of the system. Now, HOG is being used in multiple object detection applications resulting in fast and accurate de- Copyright © 2011 SciRes. JTTS  M. K. A. AKKOUMI ET AL. Copyright © 2011 SciRes. JTTS 126 pixel is calculated based on the direction of the gradient element at its center. According to [18], a fast way to calculate the histograms of regions of interest is achieved by using integral histograms. tection [15-17]. The first step in the HOG algorithm is gradient computation. The simplest and most efficient way to accomplish that, as tested by Dalal and Triggs, is to apply a 1-D, centered point, discrete derivative mask. Applying other types of masks such as the 3 × 3 Sobel mask doesn’t lead to better overall system performance. The derivative mask system is defined as follows: In order to pass the computed histograms of gradients into a classifier, cells are organized in a 3 × 3 arrange- ment called a block. Creating blocks helps make the al- gorithm less susceptible to changes in illumination and contrast. The blocks overlap in an image producing more correlated spatial information to be used in th e descriptor, which also improves the overall detection performance. Figure 3 shows an example of blocks containing 9 cells inside the detection window. The 3 × 3 and 6 × 6 blocks worked best for Dalal and Triggs in their experimental results and believe that varying the block size has less effect on the detection as does overlapping the blocks. Y i,j=X i,j+1X i,j1 Y i,j=X i+1,jX(i1,j) The equation system contains vertical and horizontal 1D derivative masks that can be applied pixel wise to an input image X. Y is the output image with the calculated pixel derivatives on row i and column j. The whole im- age is scanned to calculate each pixel orientation to be used in computing the later histograms. The derivative masks used can be expressed as: Also in some cases, increasing the number of cells present in the block decreases the overall performance of the detection system. The rectangular HOG, also known as R-HOG, can be set with different block dimensions but are best used in square arrangements. The R-HOG is adopted in the tested HOG human detector presented in this chapter. A block is represented by a multi-dimen- sional feature vector that is used in the classification step. Block normalization is needed to decrease the required computation, thus L-2 normalization on the block is done followed by a renormalization step. , 1 0 1 1 0 1 After calculating the gradients, the algo rithm defines a detection window of fixed size (64 x 128 pixels) to scan the image. The detection window is then divided into a number of 8 × 8 pixel groups called cells, Figure 3. A cell can be rectangular or radial in shape and can vary in size although 6 × 6 pixel group is considered an optimal solution for human detection. For the purpose of this Each block is normalized and used in the collected feature vector. Using 2 × 2 cells results in having a 36 dimensional normalized feature vector, since 4-9-bin histograms were used for the HOG detector. The final step for the HOG algorithm is to use the feature vector as input to a Support Vector Machine (SVM) classifier to perform the decision making. SVM has been used by many researchers in object detection and segmentation to deliver a classification method for various objects in study, the selected cells are rectangular. The next step in this system finds a 9-bin histogram of pixel orientations for each cell. The number of orientation bins selected sug- gests looking at 20 degrees for each pixel orienta- tion. The range from 0 - 180 degrees, for unsigned gra- dients, is divided by the 9 bin orientation in which linear gradient voting is represented. A weighted vote for each Figure 3. HOG detection window with cells and blocks.  127 M. K. A. AKKOUMI ET AL. input images [19-21]. Linear SVM is one of the most common methods used for forming different classes of a dataset. The HOG algorithm feeds the descriptor vector to a trained linear SVM to determine human presence in a given test image. The HOG scheme was tested and performed extremely well on two datasets: the MIT pe- destrian database and then on a new dataset created by Dalal and Triggs called the INRIA dataset. A flow dia- gram of the HOG method is shown in Figure 4. 4. System Analysis and Results In all the conducted experiments, three rates were ob- served: false negative rate, false positive rate, and detec- tion rate. In this paper, these terms are defined as follows: a false negative rate is calculated by summing the num- ber of events where the detector missed a human present in the image and divide it by the total number of events, a false positive rate is the number of events where the detector had found something that it thinks is a human but it is not divided by the total number of events, and the detection rate is the number of events where the de- tector had found a human in the image divided by the total number of events. In add itio n, in th is pap er an even t is defined as one of three things: not detecting a human present in the image, falsely detecting a human, and de- tecting a human. These rates are determined subject- tively and through a predetermined number of test im- ages. The background in the videos for the different sce- narios was static (i.e., fixed camera positions) to help overcome any background noise that might affect the detection rate. The collected experimental results show the perform- ance of the combined human detector compared with the two separated detectors. The feedback system maintained a high detection rate and decreased the false positive rate which results in a more robust detector. Indoor and out- door scenarios with different image resoluti ons are test ed. 4.1. Merged HOG and Haar Detectors Results in an Indoor Scenario The first scenario tested for the two detectors was in- doors, as shown in Figure 5. This scenario was used previously to test the HOG full body and the Haar leg detector separately. The collected results showed high detection rates in both cases and very low false positive and negative rates. The detection rate for the Haar leg detector was 93.8% for 210 test images and the false positives rate was 9.5%. The HOG detector was able to locate the human in every frame with an insignificant false positive rate. Figure 4. Static histogram of oriented gradients approach. Figure 5. HOG and Haar used in an Indoor scenario. Copyright © 2011 SciRes. JTTS  M. K. A. AKKOUMI ET AL. 128 The test results for the indoor scenario were taken to show both detectors activities and how the algorithm works in different cases. For example, the first and sec- ond frames in the above figure show complete detectio n. The third, sixth and eighth frames show a detected hu- man by the HOG detector and missed detection by the Haar detector as explained in Subsection 5.3.2. The fourth and fifth frames show two cases of HOG detection and Haar false detection. Note that in the fourth frame the false detected leg is the upper body and within the region of the human. In the fifth frame, a second false positive is shown by the Haar detecto r behind th e human. This false positive is discarded during th e feedback mes- saging algorithm while the other one, which is in the human detection region, is not. The seventh frame shows one HOG detection box and three Haar detection circles, two of which are true detection and one false positive that falls within the HOG box. 4.2. Merged Detectors Tested on Two Humans in an Outdoor Scenario The second scenario used to test the two merged detec- tors was of two humans in an outdoor scenario . Figure 6 shows the detected false positive and negative results for both detectors. The first frame shows two HOG boxes for the two humans and that the Haar detector has missed both. The second and eightth frames are the only ones where both detectors agree on spotting both pedestrians. In the third frame, the HOG detector finds both humans whereas the Haar finds none and adds a false positive. The fifth frame shows both humans detected as one using the HOG full body detector. In this case, only one alert is sent. In the fourth, sixth, and seventh frames, the HOG finds the two humans whereas the Haar detector only finds one. Two alerts are sent out to the authorized personnel. When tested separately using 300 test images, the detectors showed different detection, false positive and negative rates. The HOG outperformed the Haar detector in the detection and negative rates by almost 20% for each. Both detectors had approximately the same false positive rate of 6%. Using the feedback mes- saging system, a more accurate human detector can be established by merging the two full and part-based de- tectors. The feedback system helps decrease the false positive rate for the combined detector. Table 1 shows the statistics for all three cases. Figure 6. Results of applying both detectors in an outdoor scenario. Table 1. Detection statistics for separated and merged detectors. Detector Types Resolution (in pixels) Total Number of Test Images Detection Rate False Positive Rate False Negative Rate Average Detection Time (in ms) HOG Full Body Detector 640 × 480 300 97.0% 5.3% 3% 790 Haar Leg Detector 640 × 480 300 77.33% 6% 22.67% 50 Merged Detector 640 × 480 300 97.0% 0.67% 3% 880 Copyright © 2011 SciRes. JTTS  129 M. K. A. AKKOUMI ET AL. Each of the 300 test images must ideally produce two alerts, one for each human in the captured frame. Thus, the expected total number of true alerts sent is 600. The false positive rate can be decreased using information from both detectors where the human is expected to be. Therefore, a huge reduction in the false positive rate can be observed. On the other hand, the negative rate stays the same as the one for the more accurate detector, which in this case is the HOG full body detector. The final de- tection rate for the merged detector is 97%. The detec- tion time for the final detector is approximately the sum of the detection time of both detectors in addition to a small margin taken for the feedba ck messaging system. 4.3. Merged Detectors Tested on Multiple Humans in an Outdoor Scenario The last scenario investig ated has multiple humans walk- ing in an outdoor scene. Again, the two detectors are applied on several test frames to determine subjectively the false positive, false negative and detection rates. Figure 7 shows the results of merging the two detectors. As expected, the HOG detector produced a detection rate higher than that of the Haar leg detector. The HOG de- tection rate was 93.5% while the Haar had a detection rate of 62.8% for 300 test images. The false positive rate in both cases was less than 3%. Note that the Haar leg detector was not able to find all four pedestrians in the test images. This is due to the training dataset that only included one instance of the target object for each image. In this scenario, four humans are walking around and at times partially or fully occluding one another. Table 2 shows the detection, false positive and negative rates in addition to the average detection time for each detector. The detection time is higher than the previous scenario due to an increase in the video resolution from 640 × 480 to 848 × 480 pixels. The system requires just over a sec- ond to determine whether one or more humans are pre- sent in frames of size 848x480 pixels. Ideally, the num- ber of produced alerts should be 1200, but in this case, the 300 test images contained 1, 2, 3 or 4 humans per frame. The total number of expected alerts is 838 alerts. Note that the detection rate for the merged detector is not much higher than that of the fu ll body detector du e to the high negative rate that was not decreased. On the other hand, the false positive rate was taken out by the feed- back messaging system. The false positives from both detectors were not in the same location and also did not correspond with the location of the moving object given by the tracker. Table 2. Detection statistics for multiple human separate and merged detectors. Detector Resolution (in pixels) Total Number of Test Frames Detection Rate False Positive Rate False Negative Rate Average Detection Time (in ms) HOG Full Body Detector 848 × 480 300 93.5% 1.1% 6.5% 1010 Haar Leg Detector 848 × 480 300 62.8% 2.7% 37.2% 70 Merged Detector 848 × 480 300 93.5% 0% 6.5% 1150 Figure 7. Results of applying both detectors for multiple human detection. Copyright © 2011 SciRes. JTTS  M. K. A. AKKOUMI ET AL. 130 5. Future Work and Conclusions reason for the ents nded by a grant from the Federal Highway Administration and the program is administered by the Oklahoma Department of Transpor- ategy for maritime security,” 2010. s.gov/xlibrary/assets/HSPD13_MaritimeSe df dson 04.13 Th size of the input image is the main e slower detection time, and is due to a bigger number of visited detection windows required for detection. The authors believe that downsampling the images can help decrease the detection time to fit in a model for real-time or near real-time pedestrian detection. Additionally, work accomplished with General Purpose Graphical Processing Units (GPGPUs) indicates processing speed increases with this kind of application. Based on the ex- perimental results collected thus far, the authors believe that combining the two detectors in addition to pre- processing with an object tracker would result in a robust personnel detection and tracking system. The first stage in the system is the tracking stage. The object tracker identifies moving silhouettes in the video capture and alerts the user of a potential threat. The second stage in- cludes the HOG full bod y detector that looks at the loca- tion of the moving object and determines whether it is a human or not. The third stage introduces the Haar-like feature pedestrian detector that tries to find upper and lower human body regions. The fourth stage starts the feedback messaging between the detectors to decide whether the detected region actually contains a pedes- trian or it’s a false positive. After several iterations, the system converges and the detection results are collected. The results collected in this paper are based on several training and testing data sets. This helps establish a more generalized solution to the presented challeng es. The two stages complement one another in such a way that the detection system is much stronger than the current sys- tems. The Viola and Jones approach is not a computa- tionally heavy approach and provides object detection at different scales and backgrounds. Thus, the feedback stage will help improve the detection rate without slow- ing down the overall system. In this paper, we proposed a low cost distributed ITS-based smart sur- veillance security system for port security. This system is very scalable and provides improvements to a major inter- modal maritime application. Using image processing techniques security can be enhanced to capture unau- thorized personnel in restricted areas. Port security op- erators can rely on alerts produced by the pedestrian de- tection and tracking system as well as the container tracking devices to assess port security. These systems complement the overall security system and integrate well as building blocks. This security approach can be used in various applications and sites to improve overall security nationwide. 6. Acknowledgem This research program is partially fu tation. The project is federally sponsored under the SAFETEA-LU transportation authorization act. This program is a five year program started in October 2005. This specific research is part of the Phase III tasks and deliverables. 7. References [1] “The national str http://www.dh curityStrategy.p [2] R. H. Brakman and J. J. Limarzi, “ITS at the Hu Valley Transportation Management Center,” IEEE Intel- ligent Systems, Vol. 19, No. 3, 2004, pp. 8-12. doi:10.1109/MIS.20 onference, 9/NTC.1993.293012 [3] M. J. Kelly, D. J. Folds and N. Sobhi, “ATMS 2000: Hybrid Automation or a Lights Out Traffic Management Center?” Proceedings National Telesystems C 1993, pp. 37-42. doi:10.110 nce In- p. 886-893. -511-I-518. 72-76. [4] R. Huck, J. Havlicek, J. Sluss, Jr. and A. Stevenson, “A Low-Cost Distributed Control Architecture for Intelligent Transportation Systems Deployment in the State of Okla- homa,” Proceedings IEEE International Confere telligent Transportation Systems, Vienna, Austria, 2005, pp. 919-924. [5] N. Dalal, and B. Triggs, “Histograms of Oriented Gradi- ents for Human Detection,” IEEE Computer Society Con- ference on Computer Vision and Pattern Recognition, Vol. 1, 2005, p [6] P. Viola and M. Jones, “Rapid Object Detection Using a Boosted Cascade of Simple Features,” IEEE Computer Society Conference on Computer Vision and Pattern Rec- ognition, Vol. 1, 2001, pp. I [7] L. Yun and Z. Peng, “An Automatic Hand Gesture Rec- ognition System Based on Viola-Jones Method and SVMs,” IEEE International Workshop on Computer Sci- ence and Engineering, Vol. 2, 2009, pp. doi:10.1109/WCSE.2009.769 [8] T. Ephraim, T. Himmelman and K. Siddiqi, “Real-Time Viola-Jones Face Detection in a Web Browser,” IEEE Canadian Conference on Computer and Robo 2009, pp. 321-328. t Vision, /CRV.2009.48doi:10.1109 es, 2010, [9] D. Hefenbrock, J. Oberg, N. T. N. Thanh and R. Kastner, “Accelerating Viola-Jones Face Detection to FPGA- Level Using GPUs,” IEEE International Symposium on Field-Programming Custom Computing Machin pp. 11-18. doi:10.1109/CRV.2009.48 [10] M. Kolsch and M. Turk, “Analysis of Rotational Robust- ness of Hand Detection with a Viola-Jones Detector,” Proceedings International Conference on Pattern Recog- nition, Santa Barbara, Vol. 3, 2004, pp. 107-110. [11] T. Mita, T. Kaneko and O. Hori, “Joint Haar-like Fea- tures for Face Detection,” IEEE International Conference on Computer Vision, Beijing, Vol. 2, 2005, pp. Copyright © 2011 SciRes. JTTS  M. K. A. AKKOUMI ET AL. 131 inrialpes.fr/data/human/ on 150-1157. 1619-1626. [12] N. Seo, “Tutorial: OpenCV Haartraining,” 2008. http://note.sonots.com/SciSoftware/haartraining.html [13] N. Dalal, “INRIA Person Dataset,” http://pascal. [14] D. Lowe, “Object Recognition from Local Scale-In- variant Features,” IEEE International Conference Computer Vision, Vol. 2, 1999, pp. 1 doi:10.1109/ICCV.1999.790410 [15] H. X. Jia and Y. J. Zhang, “Fast Human Detection by Boosting Histograms of Oriented Gradients,” IEEE In- ternational Conference on Image and Graphics, 2 683-688. 007, pp. ter Vision and Pattern Recognition, Vol. 2, [16] Q. Zhu, M. C. Yeh, K. T. Cheng and S. Avidan, “Fast Human Detection Using a Cascade of Histograms of Oriented Gradients,” IEEE Computer Society Conference on Compu 2006, pp. 1491-1498. [17] C. Zhou, L. Tang, S. Wang and X. Ding, “Human Detec- tion Based on Fusion of Histograms of Oriented Gradi- ents and Main Partial Features,” International Congress on Image and Signal Processing, 2009, pp. 1-5. doi:10.1109/CISP.2009.5304536 [18] F. Porikli, “Integral Histogram: A Fast Way to Extract Histograms in Cartesian Spaces,” IEEE Compute Conference on Computer Vision ar Society nd Pattern Recognition, on Information Processing, ages Using Genetic Algorithms and IEEE Vol. 1, 2005, pp. 829-836. [19] H. Li and J. Cao, “Detection and Segmentation of Mov- ing Objects Based on Support Vector Machine,” IEEE International Symposium 2010, pp. 193-197. [20] E. Pasolli, F. Melgani, M. Donelli, R. Attoui and M. De Vos, “Automatic Detection and Classification of Buried Objects in GPR Im Support Vector Machines,” IEEE Geoscience and Remote Sensing Symposium, Vol. 2, 2008, pp. II-525-II528. [21] G. Zhu, C. Xu, Q. Huang and W. Gao, “Automatic Multi- Player Detection and Tracking in Broadcast Sports Video using Support Vector Machine and Particle Filter,” International Conference on Multimedia and Expo, 2006, pp. 1629-1632. doi:10.1109/ICME.2006.262859 Copyright © 2011 SciRes. JTTS |