 Journal of Transportation Technologies, 2011, 1, 83-93 doi:10.4236/jtts.2011.14011 Published Online October 2011 (http://www.SciRP.org/journal/jtts) Copyright © 2011 SciRes. JTTS Lethe@-UDR1 Passenger Sedan Final Proposed Configuration Roberto Capata Department Of Mechani cal a nd Aeros pace Engineering, University of Roma “Sapienza” E-mail: roberto.capata@uniroma1.it Received June 29, 2011; revised August 9, 2011; accepted August 27, 2011 Abstract For years the interest of the UDR1 researcher group has been focused on the development of a Hybrid Series (HS) vehicle, different from the standard one, using a Gas Turbine (GT) set as a thermal engine. The reason of this choice resides in the opportunity to reduce weight and dimension, in comparison to a traditional In- ternal Combustion Engine (ICE). It’s not possible to use the GT engine directly for the vehicle traction, so the UDR1 HS configuration shows the GT set connected with the electric generator only. The result is that the traction is pure electric. Many efforts are spent in the definition of a generic scientific method to define the correct ratio HD (the Hybridization Degree) between the installed power of the battery pack and that of the GT electric generator which simultaneously guarantee the main life for the battery package and the ca- pacity of the vehicle to complete a common mission (about 15 km - 30 km) without lack of energy or stop. This paper reports all studies carried out and finally proposes a possible configuration (weight distribution, VMU logic control, GT dimensions and power rate, battery package characteristics and so on) for mid term solution in the Italian transport system. Keywords: Hybrid Vehicle, Passenger Sedan, Components Distribution, Degree of Hybridization, VMU Logic 1. Introduction 1.1. Brief Review of Existing Hybrid Vehicle Concepts and of The Present Market Opportunities In the last decade, governmental incentives and the ever stricter emissions regulations have prompted some of the largest world automakers to dedicate resources to the study, design, development and production of hybrid vehicles, which offer undisputed advantages in terms of emissions and fuel consumption with respect to tradi- tional, reciprocating internal combustion engines. In fact, hybrid engines are substantially smaller than conven- tional ICE, because they are designed to cover the vehi- cle’s “average” power demand, which ensures proper traction for about 99% of the actual driving time, and is exceeded only for prolonged mountain drives and in- stantaneous accelerations. When excess power is needed above this average, the hybrid vehicle relies on the en- ergy stored in its battery pack. Hybrid cars are often equipped with braking energy recovery systems that col- lect the kinetic energy lost in braking, which would be dissipated into heat otherwise, and use it to recharge the battery. Smaller sizes and an (almost) constant opera- tional curve lead to lower emissions. Moreover, a hybrid vehicle can shut down completely its gasoline engine and run off its electric motor and battery only, at least for a certain range: this “mixed operation” increases the net mileage and releases a substantially lower amount of pollutants over the vehicle lifetime. The best known hy- brid vehicles (HV) that recently have enjoyed the lime- light of headlines and of technical reviews are all hybrid cars equipped with a traditional ICE and an electric mo- tor coupled in parallel. The thermal engine is sized, with some exceptions, for the average power, and the surplus power needed during rapid acceleration phases is sup- plied by the electric motor. 1.2. Hybrid Configurations There are several hybrid concepts, differing by the type of coupling between the electric and the thermal engine, and by the control logic that supervises the energy flows. 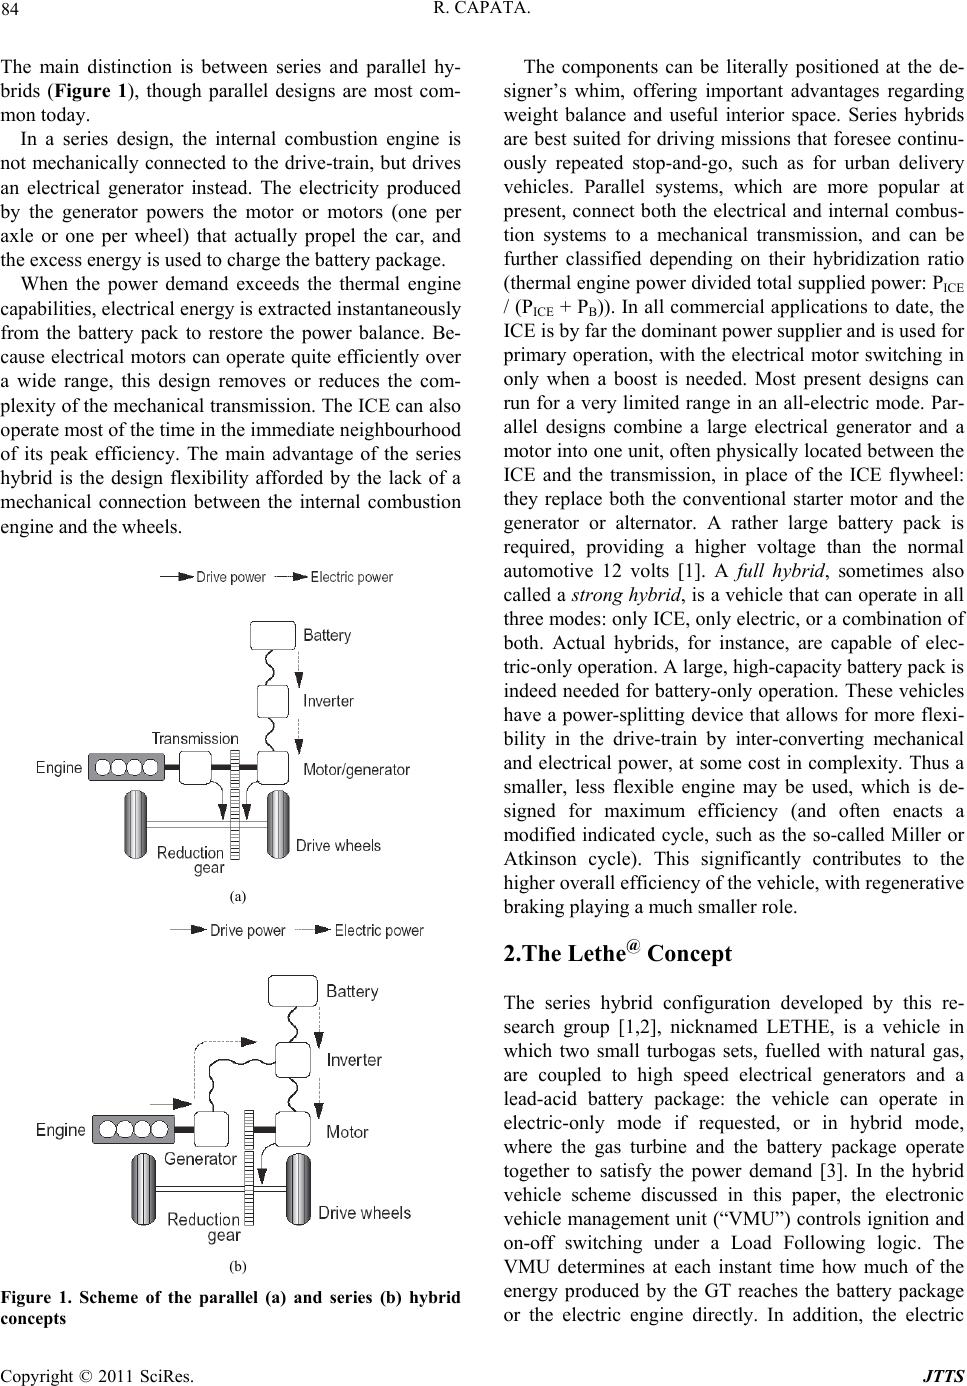 R. CAPATA. 84 The main distinction is between series and parallel hy- brids (Figure 1), though parallel designs are most com- mon today. In a series design, the internal combustion engine is not mechanically connected to the drive-train, but drives an electrical generator instead. The electricity produced by the generator powers the motor or motors (one per axle or one per wheel) that actually propel the car, and the excess energy is used to charge the battery package. When the power demand exceeds the thermal engine capabilities, electrical energy is extracted instantaneously from the battery pack to restore the power balance. Be- cause electrical motors can operate quite efficiently over a wide range, this design removes or reduces the com- plexity of the mechanical transmission. The ICE can also operate most of the time in the immediate neighbourhood of its peak efficiency. The main advantage of the series hybrid is the design flexibility afforded by the lack of a mechanical connection between the internal combustion engine and the wheels. (a) (b) Figure 1. Scheme of the parallel (a) and series (b) hybrid concepts The components can be literally positioned at the de- signer’s whim, offering important advantages regarding weight balance and useful interior space. Series hybrids are best suited for driving missions that foresee continu- ously repeated stop-and-go, such as for urban delivery vehicles. Parallel systems, which are more popular at present, connect both the electrical and internal combus- tion systems to a mechanical transmission, and can be further classified depending on their hybridization ratio (thermal engine power divided total supplied power: PICE / (PICE + PB)). In all commercial applications to date, the ICE is by far the dominant power supplier and is used for primary operation, with the electrical motor switching in only when a boost is needed. Most present designs can run for a very limited range in an all-electric mode. Par- allel designs combine a large electrical generator and a motor into one unit, often physically located between the ICE and the transmission, in place of the ICE flywheel: they replace both the conventional starter motor and the generator or alternator. A rather large battery pack is required, providing a higher voltage than the normal automotive 12 volts [1]. A full hybrid, sometimes also called a strong hybrid, is a vehicle that can operate in all three modes: only ICE, only electric, or a combination of both. Actual hybrids, for instance, are capable of elec- tric-only operation. A large, high-capacity battery pack is indeed needed for battery-only operation. These vehicles have a power-splitting device that allows for more flexi- bility in the drive-train by inter-converting mechanical and electrical power, at some cost in complexity. Thus a smaller, less flexible engine may be used, which is de- signed for maximum efficiency (and often enacts a modified indicated cycle, such as the so-called Miller or Atkinson cycle). This significantly contributes to the higher overall efficiency of the vehicle, with regenerative braking playing a much smaller role. 2.The Lethe@ Concept The series hybrid configuration developed by this re- search group [1,2], nicknamed LETHE, is a vehicle in which two small turbogas sets, fuelled with natural gas, are coupled to high speed electrical generators and a lead-acid battery package: the vehicle can operate in electric-only mode if requested, or in hybrid mode, where the gas turbine and the battery package operate together to satisfy the power demand [3]. In the hybrid vehicle scheme discussed in this paper, the electronic vehicle management unit (“VMU”) controls ignition and on-off switching under a Load Following logic. The VMU determines at each instant time how much of the energy produced by the GT reaches the battery package or the electric engine directly. In addition, the electric Copyright © 2011 SciRes. JTTS 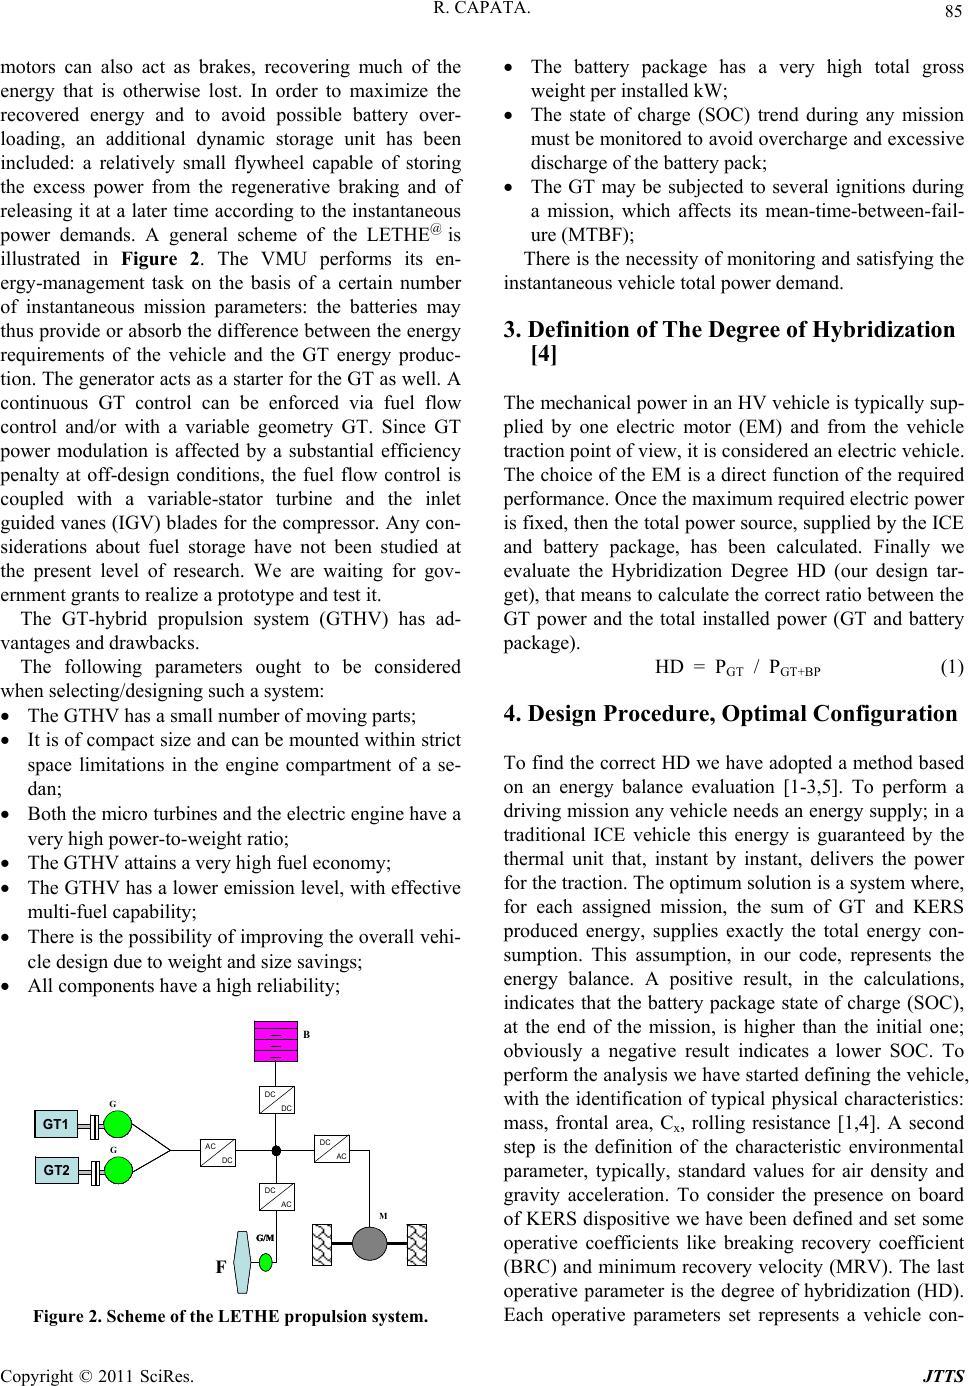 85 R. CAPATA. motors can also act as brakes, recovering much of the energy that is otherwise lost. In order to maximize the recovered energy and to avoid possible battery over- loading, an additional dynamic storage unit has been included: a relatively small flywheel capable of storing the excess power from the regenerative braking and of releasing it at a later time according to the instantaneous power demands. A general scheme of the LETHE@ is illustrated in Figure 2. The VMU performs its en- ergy-management task on the basis of a certain number of instantaneous mission parameters: the batteries may thus provide or absorb the difference between the energy requirements of the vehicle and the GT energy produc- tion. The generator acts as a starter for the GT as well. A continuous GT control can be enforced via fuel flow control and/or with a variable geometry GT. Since GT power modulation is affected by a substantial efficiency penalty at off-design conditions, the fuel flow control is coupled with a variable-stator turbine and the inlet guided vanes (IGV) blades for the compressor. Any con- siderations about fuel storage have not been studied at the present level of research. We are waiting for gov- ernment grants to realize a prototype and test it. The GT-hybrid propulsion system (GTHV) has ad- vantages and drawbacks. The following parameters ought to be considered when selecting/designing such a system: The GTHV has a small number of moving parts; It is of compact size and can be mounted within strict space limitations in the engine compartment of a se- dan; Both the micro turbines and the electric engine have a very high power-to-weight ratio; The GTHV attains a very high fuel economy; The GTHV has a lower emission level, with effective multi-fuel capability; There is the possibility of improving the overall vehi- cle design due to weight and size savings; All components have a high reliability; B G GT1 G GT1 G GT1 G GT2 M V G/M AC DC DC AC DC AC DC DC B G GT1 G GT1 G GT1 G GT2 M V G/M B G GT1 G GT1 G GT1 G GT2 G GT1 G GT1 G GT1 G GT1 G GT1 G GT1 G GT2 G GT1 G GT1 G GT2 M V G/M AC DC DC AC DC AC DC DC F Figure 2. Scheme of the LETHE propulsion system. The battery package has a very high total gross weight per installed kW; The state of charge (SOC) trend during any mission must be monitored to avoid overcharge and excessive discharge of the battery pack; The GT may be subjected to several ignitions during a mission, which affects its mean-time-between-fail- ure (MTBF); There is the necessity of monitoring and satisfying the instantaneous vehicle total power demand. 3. Definition of The Degree of Hybridization [4] The mechanical power in an HV vehicle is typically sup- plied by one electric motor (EM) and from the vehicle traction point of view, it is considered an electric vehicle. The choice of the EM is a direct function of the required performance. Once the maximum required electric power is fixed, then the total power source, supplied by the ICE and battery package, has been calculated. Finally we evaluate the Hybridization Degree HD (our design tar- get), that means to calculate the correct ratio between the GT power and the total installed power (GT and battery package). HD = PGT / PGT+BP (1) 4. Design Procedure, Optimal Configuration To find the correct HD we have adopted a method based on an energy balance evaluation [1-3,5]. To perform a driving mission any vehicle needs an energy supply; in a traditional ICE vehicle this energy is guaranteed by the thermal unit that, instant by instant, delivers the power for the traction. The optimum solution is a system where, for each assigned mission, the sum of GT and KERS produced energy, supplies exactly the total energy con- sumption. This assumption, in our code, represents the energy balance. A positive result, in the calculations, indicates that the battery package state of charge (SOC), at the end of the mission, is higher than the initial one; obviously a negative result indicates a lower SOC. To perform the analysis we have started defining the vehicle, with the identification of typical physical characteristics: mass, frontal area, Cx, rolling resistance [1,4]. A second step is the definition of the characteristic environmental parameter, typically, standard values for air density and gravity acceleration. To consider the presence on board of KERS dispositive we have been defined and set some operative coefficients like breaking recovery coefficient (BRC) and minimum recovery velocity (MRV). The last operative parameter is the degree of hybridization (HD). Each operative parameters set represents a vehicle con- Copyright © 2011 SciRes. JTTS  R. CAPATA. 86 figuration. At the end of this preliminary phase we have been selected several representative missions (ex. urban routes for a city car or bus). 5. Preliminary Calculation Method The code, implemented on Matlab™ environment, for any assigned mission and vehicle configuration, calcu- lates, second by second, the required power for traction, breaking and available to KERS [5]. As the first calcula- tion step, it evaluates the needed power for acceleration, deceleration, inertia, rolling resistance and aerodynamic resistance. This operation has to be repeated for every different vehicle configuration and for all selected mis- sions, so the number of data and diagrams increase quickly. During this procedure step, some vehicle pa- rameters have been considered as constant and for some others a range of variability has been set (i.e. mass vehi- cle, KERS efficiency coefficient, etc.). The typical code analysis simulates every selected mission, considering the maximum and minimum vehicle pay load. In addition to these two options for the vehicle set up, also KERS minimum and maximum efficiency is considered, so the total combination of these variable vehicle parameters have as a consequence the generation of four simulating cases for each selected mission. The second calculation step analyzes all power requests among all four cases for a chosen mission, and the maximum value of the power is considered as the vehicle total required power. The second part of the code performs the optimization of the vehicle configuration, considering a variable GT nominal power into a range within 0 kW to the maximum power request for the analyzed mission, this is repeated for each configuration combination. This mean that we analyze the mission for a variable degree of hybridization into a range within 0% to 100%. The choice to adopt an “on-off” logic derives from experimental considerations and by the experience in the HS vehicle design, espe- cially in the urban cycles, where it is mandatory to minimize the “working time” of the GT device. The adopted electronic logic is described here follow. 6. The Vehicle Management Unit [5] The control logic implemented via a specially designed microprocessor, manages the energy flow through the different components, aiming to optimize them in terms of fuel consumption, emission levels, and battery life. An important aspect of the control logic is that the efficiency of the regenerative braking, measured as the ratio of the recovered energy to the total energy available in a decal- eration, is closely correlated with the electric characteris- tics of the batteries. For the Pb-acid batteries considered in this work, the limit during the recharge phase is set by the allowable current that can flow through the battery, which in turn is a function of the battery capacity for a certain state of charge. When the SOC increases, the maximum admissible current decreases and thus, above a certain threshold (SOC = 0.8 in this case), the kinetic energy recovery is no longer possible and the traditional friction brakes must be fully activated. To counter this effect, another energy storage system has been added (both compact flywheels and ultra-capacitors have been considered), to absorb the “instantaneous” energy excess and the intervention of the traditional braking system to a minimum. Both compact flywheels and ultra-capacitors have been considered, and the the flywheel was selected. This means that for example, when selecting the size of the battery pack, not only the maximum power requested in the electric-only mode, but also the global amount of energy recovered by the regenerative braking should be considered. In practice, to proceed with instantaneous system optimization using the Vehicle Management Logic Unit, it is necessary to provide that all the instan- taneous values of thermal, mechanical and electrical sys- tem parameters be available to processor in acceptable format. These parameters include: The instantaneous power demand; The instantaneous energy balance; The type of batteries; The SOC trend during the mission (dictated by the type of batteries and their service life); The number of ignitions of the GT set; The allocation of power between the two GT sets. A closed-loop logic was selected. This type of energy flow management has the advantage of being mis- sion-independent within broad limits. The power demand at the wheels is a fundamental parameter both for system design and VMU definition. The VMU computes the instantaneous power demand, compares it with the available power and keeps track of the history of the en- ergy flows. To achieve correct system operation in all possible conditions, the GT unit must be designed using the maximum mission power demand criterion. The type and model of battery package are the other fundamental parameters. The VMU continuously controls electrical parameters of the battery package to optimize its use and to avoid harmful overloads that would reduce its life and efficiency. For this reason the current flow through the battery pack is constantly monitored. The current is usu- ally correlated to the capacity C of the battery (in Ah), i.e. to the quantity of current it can provide per hour. Most manufactures recommend to not exceed 5C during dis- charge, i.e. five times the value of the maximum per- missible current per hour’s discharge. In a electric-only Copyright © 2011 SciRes. JTTS 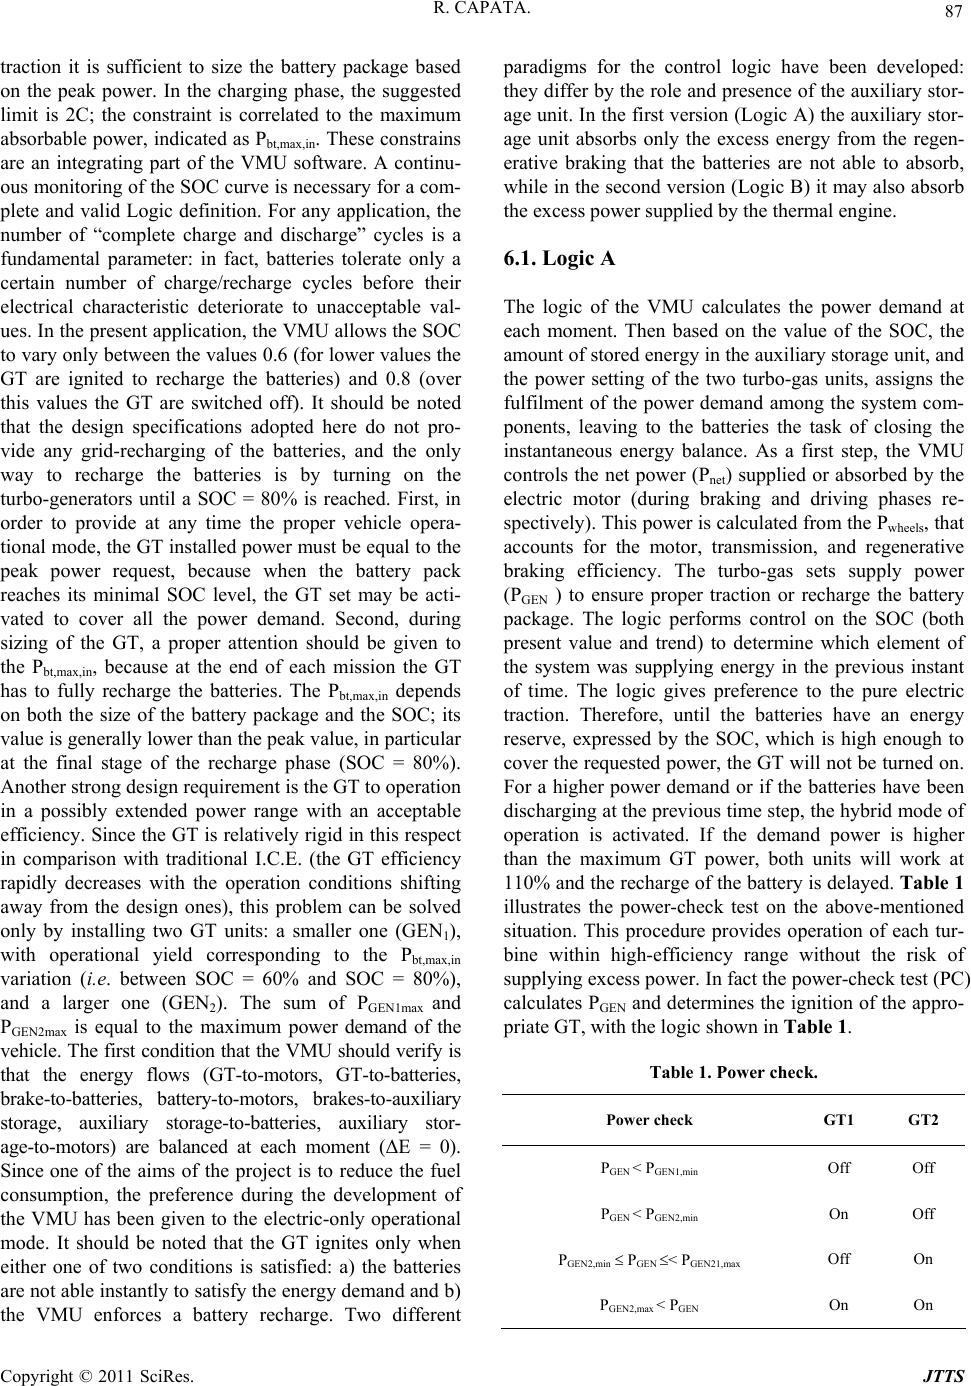 87 R. CAPATA. traction it is sufficient to size the battery package based on the peak power. In the charging phase, the suggested limit is 2C; the constraint is correlated to the maximum absorbable power, indicated as Pbt,max,in. These constrains are an integrating part of the VMU software. A continu- ous monitoring of the SOC curve is necessary for a com- plete and valid Logic definition. For any application, the number of “complete charge and discharge” cycles is a fundamental parameter: in fact, batteries tolerate only a certain number of charge/recharge cycles before their electrical characteristic deteriorate to unacceptable val- ues. In the present application, the VMU allows the SOC to vary only between the values 0.6 (for lower values the GT are ignited to recharge the batteries) and 0.8 (over this values the GT are switched off). It should be noted that the design specifications adopted here do not pro- vide any grid-recharging of the batteries, and the only way to recharge the batteries is by turning on the turbo-generators until a SOC = 80% is reached. First, in order to provide at any time the proper vehicle opera- tional mode, the GT installed power must be equal to the peak power request, because when the battery pack reaches its minimal SOC level, the GT set may be acti- vated to cover all the power demand. Second, during sizing of the GT, a proper attention should be given to the Pbt,max,in, because at the end of each mission the GT has to fully recharge the batteries. The Pbt,max,in depends on both the size of the battery package and the SOC; its value is generally lower than the peak value, in particular at the final stage of the recharge phase (SOC = 80%). Another strong design requirement is the GT to operation in a possibly extended power range with an acceptable efficiency. Since the GT is relatively rigid in this respect in comparison with traditional I.C.E. (the GT efficiency rapidly decreases with the operation conditions shifting away from the design ones), this problem can be solved only by installing two GT units: a smaller one (GEN1), with operational yield corresponding to the Pbt,max,in variation (i.e. between SOC = 60% and SOC = 80%), and a larger one (GEN2). The sum of PGEN1max and PGEN2max is equal to the maximum power demand of the vehicle. The first condition that the VMU should verify is that the energy flows (GT-to-motors, GT-to-batteries, brake-to-batteries, battery-to-motors, brakes-to-auxiliary storage, auxiliary storage-to-batteries, auxiliary stor- age-to-motors) are balanced at each moment (ΔE = 0). Since one of the aims of the project is to reduce the fuel consumption, the preference during the development of the VMU has been given to the electric-only operational mode. It should be noted that the GT ignites only when either one of two conditions is satisfied: a) the batteries are not able instantly to satisfy the energy demand and b) the VMU enforces a battery recharge. Two different paradigms for the control logic have been developed: they differ by the role and presence of the auxiliary stor- age unit. In the first version (Logic A) the auxiliary stor- age unit absorbs only the excess energy from the regen- erative braking that the batteries are not able to absorb, while in the second version (Logic B) it may also absorb the excess power supplied by the thermal engine. 6.1. Logic A The logic of the VMU calculates the power demand at each moment. Then based on the value of the SOC, the amount of stored energy in the auxiliary storage unit, and the power setting of the two turbo-gas units, assigns the fulfilment of the power demand among the system com- ponents, leaving to the batteries the task of closing the instantaneous energy balance. As a first step, the VMU controls the net power (Pnet) supplied or absorbed by the electric motor (during braking and driving phases re- spectively). This power is calculated from the Pwheels, that accounts for the motor, transmission, and regenerative braking efficiency. The turbo-gas sets supply power (PGEN ) to ensure proper traction or recharge the battery package. The logic performs control on the SOC (both present value and trend) to determine which element of the system was supplying energy in the previous instant of time. The logic gives preference to the pure electric traction. Therefore, until the batteries have an energy reserve, expressed by the SOC, which is high enough to cover the requested power, the GT will not be turned on. For a higher power demand or if the batteries have been discharging at the previous time step, the hybrid mode of operation is activated. If the demand power is higher than the maximum GT power, both units will work at 110% and the recharge of the battery is delayed. Table 1 illustrates the power-check test on the above-mentioned situation. This procedure provides operation of each tur- bine within high-efficiency range without the risk of supplying excess power. In fact the power-check test (PC) calculates PGEN and determines the ignition of the appro- priate GT, with the logic shown in Table 1. Table 1. Power check. Power check GT1 GT2 PGEN < PGEN1,min Off Off PGEN < PGEN2,min On Off PGEN2,min PGEN < PGEN21,max Off On PGEN2,max < PGEN On On Copyright © 2011 SciRes. JTTS  R. CAPATA. 88 Within the values of the GT operational field limits, the two turbo-generators supply in a load-following mode the exact amount of power for traction and battery recharge. If power demand is less than PGEN1min, the first turbo-generator (GT1) is turned off, because the excess power produced would overload the batteries. If power demand exceeds PGEN2max , GT2 operates at 110% of its nominal condition and the remaining demand is sup- ported by GT1. Between PGEN1max and PGEN2min the hybrid traction is activated and the power demand is supplied by both GT units and batteries. The operational power range of the traction system under Logic A is illustrated in Figure 3. Thus, the VMU monitors the energy flow at each in- stant in time, and also records historical data to avoid electrical overloads and excessive efficiency derating. An additional setting provides that during any braking recovery phase the turbo-gas sets are switched off. In case of a “dead” battery (SOC < 0.6), the requested power is supplied only by the two GT groups. As men- tioned above, the auxiliary storage unit absorbs the power that the batteries are not able to store during the braking recovery. The logic calculates the recovered power input and maximum permissible power of the bat- tery package, and directs the excess power, if any, to the auxiliary storage unit. The VMU designates the auxiliary storage unit as the primary source of power supply mak- ing this device as dynamic storage unit with very low inertia (i.e. short response time). This component, as well as the GT sets are not allowed to supply energy during braking. The auxiliary storage unit supplies power to the electric motors during any acceleration or driving at con- stant speed, and is also used to recharge the battery if the vehicle is stopped. Whenever the power is supplied by the auxiliary storage unit, a balance of its residual energy, of SOC and the maximum power that the batteries can absorb is also performed. In case of the SOC increase, another test called Forced Battery Charge (FBC), verifies if this recharging operation is a result of deceleration or forced recharge. This test is necessary to avoid continu- ous recharging of the battery. Without this control, the turbo-generators would supply current even if the SOC is increasing, producing an oscillation of the SOC around the SOCMAX. This condition must be avoided, because it might induce repeated and useless GT ignitions that would decrease the expected GT life and increase fuel consumption. 6.2. Logic B The basic concept of the “Logic B” is that the auxiliary storage unit is designed not only to improve the braking energy recovery but also to buffer the GT power output. Figure 4 shows that there is a range PGEN2,min-PGEN1,max , when both GT are off and the traction is only electric regardless of the actual on-the-road driving conditions. This “gap” is reduced if the auxiliary storage unit ab- sorbs the excess power PGEN2,min-PGEN1,max and GT2 de- livers PGEN2min. Besides increasing the flexibility of the traction system, the adoption of Logic B allows the de- signer more freedom in the selection of GT1, which is no longer dictated by the condition PGEN1min = Pbt, max, in (at SOC=80%). The turbogas will be switched “off” (idling conditions) either when the maximum capacity of the auxiliary storage unit (EAUXmax) has been reached, or when it is sufficient for a complete battery recharge (Figure 4). 7. System Simulation Several numerical tests have been carried out to compute the vehicle performance, in two different driving mis- sions: a combination of 10 consecutive urban cycles ECE15* and a “complex driving mission” composed of 4 consecutive extra-urban cycles EUDC* and 72 minutes of continuous highway drive at 120 km/hr. Each mission has been simulated for each of the two concept cars studied here: a “city-car” and a standard passenger sedan. The simulation computes the power balance on the basis of the imposed wheel speed and vehicle characteristics [1,2], and determines the power supplied by each system P GEN 1 ,min P GEN 1 ,ma x P GEN 2 ,min P GEN 2 ,ma x GT On GT OffOperational Power Range P GEN 1 ,min P GEN 1 ,ma x P GEN 2 ,min P GEN 2 ,ma x GT On GT OffOperational Power Range Figure 3. Operational power range of the traction system under Logic A. Operational Power Range P GEN1 , min P GEN1 , max P GEN2,min P GEN2 , max GT Off GT On Operational Power Range P GEN1 , min P GEN1 , max P GEN2,min P GEN2 , max GT Off GT On *EEC Directive 90/C81/01: this is a series of Regulations that pre- scribe both the emissions limits (adjusted every year) and the methods for testing and qualifying passenger and commercial vehicles. The test driving are in one urban cycle (European Cycle Emission) and an extra urban driving mission (Extra Urban Driving Cycle) Figure 4. Operational power range of the traction system with the Logic B. Copyright © 2011 SciRes. JTTS  89 R. CAPATA. component. This process is repeated with a 1 s interval, assuming that within every time interval, the power, the speed, and all other significant parameters remain con- stant. As mentioned above, the GT set is switched on when the SOC is lower than a set point (0.6), and switches to idling or partial load mode when the SOC reaches the maximum set point (0.8). In real operation, a manual override must also be provided, but this was not considered in the calculations. The GT load management protocol is based on the assumption that the GT sets can operate, without substantial efficiency loss, between 70% and 110% of their nominal power. Each simulation, con- sists of assigning first the number of modules in the bat- tery package, then the installed power, and finally the GT power: these three values must satisfy the limitations imposed by the abovementioned criteria of maximum power demand and maximum absorbable battery power [6]. The GT nameplate power was adjusted by iteration until the minimal fuel consumption was obtained. This heuristic procedure was also iterated by increasing the number of battery modules, with a consequent correction of the total vehicle weight. The vehicle design specifica- tions (Table 2 ) are the same as those adopted in previous papers [1,5,6]. 7.1. The power management protocol In the final model, the load following operation mode was selected [1]. This selection brings two significant advantages with respect to a simple on/off GT operation: a) maintaining the GT within a sufficiently flat portion of the efficiency/load diagram; b) it allows for a “gentler” modulation of the charging and discharging of the battery by decreasing the slope of the current/time charging curve and thus increasing battery life. The logic of this “load following” GT management can be described as follows: 1) The energy flows (GT-to-battery; brake-to-battery; battery-to-motor; GT-to-motor) must be exactly bal- anced at each in time instant; 2) The battery SOC is allowed to vary only between 0.6 (below which the GT is turned on to recharge the battery, irrespective of the vehicle power demand) and 0.9 (above which the GT is turned off, irrespec- tive of the vehicle power demand). 3) In the SOC range between 0.6 and 0.9, the GT is modulated to provide the battery with the exact amount of instantaneous power extracted from the battery by the motor. The logic matrix is shown in Table 3. 8. Results of the Simulations Eight different computer simulations have been per- formed (2 types of mission respectively simulated with 2 types of logic, and 2 types of battery recharge limit BRL).(Figure 5) The choice of the optimal configurations, within those several simulations, is a heuristic balance between the relative advantages and drawbacks of the following pa- rameters: Table 2. GT Hybrid Vehicle (GTHV) Design Specifications. Wheel rolling radius R = 0.265 m Vehicle width b = 1.7 m Vehicle height H = 1.4 m Net front area Sf = 2.142 m2 Area ratio (Sf/Stot) = 0.9 Aerodynamic drag coefficient cx = 0.25 Tire rolling friction coefficient fr = 0.015 Vehicle mass m = 1200 kg Equivalent mass me = 1240 kg Air density = 1.18 kg/m3 Air intake temperature T = 300 K Minimum SOC 0.6 Maximum SOC 0.8 Table 3. LOGIC table for the GT “load following” mode. Soc, % (Pv – Pbt)/PGTnom GT load factor, % (= PGT/PGTnom) < 0.6 100 > 0.8 0 0.6 SOC 0.8 < 0 0 (Pv – Pbt)/PGTnom 0.7 0.7 (Pv – Pbt)/PGTnom 1.1 (Pv – Pbt)/PGTN > 1.1 0 0.7 (Pv – Pbt)/PGTnom 1.1 BRL C Logic A BRL 2C Urban cycle BRL C Logic B BRL 2C BRL C LogicA BRL 2C Complex mission BRL C Logic B BRL 2C BRL C Logic A BRL 2C Urban cycle BRL C Logic B BRL 2C BRL C LogicA BRL 2C Complex mission BRL C Logic B BRL 2C Figure 5. Scheme of the performed simulations Copyright © 2011 SciRes. JTTS  R. CAPATA. Copyright © 2011 SciRes. JTTS 90 barycentre on the central vehicle plane; when this is not possible, the elements that can be housed more freely, such as the inverter and the flywheel, that are positioned on the side opposite the driver, in order to partly balance the weight if the driver is alone in the vehicle and to leave the required space for the steering wheel and ped- als. The components were also positioned taking into account the size of the air vents and the exhaust pipes. Finally, although safety was not an issue involved in this work, the battery pack was placed on the main frame, under the rear seats, in order to respect “crash protect- tion” conditions and to be easily accessed for mainte- nance or battery-pack replacement. Total gross weight of the battery package; SOC trend during the mission; Number of GT ignitions during the mission; Instantaneous coverage of the total demand power of the vehicle; Size of the several devices (GT, battery package, flywheel) 9. Components Distribution The distribution of the components has been studied on the frame of an Audi A2 (Figure 6, Figure 7, Figure 8). The frame was rebuilt, once its structure [7] and sizes were known (Table 4), using the SOLID EDGE@ pro- gramme and was used to check the size of the compo- nents for the chosen configurations. Of these configure- tions, a version with a traditional motor (LETHE@ City car or LETHE@ Sedan [3,4,5]) which power to the front wheels (another configuration, named “packaged” was also studied, with a motor-wheel directly housed in the rear wheels) will be shown. When positioning the rotat- ing parts, the respective gyroscopic movements were considered, although they generally appear to be less important than the one due to wheels. However, it is necessary to consider the fact that a mass rotating around a vertical axis can link rolling and pitching, while a ro- tating mass around a longitudinal axis can coupled the pitch to the yaw. All these situations have to be avoided [8]. For this reason, all the rotating parts are placed with a rotation axis that is parallel to the wheel axis, whose gyroscopic effect can be contrasted by appropriate bal- ancing of suspensions. The components have been ar- ranged while trying to maintain the traction system 10. LETHE@ Sedan The weights and overall dimensions of the components are summarised in Table 5. The weight of the battery pack is 150 kg (10 modules) that are positioned under- neath the rear seats. The gas tank is placed in the rear section while all the other components are housed in the front section (Figures 6 and 7). This distribution gives an overall weight of 181 kg on the fore-carriage and 187 kg on the rear carriage (Figure 8). I n spite of the pres- ence of the second GT unit, all the parts can still be comfortably installed in the area available under the Audi A2 bonnet. The two turbo-gas units were placed centrally and staggered in order to leave enough space for the air vents and the various connection pipes. The weights were equally distributed on the two wheel axles. In spite of the fact that the parts were closer than in the previous solutions, the motor area is still easily accessed and ventilated. Figure 6. Components distribution for the LETHE@ Sedan configuration.  91 R. CAPATA. Figure 7. Views and main dimensions (in mm) of the LETHE@ Sedan configuration. Table 4. Components dimensions. COMPONENT A B C Gas Turbine 130 mm 500 mm 130 mm Electric motor 205 mm 170 mm 205 mm Regenarator 120 mm 400 mm 130 mm Battery package (city car) 600 mm 500 mm 170 mm Battery package (sedan) 340 mm 1000 mm 170 mm Copyright © 2011 SciRes. JTTS  R. CAPATA. Copyright © 2011 SciRes. JTTS 92 181 kg187 kg Figure 8. Weights distribution in the LETHE@ Sedan configuration. In the following tables (Table 6, 7, 8, 9), it is possible to analyze some comparison with actual vehicle fleet (city car, passenger sedan and transporters) Table 6. Calculated emissions for typical vehicles fleet [9]. NOx, g/km CO2, g/km Particulate PM10, g/km Gasoline ICE vehicles 0.06 102 n.a. Diesel ICE vehicles 0.20 99.6 0.021 Transporters 3.5 129 0.02 Table 7. EURO 6 normative [9]. Normative NOX [g/km] HC [g/km] CO [g/km] PM [g/km] EURO 6 (2013) 0.02 n.a. 0.15 0.01 Table 8. Levels totals of emission of champion fleet com- posed by 500 gasoline ICE vehicles, 500 diesel ICE vehicles, 500 Diesel transporters. Specific emissions for distances: 10000-30000 km/year for the ICE vehicle and 50000 km/year for the transporters. Total Emis- sions NOx, kg/year CO2, t/year Particulate PM10, kg/year Gasoline ICE vehicles 300 510 n.a. Diesel ICE vehicles 1000 498 105 Transporters 87500 3225 500 Table 9. Total emissions of a fleet composed by 500 gasoline cars, cars, 500 diesels engine and 500 transporters with annual distance respectively of 10000 km - 30000 km (for cars) and 50000 km (for transporters) and the comparison with composed Lethe® fleet by 500 city cars (distance 10000 km), 500 Lethe-transporters (distance 50000 km) and 500 Lethe-passenger sedans (distance 30000 km). COMMERCIAL FLEET Total Emissions NOx, kg/year CO2, t/year Particulate PM10, kg/year Gasoline ICE vehicles 300 510 n.a. Diesel ICE vehicles 1000 498 105 Transporters 87500 3225 500 TOTAL EMISSIONS88800 4223 605 LETHE® Total Emissions NOx, kg/year CO2, t/year Particulate PM10, kg/year City Cars 30.9 375 450 Sedan 180 451 135 Transporters 12500 2625 100 TOTAL EMISSIONS12530 3000 635  93 R. CAPATA. Table 10. Lethe@ Sedan data in detail. Consumption [km/l] [l/100 km] [g/kWh] 28 3.5 Pollutants emissions Comparison with EURO 5 directive [g/kWh] [g/km] NOx 0.0680 0.0120 –80% HC 0.1099 0.0194 –80% CO 0.1072 0.0190 –90% PM 0.0011 0.0002 –90% 11. Conclusions The energy flows management logic (VMU) for a gas-turbine-driven hybrid propulsion system has been described in detail. It provides proper operational mode in all driving conditions. The application to possible con- figurations has been studied, the configurations being characterized by the presence or absence of the dynamic storage unit (the flywheel) and by different recharge modes of batteries. All simulations confirm that the LETHE vehicle is a competitive solution with respect to traditional I.C.E. vehicles and also to other standard hy- brid vehicles: the fuel efficiency is (at moment we use Methane or GPL fuel) is 29 km/l for urban cycles and over 18 km/l for complex missions (compared respec- tively on 20 km/l and 25 km/l for actual diesel vehicle, and 16 km/l and 22 km/l for gasoline sedan), since dur- ing highway operation the car is constantly at high speed and the absence of braking doesn’t allow for the energy recovery. Through a preliminary series of tests, it was possible to identify an optimal configuration for both types of mission. For a city car, the optimal performance is combination of 75 kg battery pack and two 5 kW GT, managed by Logic B+2C, while for the passenger sedan the best performance was provided by a combination of a 150 kg battery pack and two GT sets, rated 10 and 15 kW respectively. It is, therefore, clear that we are not talking about a complete “revolution” in the concept of cars as we know it today, but about a simple reorganisa- tion of the components. The most important innovation in this project are the advantages offered by a GT device in replacement of the traditional thermal motor (ICE).Advantages that can be summed up in terms of weight, size and the opportunity of utilization of a multi-fuel motor that can work with all types of fuel that are currently available on the market, thus reducing the economic effects of price fluctuations for the various types of fuel. By returning to all the analyses carried out in this article, we can summarise everything in the Table 10 below, which shows the consumption and emissions of a hybridised vehicle according to the described pro- cedure. The table contains data obtained by previous simulations and various assumptions and calculations made [1-5]. It remarks a fuel consumption reductions of about 30%, for a hybrid city car powered by methane compared to current commercial production. With re- gards to emissions, we have highlighted the drastic re- duction in all the main pollutants emitted from the motor compared to the values permitted by the current rules, made possible due to optimisation of fuel for a thermal motor that operates at a nominal point. The HS configu- ration makes the use of GT device possible. We have been proposing hybridisation studies for commercial vehicles applied to cargo and passenger transport for several years, studies that have involved trains, trucks and cars and that have emphasised the feasibility of such conversions in both energy and economic terms. In a global context of reduction: greenhouse gas emissions, consumption of fossil fuels, of city pollution, it is clear that the benefits introduced by the HS vehicle would provide an immediate reply to the most mandatory envi- ronmental subjects. 12. References [1] R. Capata, E. Cioffarelli and E. Sciubba, “A Gas Tur- bine-Based Hybrid Vehicle-Part II: Technological and Configuration Issues,” Journal of Engineering for Gas Turbines and Power, Vol. 125, No. 2, July 2003, pp. 777-782. [2] R. Capata and E. Sciubba, “An Innovative Solution for Suburban Railroad Transportation: The Gas Turbine Hy- brid Train,” International Journal of Thermodynamics, Vol. 8, No. 1, March 2005, pp. 55-66. [3] R. Capata and E. Sciubba, “The Concept of the Gas Tur- bine-Based Hybrid Vehicle: System, Design and Con- figuration Issues,” International Journal of Environ- mental Research, Vol. 30, 2006, pp. 671-684. doi:10.1002/er.1178 [4] R. Capata and A. Coccia, “Procedure for the Design of a Hybrid-Series Vehicle at UDR1 and the Hybridization Degree Choice,” Energies, Vol. 3, 2010, pp. 450-461. doi:10.3390/en3030450 [5] R. Capata and M. Lora, “The Comparative Assessment and Selection of an “Optimal” Configuration for a Gas Turbine-Based Hybrid City Car,” Journal of Engineering for Gas Turbines and Power, Vol. 129, No. 2, 2008, pp. 107-117. [6] E. Cioffarelli and E Sciubba, “A New Type of Gas Tur- bine Based-Hybrid Propulsion System-Part I: Concept Development, Definition of Mission Parameters and Pre- liminary Sizing,” Proceedings of AES/ASME Winter Meeting,” Orlando FL, 2000. [7] Audi site, 2011 http://www.audi-club.dk. [8] G. Pede, ENEA (National Agency of Energy and Envi- ronment), Personal Communication, 2009. [9] Automobile Club Italy, 2011 http://www.aci.it. Copyright © 2011 SciRes. JTTS
|