 Vol.3, No.10, 827-836 (2011) Natural Science http://dx.doi.org/10.4236/ns.2011.310108 Copyright © 2011 SciRes. OPEN ACCESS Energy and mass changes of the Eurasian permafrost regions by multi-satellite and in-situ measurements Reginald R. Muskett*, Vladimir E. Romanovsky Geophysical Institute, University of Alaska Fairbanks, Alaska, USA; *Corresponding Author: rmuskett@gi.alaska.edu Received 13 September 2011, revised 12 October 2011; accepted 30 October 2011. ABSTRACT We investigate changes in total water equivalent mass, land-surface temperature and atmospheric CO2 by satellite-based measurements from Au- gust 2002 through December 2008. Our region of interest spans 75˚ to 165˚E and 50˚ to 80˚N centered on the Lena River watershed as a phy- sical reference frame. We find energy and mass changes on the continuous and discontinuous permafrost zones indicating: 1) Arctic uplands such as the Siberian Plateau show strongly posi- tive water equivalent mass and strongly nega- tive land-surface temperature gradients during May months. 2) Arctic lowlands such as the thaw-lake regions of Kolyma, Lena Delta, and Taymyr show strongly negative water equivalent mass and strongly positive land-surface tem- perature gradients during September months. 3) Areas with strongly positive water equivalent mass and negative land-surface temperature gradients during May months have weakly posi- tive CO2 gradients 4) Areas with strongly nega- tive water equivalent mass and strongly positive land-surface temperature gradients during Sep- tember months have strongly positive CO2 gra- dients. This indicates that continuous and dis- continuous permafrost ecosystem responses are correlated in phase with energy and mass changes over the period. The Laptev and East Siberia Sea have increasing trends of CO2 at- mosphere concentration 2.23 ± 0.15 ppm/yr and 2.40 ± 0.21 ppm/yr, respectively. Increasing trends and strong positive gradients of CO2 atmosphere concentration during Aprils-Mays are evidence that the Arctic Ocean is a strong emitter of CO2 during springtime lead formation. We hypnotize that the increasing CO2 from land and ocean regions is from permafrost thawing and degra- dation and ecosystem microbial activity. Keywords: Permafrost; GRACE; MODIS; AIRS 1. INTRODUCTION Land- and ocean-surfaces form a fundamental physi- cal boundary of the Earth [1]. Land-surface temperature is a key variable of this physical boundary where ther- modynamic and biophysical processes interact at local and regional scales that influence changes of the Earth’s climate system [2,3]. Drivers of the Earth’s climate sys- tem include obliquity, eccentricity, precession, variations of solar radiation and plate tectonics on long time scale [2]. Shorter-term drivers at centennial, decadal and inter- annual scales are the focus of many investigations [2]. Processes acting on decadal and interannual scale in- clude energy and water cycles, soil-atmosphere micro- meteorology, evaporation, evapotranspiration, cloudiness, aerosol chemistry, albedo and ecosystem vitality and phenology [4]. In the terrestrial northern high latitudes land-surface temperature changes form the connecting parameter for warming and degradation of permafrost, development and expansion of taliks, and the mobility and exchange of groundwater that are driven by climate change [5-7]. Our region of interest is the northern high-latitudes with attention to the ecosystems, permafrost zones, wa- tersheds and wetlands from 50˚ to 80˚N and 75˚ to 165˚E, Figure 1. Within this region the Lena River and neigh- boring watersheds provide a physical reference frame to evaluate energy and mass transfers. The Lena is the east most of the three great Siberia rivers with the Yenisei and Ob’. The continuous permafrost zone mostly under- lies the Lena and Yenisei River watersheds. The discon- tinuous zone underlies their upper-southern parts at the latitude of Lake Baikal (Lena). The central and northern parts of the region are well noted for permafrost wet- lands and thaw-lakes in central Yakutia, Taymyr Penin- sula and Kolyma River areas. It is one of the regions of the thick sub-surface ice- and carbon-rich deposits known as Yedoma. Our recent investigations of the northern hemisphere permafrost watersheds have revealed diversity of the  R. R. Muskett et al. / Natural Science 3 (2011) 827-836 Copyright © 2011 SciRes. OPEN ACCESS 828 character of water mass changes [6,7]. The eastern Sibe- ria watersheds show increasing runoff and groundwater storage while regionally averaged winter snow-load shows no trend. In western North America the Mackenzie River and Yukon River watersheds, mostly underlain by the discontinuous permafrost zone show no trend in runoff, yet show trends of decreasing groundwater storage and increasing regionally averaged winter snow-load. These changes in water loads continue from the period of 2002 through 2008. Using measurements from a multi-satellite sensor suite we will frame our investigation toward surface en- ergy and mass transfers. This will aid investigations of energy balance on Earth’s land-surfaces and physical processes which draw from the balance and feedbacks, both negative and positive, with drivers of solar energy input and its feedbacks with atmosphere and vegetation and anthropogenic modification. The thermal state of the land-surface is the boundary condition for changes of active layer, permafrost and talik that are coupled with climate changes [5]. Water is a fundamental substance on Earth which through its heat capacity can re-distribute energy through the atmosphere and ocean, on the land-surface and within the sub-sur- face [2]. Recent studies have brought to light that the carbon storage of Earth’s permafrost zones exceeds by twice the troposphere load [8]. Thermokarst and perma- frost degradation processes associated with thaw-lakes in the permafrost zones have been identified as emitters of methane [9]. Carbon storage is vulnerable to changes in ecosystem, hydrogeology, and land-surface characteris- tics from climate change [10]. Our investigation seeks to elucidate the coupling of land-surface temperature with near-surface water and atmospheric CO2 mass changes relative to permafrost and terrain setting. 2. SOURCE DATA Our source data for changes of surface energy and mass come from 1) the Moderate Resolution Imaging Spectroradiometer (MODIS) on NASA-Terra satellite daily land-surface temperature, 2) the Gravity Recovery and Climate Experiment (GRACE) mission for water equivalent mass and 3) the Atmospheric InfraRed Sounder (AIRS) (includes the Atmospheric Microwave Sounding Unit) onboard NASA-Aqua for tropospheric CO2. Our source topography data including river and lake elevation is the ESA funded Altimetry Corrected Elevation version 2 Digital Elevation Model (ACE2 DEM) [11]. This model is derived from the Shuttle Ra- dar Topography Mission DEM (finished) and ESA multi- mission satellite radar altimetry (ESA ERS-1&2 and Envisat) [12]. We use the 15-degree tiles, 3-arc second posting, reference in the EGM96 WGS84 system, con- sistent with the International Terrestrial Reference Frame 2005. 2.1. Modis We re-project the grid to be consistent with the inter- national terrestrial reference frame of the GRACE data. Land-surface temperature in Kelvin is derived by algo- rithm using clear-sky day/night thermal emission and emissivity in the 10.78 to 11.28 μm and 11.77 to 12.27 μm bands. Input data derive from the L1B Level 2 swath product using cloud-cover detection routines with cor- rections for atmosphere column water vapor and bound- ary level temperatures and off-zenith-angle pointing [13]. We use only those temperatures with the highest quality flag. The accuracy of the MODIS land-surface tempera- tures is at 1-Kelvin [14,15]. Trends of MODIS (Aqua and Terra sensors) land-surface temperatures show high correlations with near-ground derived air temperatures and sub-surface derived (3 to 5 cm) soil temperatures [16]. 2.2. Grace The joint US-German (National Aeronautics and Space Administration—Deutsches GeoForschungsZentrum) Gravity Recovery and Climate Experiment provide nominal-monthly near-surface water equivalent mass changes [17]. The tandem satellites measure variations in gravity/mass through changes of the inter-satellite range and range rate from an initial orbit altitude of 485 kilometers, in a controlled free-fall (down to about 200 km) non-repeating ground track mode. The mass changes Figure 1. Eurasia centered on the Lena River watershed (white line extent). Permafrost zones are represented by extent lines: the continuous zone (red) and the combined discontinuous and sporadic zones (yellow). Permafrost thaw-lake regions of Kolyma, Lena Delta and Taymyr are identified.  R. R. Muskett et al. / Natural Science 3 (2011) 827-836 Copyright © 2011 SciRes. OPEN ACCESS 829 829 are coupled to high accuracy onboard GPS and star- tracking instruments to reference them to the Interna- tional Terrestrial Reference Frame 2005. Data for water equivalent mass change comes from Release-04 (R4) Level-3 products provided by the GRACE Science Team centers. Grids are produced at 1-arc-de- gree global coverage complete to degree and order 40. The GRACE solution to the gravity potential formulated as an equivalent water mass change (length scale) is given by 40 00 (2 1) ,, sin 1 l llm lm lm l l htWP f k (1) with 3 ee w a (2) 2 exp 4ln2 e l lra W (3) cos sin lm lmlm CtmSt m (4) and coefficients Plm: Normalized Legendre polynomials, ΔClm(t), and ΔSlm(t): Normalized time-varying Stokes spherical harmonic geopotential coefficients, ae—Earth mean radius, r—spatial radius, kl—Love numbers, ρe— Earth mean density, ρw—water density, t—time, and , are latitude and longitude [17]. Beyond degree (order) 40 to 70, the inherent noise level in the mass change signal becomes significant [18]. Processing includes downward propagation and adjustments to remove the time-variable mass change effects from tides and at- mosphere and mean variation (GRACE geoid model). A normalized Gaussian smoother filter mitigates striping artifacts produced by the orbit non-crossing and con- trol-descent geometry [17,18]. Differences in processing (de-aliasing) and error sources and products are attrib- utable to differences in assumed zero-degree and order Stokes harmonics, tide (liquid and solid) models and the modeled atmosphere mass change removal, respectively in decreasing order of magnitude [19,20]. GRACE global coverage in our investigation is from August 2002 through December 2008. Glacial isostatic adjustment (GIA) is a global phenomenon by way of mantle flow following the decay of the Pleistocene ice sheets in North America and Euro-Scandinavia [21]. We remove modeled GIA from the GRACE grids [22]. 2.3. Airs CO2 free-troposphere measurements (concentration in parts per million) derive from the Atmospheric InfraRed Sounder onboard the NASA-Aqua [23,24]. The Level 3 data are in the form of monthly near-global grids, 60˚S to 90˚N, from October 2002. Grid spacing is 2 degrees latitude by 2.5 degrees longitude. Daytime and nighttime CO2 concentrations are derived from a suite of spectral channels with 15 m bandwidth and peak sensitivities at about 450 hPa with accuracy better than 2 parts per mil- lion [25]. Validations have been accomplished using ground-based upward viewing spectroradiometers, air- craft-based spectro-radiometers, model simulations and with other satellite sensor comparisons [24,25]. AIRS has proven capability to measure both mid-troposphere transport and surface sources of CO2 of natural and an- thropogenic origin [25,26]. The time series data from satellite-derived snow water equivalent and in-situ gauge station runoff are explained in Muskett and Romanoky [5,6]. We introduce a new time series of bias-corrected gauge precipitation from Yang et al. [27]. Corrections to the precipitation data include trace events, losses from wetting and evapora- tion, and wind induced errors (under catch) using a common reference gauge (World Meteorological Or- ganization) from more than 350 stations in our region of interest Figure 1 and the Lena and Yenisei River water- sheds which average 290. The Yang et al. [27] data set spans 1973 through 2004. We utilize data from August 1998 through December 2004. 3. METHODOLODY Our mathematical basis derives from Linear & Non- Linear Algebras of Hilbert Space applied to the Gener- alized Inverse and Potential Theory [28]. We use this methodology to derive regional trends, gradients, error estimates and statistical significance drawing from other works of applied statistics theory [29,30]. On the MODIS, GRACE and AIRS datasets we apply the Sandwell biharmonic method with Greens Functions zero-curvature constraint to produce global grids at 0.2-degree (about 22-km) spatial resolution [31,32]. This method is useful for MODIS products to mitigate cloud- voids. The MODIS grids remain at daily temporal reso- lution and the GRACE and AIRS grids remain at monthly temporal resolution. Statistical evaluation tests are per- formed to monitor validity of the resultant grids. The Sandwell biharmonic method was first applied to derive detailed and accurate geoid maps from GOES-3 and SEASAT altimetry data by mitigation of the error sources [31,32]. Reference [33] extended this method to include a tension parameter to suppress spline overshoots in areas of sharp gradients and [34] made further re- finements to generalize the technique to other geophysi- cal applications. Tests of this method on MODIS MOD- 11A1 daily 1-km land-surface temperature data on Eura- sia, Figure 2 and Table 1, show satisfactory results with  R. R. Muskett et al. / Natural Science 3 (2011) 827-836 Copyright © 2011 SciRes. OPEN ACCESS 830 P-values better than the level of 0.05 (95% significant). Figure 2 top plots show the change in land-surface tem- peratures, daily 1-km resolution, from 1 to 31 May 2008 (Figure 2) and from 1 to 30 September 2008 (Figure 2). The gray-regions are cloud-voids, i.e. no data. Figure 2 bottom plots show the results of filling the cloud-void regions by the Sandwell biharmonic method. 4. RESULTS AND DSCUSSION 4.1. Timeseries Our ongoing investigation builds on research applying methods of satellite geodesy to issues of water equiva- lent storage changes and their sources in the permafrost watersheds of the northern hemisphere [6,7]. Monthly time series of regionalized water equivalent mass chan- ges and least squares trends are illustrated in Figure 3. GRACE (Figure 3(A)) exhibits total water equivalent storage change from surface and sub-surface sources in the Lena and Yenisei River watershed regions. Least squares trends (black lines) whose p-values correspond to significance at 95% illustrate the seasonal extremes during Mays (water mass loading) and Septembers (wa- ter mass unloading). These parallel the least squares trend over all months (gold). All indicate substantially Table 1. Comparison of MOD11A1 derived mean temperature changes before and after interpolation with the Sandwell bi- harmonic method. May 2008 September 2008 Original +7.98˚C ± 4.90˚C –5.63˚C ± 3.80˚C Interpolation +7.46˚C ± 5.75˚C –5.69˚C ± 4.59˚C Figure 2. Land-surface temperature changes during May 2008 and September 2008. Top plots show cloud-void areas (grey) and bottom plots show cloud-oids filled by Sandwell biharmonic spline interpolation method. 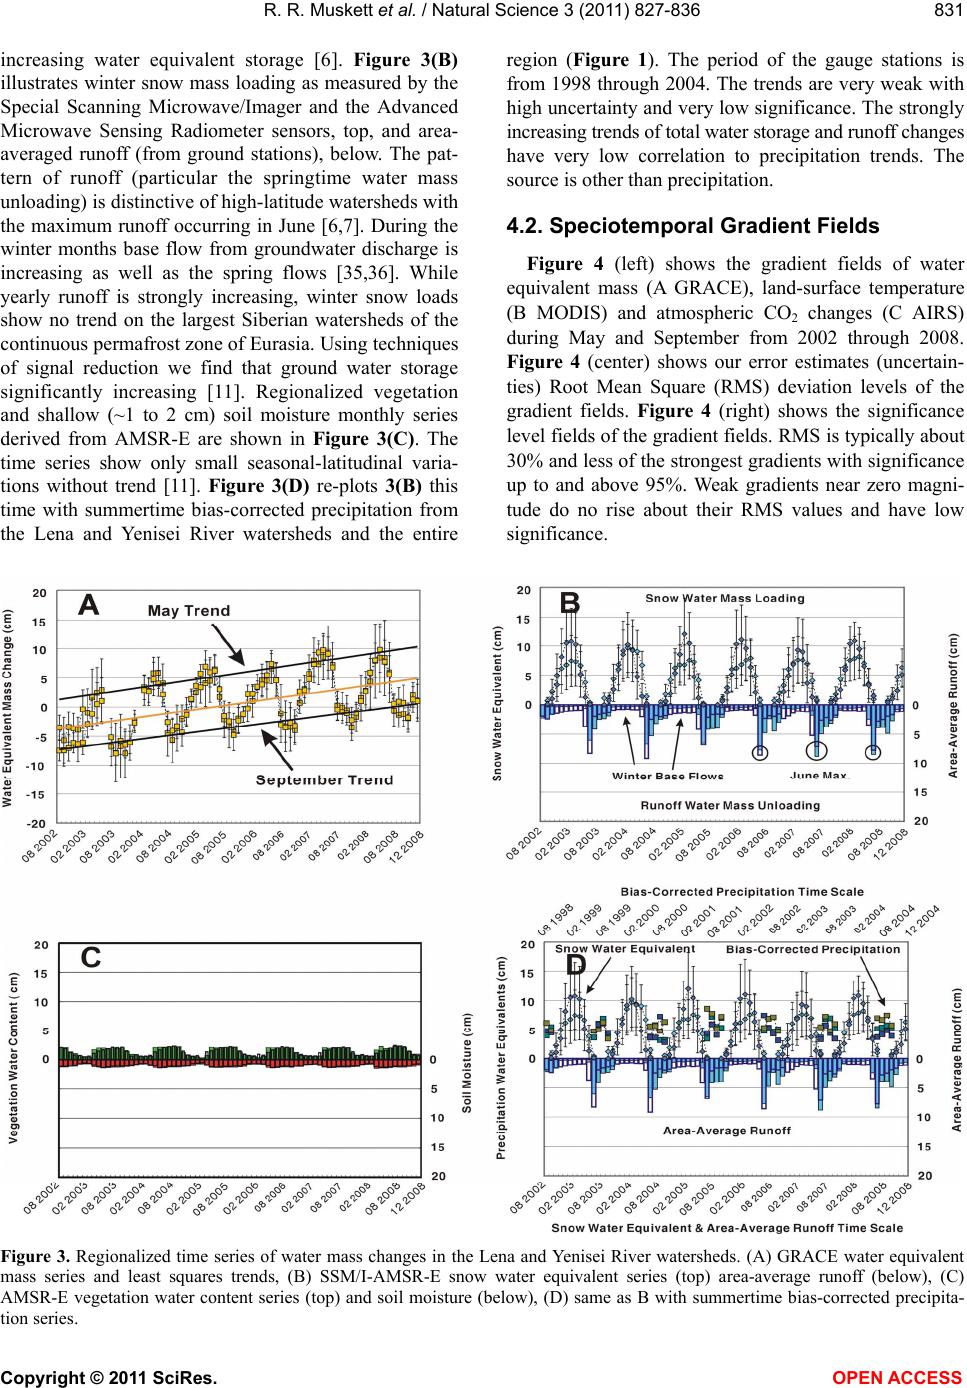 R. R. Muskett et al. / Natural Science 3 (2011) 827-836 Copyright © 2011 SciRes. OPEN ACCESS 831 831 increasing water equivalent storage [6]. Figure 3(B) illustrates winter snow mass loading as measured by the Special Scanning Microwave/Imager and the Advanced Microwave Sensing Radiometer sensors, top, and area- averaged runoff (from ground stations), below. The pat- tern of runoff (particular the springtime water mass unloading) is distinctive of high-latitude watersheds with the maximum runoff occurring in June [6,7]. During the winter months base flow from groundwater discharge is increasing as well as the spring flows [35,36]. While yearly runoff is strongly increasing, winter snow loads show no trend on the largest Siberian watersheds of the continuous permafrost zone of Eurasia. Using techniques of signal reduction we find that ground water storage significantly increasing [11]. Regionalized vegetation and shallow (~1 to 2 cm) soil moisture monthly series derived from AMSR-E are shown in Figure 3(C). The time series show only small seasonal-latitudinal varia- tions without trend [11]. Figure 3(D) re-plots 3(B) this time with summertime bias-corrected precipitation from the Lena and Yenisei River watersheds and the entire region (Figure 1). The period of the gauge stations is from 1998 through 2004. The trends are very weak with high uncertainty and very low significance. The strongly increasing trends of total water storage and runoff changes have very low correlation to precipitation trends. The source is other than precipitation. 4.2. Speciotemporal Gradient Fields Figure 4 (left) shows the gradient fields of water equivalent mass (A GRACE), land-surface temperature (B MODIS) and atmospheric CO2 changes (C AIRS) during May and September from 2002 through 2008. Figure 4 (center) shows our error estimates (uncertain- ties) Root Mean Square (RMS) deviation levels of the gradient fields. Figure 4 (right) shows the significance level fields of the gradient fields. RMS is typically about 30% and less of the strongest gradients with significance up to and above 95%. Weak gradients near zero magni- tude do no rise about their RMS values and have low significance. Figure 3. Regionalized time series of water mass changes in the Lena and Yenisei River watersheds. (A) GRACE water equivalent mass series and least squares trends, (B) SSM/I-AMSR-E snow water equivalent series (top) area-average runoff (below), (C) AMSR-E vegetation water content series (top) and soil moisture (below), (D) same as B with summertime bias-corrected precipita- tion series. 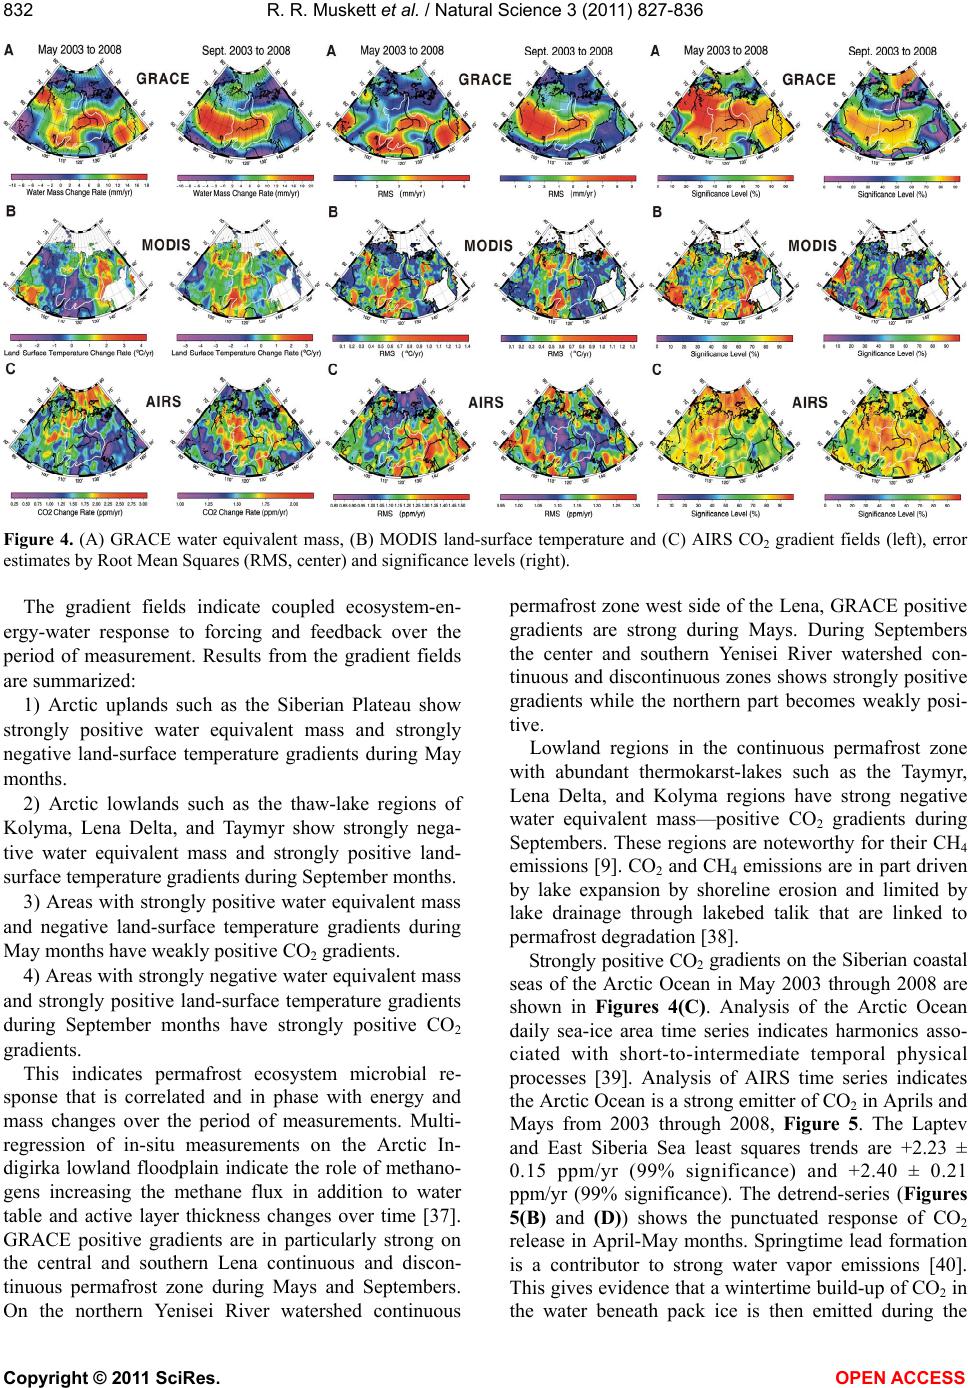 R. R. Muskett et al. / Natural Science 3 (2011) 827-836 Copyright © 2011 SciRes. OPEN ACCESS 832 Figure 4. (A) GRACE water equivalent mass, (B) MODIS land-surface temperature and (C) AIRS CO2 gradient fields (left), error estimates by Root Mean Squares (RMS, center) and significance levels (right). The gradient fields indicate coupled ecosystem-en- ergy-water response to forcing and feedback over the period of measurement. Results from the gradient fields are summarized: 1) Arctic uplands such as the Siberian Plateau show strongly positive water equivalent mass and strongly negative land-surface temperature gradients during May months. 2) Arctic lowlands such as the thaw-lake regions of Kolyma, Lena Delta, and Taymyr show strongly nega- tive water equivalent mass and strongly positive land- surface temperature gradients during September months. 3) Areas with strongly positive water equivalent mass and negative land-surface temperature gradients during May months have weakly positive CO2 gradients. 4) Areas with strongly negative water equivalent mass and strongly positive land-surface temperature gradients during September months have strongly positive CO2 gradients. This indicates permafrost ecosystem microbial re- sponse that is correlated and in phase with energy and mass changes over the period of measurements. Multi- regression of in-situ measurements on the Arctic In- digirka lowland floodplain indicate the role of methano- gens increasing the methane flux in addition to water table and active layer thickness changes over time [37]. GRACE positive gradients are in particularly strong on the central and southern Lena continuous and discon- tinuous permafrost zone during Mays and Septembers. On the northern Yenisei River watershed continuous permafrost zone west side of the Lena, GRACE positive gradients are strong during Mays. During Septembers the center and southern Yenisei River watershed con- tinuous and discontinuous zones shows strongly positive gradients while the northern part becomes weakly posi- tive. Lowland regions in the continuous permafrost zone with abundant thermokarst-lakes such as the Taymyr, Lena Delta, and Kolyma regions have strong negative water equivalent mass—positive CO2 gradients during Septembers. These regions are noteworthy for their CH4 emissions [9]. CO2 and CH4 emissions are in part driven by lake expansion by shoreline erosion and limited by lake drainage through lakebed talik that are linked to permafrost degradation [38]. Strongly positive CO2 gradients on the Siberian coastal seas of the Arctic Ocean in May 2003 through 2008 are shown in Figures 4(C). Analysis of the Arctic Ocean daily sea-ice area time series indicates harmonics asso- ciated with short-to-intermediate temporal physical processes [39]. Analysis of AIRS time series indicates the Arctic Ocean is a strong emitter of CO2 in Aprils and Mays from 2003 through 2008, Figure 5. The Laptev and East Siberia Sea least squares trends are +2.23 ± 0.15 ppm/yr (99% significance) and +2.40 ± 0.21 ppm/yr (99% significance). The detrend-series (Figures 5(B) and (D)) shows the punctuated response of CO2 release in April-May months. Springtime lead formation is a contributor to strong water vapor emissions [40]. This gives evidence that a wintertime build-up of CO2 in the water beneath pack ice is then emitted during the 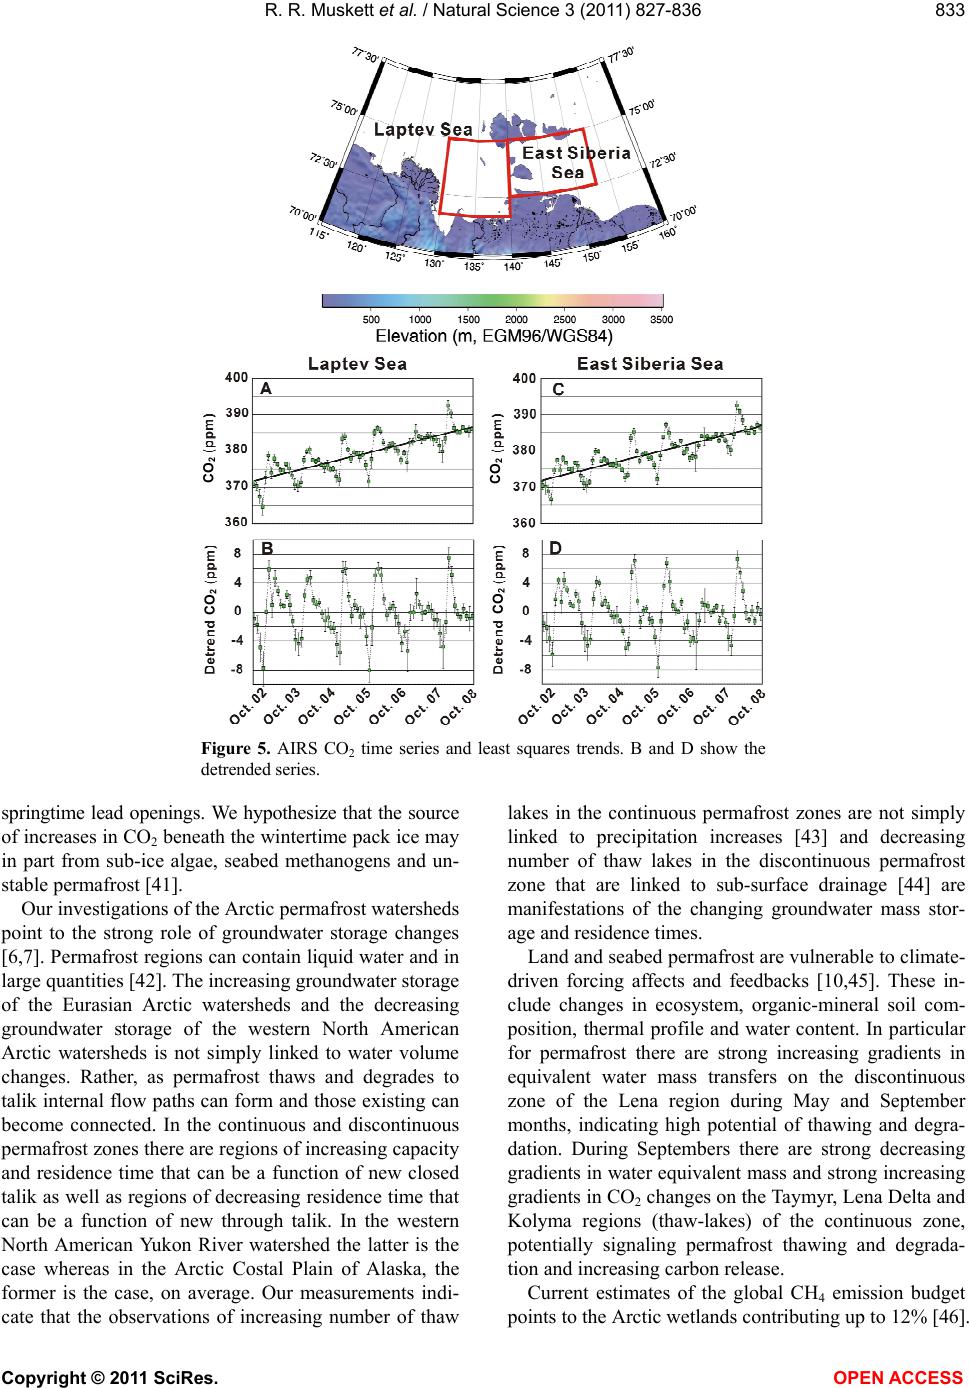 R. R. Muskett et al. / Natural Science 3 (2011) 827-836 Copyright © 2011 SciRes. OPEN ACCESS 833 833 CO 2 CO 2 CO 2 CO 2 Figure 5. AIRS CO2 time series and least squares trends. B and D show the detrended series. springtime lead openings. We hypothesize that the source of increases in CO2 beneath the wintertime pack ice may in part from sub-ice algae, seabed methanogens and un- stable permafrost [41]. Our investigations of the Arctic permafrost watersheds point to the strong role of groundwater storage changes [6,7]. Permafrost regions can contain liquid water and in large quantities [42]. The increasing groundwater storage of the Eurasian Arctic watersheds and the decreasing groundwater storage of the western North American Arctic watersheds is not simply linked to water volume changes. Rather, as permafrost thaws and degrades to talik internal flow paths can form and those existing can become connected. In the continuous and discontinuous permafrost zones there are regions of increasing capacity and residence time that can be a function of new closed talik as well as regions of decreasing residence time that can be a function of new through talik. In the western North American Yukon River watershed the latter is the case whereas in the Arctic Costal Plain of Alaska, the former is the case, on average. Our measurements indi- cate that the observations of increasing number of thaw lakes in the continuous permafrost zones are not simply linked to precipitation increases [43] and decreasing number of thaw lakes in the discontinuous permafrost zone that are linked to sub-surface drainage [44] are manifestations of the changing groundwater mass stor- age and residence times. Land and seabed permafrost are vulnerable to climate- driven forcing affects and feedbacks [10,45]. These in- clude changes in ecosystem, organic-mineral soil com- position, thermal profile and water content. In particular for permafrost there are strong increasing gradients in equivalent water mass transfers on the discontinuous zone of the Lena region during May and September months, indicating high potential of thawing and degra- dation. During Septembers there are strong decreasing gradients in water equivalent mass and strong increasing gradients in CO2 changes on the Taymyr, Lena Delta and Kolyma regions (thaw-lakes) of the continuous zone, potentially signaling permafrost thawing and degrada- tion and increasing carbon release. Current estimates of the global CH4 emission budget points to the Arctic wetlands contributing up to 12% [46].  R. R. Muskett et al. / Natural Science 3 (2011) 827-836 Copyright © 2011 SciRes. OPEN ACCESS 834 Arctic methanogenesis is keyed to thaw lake thermokarst and permafrost degradation processes [38]. We hypothe- size that increasing numbers of thaw lakes by permafrost thawing and degradation in the continuous permafrost zones will likely be a strong positive feedback in in- creasing CH4 emissions driven by climate warming that can offset the negative feedback of decreasing numbers of thaw lakes and reducing CH4 emissions in the discon- tinuous zone on an area average basis [44,46]. 5. CONCLUSIONS In this paper we present results from an investigation of multi-satellite sensors for measurements of near-sur- face energy and mass exchanges relative to land-surfaces of the northern hemisphere with a focus on the north- eastern Eurasian permafrost watersheds. The results of our investigation are: 1) Arctic uplands such as the Siberian Plateau show strongly positive water equivalent mass and strongly negative land-surface temperature gradients during May months. 2) Arctic lowlands such as the thaw-lake regions of Kolyma, Lena Delta, and Taymyr show strongly nega- tive water equivalent mass and strongly positive land- surface temperature gradients during September months. 3) Areas with strongly positive water equivalent mass and negative land-surface temperature gradients during May months have weakly positive CO2 gradients. 4) Areas with strongly negative water equivalent mass and strongly positive land-surface temperature gradients during September months have strongly positive CO2 gradients. This indicates permafrost ecosystem (microbial) re- sponse that is correlated and in phase with energy and mass changes over the period of measurements. Increasing trends of CO2 atmosphere concentration over the Laptev and East Siberia Sea and strong gradi- ents during Aprils-Mays from 2002 through 2008 are evidence that the Arctic Ocean is a strong emitter of CO2 during springtime lead formation. We hypnotize perma- frost thawing and degradation and ecosystem microbial activity are drivers of the CO2 changes. 6. ACKNOWLEDGEMENTS This work was funded through supporting grants from NASA (NN- OG6M48G), the National Science Foundation (NSF) ARC0632400, ARC-0612533, and ARC0856864 projects, Alaska EPSCoR NSF award #EPS-0701898 and the State of Alaska. The Alaska Region Supercomputing Center is thanked for computing facilities support. NASA and Deutsches GeoForschungsZentrum are thanked for the GRACE data. NASA Goddard Space Flight Center and the Jet Propul- sion Laboratory, Cal. Inst. of Technology are thanked for MODIS and AIRS data, respectively. Daqing Yang, University of Alaska Fairbanks is thanked for the northern hemisphere bias-corrected precipitation data. The Generic Mapping Tools were used in this research. REFERENCES [1] Saltzman, B. (1983) The theory of climate. Advances in geophysics 25. Academic Press, New York. [2] Flanner, M.G., Shell, K.M., Barlage, M., Perovich, D.K. and Tschudi, M.A. (2011) Radiative forcing and albedo feedback from the Northern Hemisphere cryosphere be- tween 1979 and 2008. Nature Geoscience, 4, 151-155. doi:10.1038/ngeo1062 [3] Kleidon, A. (2008) Entropy production by evapotranspi- ration and its geographic variation. Soil & Water Res- sources, 3, S89-S94. [4] Zhang, X., Friedl, A.M., Schaaf, B.C. and Strahler, A.H. (2004) Climate controls on vegetation phenological pat- terns in northern mid- and high latitudes inferred from MODIS data. Global Change Biology, 10, 1133-1145. doi:10.1111/j.1529-8817.2003.00784.x [5] Romanovsky, V.E., Drozdov, D.S., Oberman, N.G. Mal- kova, G.V., Kholodov, A.L., Marchenko, S.S., Moska- lenko, N.G., Sergeev, D.O., Ukraintseva, N.G., Abramov, A.A., Gilichinsky, D.A. and Vasiliev, A.A. (2010) Thermal state of permafrost in Russia. Permafrost & Periglacial Processes, 21, 136-155. doi:10.1002/ppp.683 [6] Muskett, R.R. and Romanovsky, V.E. (2009) Groundwa- ter storage changes in arctic permafrost watersheds from GRACE and in situ measurements. Environmental Re- search Letters, 4. [7] Muskett, R.R. and Romanovsky, V.E. (2011) Alaskan permafrost groundwater storage changes derived from GRACE and ground measurements. Remote Sensing Journal, 3, 378-397. doi:10.3390/rs3020378 [8] Schuur, E.A.G., Vogel, J.G., Crummer, K.G., Lee, H.L., James, O., Sickman, J.O. and Osterkamp, T.E. (2009) The effect of permafrost thaw on old carbon release and net carbon exchange from tundra. Nature, 459, 556-560. doi:10.1038/nature08031 [9] Walter, K.M., Edwards, M.E., Grosse, G., Zimov, S.A. and Chapin III, F.S. (2007) Thermokarst lakes as a source of atmospheric CH4 during the last deglaciation. Science, 318, 633-636. doi:10.1126/science.1142924 [10] Grosse, G., Marchenko, S., Romanovsky, V., Wickland, K.P., French, N., Waldrop, M., Bourgeau-Chavez, L., Striegl, R., Harden, J., Turetsky, M., McGuire, A.D., Camill, P., Tarnocai, C., Frolking, S., Schuur, E. and Jorgenson, T. (2011) Vulnerability of high latitude soil organic carbon in North America to disturbance. Journal Geophysical Research, 116, G00K06. doi:10.1029/2010JG001507 [11] Berry, P.A.M., Smith, R.G., Freeman, J.A. and Ben- veniste, J. (2008) Towards a new global digital elevation model. In: Sideris, M.G., Ed., Observing Our Changing Earth, 133, Part 2, International Association of Geodesy Symposia 2008, Springer-Verlag, Berlin, [12] Smith, R.G., Berry, P.A.M. and Benveniste, J. (2007) Representation of rivers and lakes within the forthcoming ACE2 Global Digital Elevation Model. In: ESA 2nd Space for Hydrology Workshop, Geneva, 12-14 Novem-  R. R. Muskett et al. / Natural Science 3 (2011) 827-836 Copyright © 2011 SciRes. OPEN ACCESS 835 835 ber 2007. [13] Wan, Z. (2008) New refinements and validation of MODIS land-surface temperature/emissivity products. Remote Sensing Environment, 112, 59-74. doi:10.1016/j.rse.2006.06.026 [14] Coll, C., Wan, Z. and Galve, G.M. (2009) Temperature- based and radiance-based validations of the V5 MODIS land surface temperature product. Journal Geophysical Research, 114, D20102. doi:10.1029/2009JD012038 [15] Wang, W., Liang, S. and Meyers, T. (2008) Validating MODIS land surface temperature products using long- term nighttime ground measurements. Remote Sensing Environment, 112, 623-635. doi:10.1016/j.rse.2007.05.024 [16] Hachem, S., Duguay, C.R. and Allard, M. (2011) Com- parison of MODIS-derived land surface temperatures with near-surface soil and air temperature measurements in the continuous permafrost terrain. The Cryosphere Discussions, 5, 1583-1625. doi:10.5194/tcd-5-1583-2011 [17] Wahr, J., Molenaar, M. and Bryan, F. (1998) Time vari- ability of the Earth’s gravity field: Hydrologic and oce- anic effects and their possible detection using GRACE. Journal Geophysical Research, 103, 30205-30229. doi:10.1029/98JB02844 [18] Tapley, B.D., Bettadpur, S., Watkins, M. and Reigber, C. (2004) The gravity recovery and climate experiment: Mission overview and early results. Geophysical Re- search Letters, 31, L09607. doi:10.1029/2004GL019920 [19] Quinn, K.J. and Ponte, R.M. (2010) Uncertainty in ocean mass trends from GRACE. Geophysics Journal Interna- tional, 181, 762-768. [20] Zenner, L., Gruber, T., Jäggi, A. and Beutler, G. (2010) Propagation of atmospheric model errors to gravity po- tential harmonics—Impact on GRACE de-aliasing. Geo- physics Journal International, 182, 797-807. doi:10.1111/j.1365-246X.2010.04669.x [21] Peltier, W.R. (2004) Global glacial isostasy and the sur- face of the Ice-Age Earth: The ICE-5G (VM2) model and GRACE. Annual Reviews Earth & Planetary Science, 32, 111-149. doi:10.1146/annurev.earth.32.082503.144359 [22] Paulson, A., Zhong, S. and Wahr, J. (2007) Inference of mantle viscosity from GRACE and relative sea level data. Geophysics. Journal International, 171, 497-508. doi:10.1111/j.1365-246X.2007.03556.x [23] Barkley, M.P., Monks, P.S. and Engelen, R.J. (2006) Comparison of SCIAMACHY and AIRS C02 measure- ments over North America during the summer and au- tumn of 2003. Geophysical Research Letters, 33, L20805. doi:10.1029/2006GL026807 [24] Xiong, X., Barnet, C., Maddy, E., Sweeney, C., Liu, X., Zhou, L. and Goldberg, M. (2008) Characterization and validation of methane products from the Atmospheric In- frared Sounder (AIRS). Journal Geophysical Research, 113, G00A01. doi:10.1029/2007JG000500 [25] Chahine, M., Chen, L., Dimotakis, P., Jiang, X., Li, Q.B., Olsen, E., Pagano, T., Randerson, J. and Yung, Y. (2008) Satellite remote sounding of middle tropospheric CO2. Geophysical Research Letters, 35, L17807. doi:10.1029/2008GL035022 [26] Neelin, J.D., Lintner, B.R., Tian, B., Li, Q., Zhang, L., Patra, P.K., Chahine, M.T. and Stechmann, S.N. (2010) Long tails in deep columns of natural and anthropogenic tropospheric tracers. Geophysical Research Letters, 37, L05804. doi:10.1029/2009GL041726 [27] Yang, D.Q., Kane, D., Zhang, Z., Legates, D. and Goodi- son, B. (2005) Bias-corrections of long-term (1973-2004) daily precipitation data over the northern regions. Geo- physical Research Letters, 32, L19501. doi:10.1029/2005GL024057 [28] Scales, J.A., Smith, M.L. and Treitel, S. (2001) Intro- ductory inverse theory. Samizdat Press, Golden. [29] Brockwell P.J. and Davis, R.A. (1991) Time series: The- ory and methods. 2nd Edition, Springer-Verlag, New York. doi:10.1007/978-1-4419-0320-4 [30] Wackernagel, H. (2003) Multivariate geostatistics: An Introduction with Applications. 3rd Edition, Springer, New York. [31] Sandwell, D. T. (1987) Biharmonic spline interpotation of GOES-3 and SEASAT altimeter data. Geophysical Research Letters, 14, 139-142. doi:10.1029/GL014i002p00139 [32] Sandwell, D.T. and Smith, W.H.F. (2009) Global marine gravity from retracked Geosat and ERS-1 altimetry: Ri- dge segmentation versus spreading rate. Journal Geo- physical Research, 114, B01411. doi:10.1029/2008JB006008 [33] Wessel, P. and Bercovici, D. (1998) Interpolation with splines in tension: A Green’s function approach. Mathe- matical Geology, 30, 77-93. doi:10.1023/A:1021713421882 [34] Wessel, P. (2009) A general-purpose Green’s function- based interpolator. Computers & Geoscience, 35, 1247- 1254. doi:10.1016/j.cageo.2008.08.012 [35] Yang, D., Kane, D., Hinzman, L.D., Zhang, X., Zhang T. and Ye, H. (2002) Siberian Lena River hydrologic regime and recent changes. Journal Geophysical Research, 107, 4694. doi:10.1029/2002JD002542 [36] Yang, D.Q., Ye, B.S. and Shiklomanov, A. (2004) Stream flow changes over Siberian Yenisei River Basin. Journal Hydrology, 296, 59-80. doi:10.1016/j.jhydrol.2004.03.017 [37] Van Huissteden, J., Maximov, T.C. and Dolman, A.J. (2011) High methane flux from an arctic floodplain (In- digirka lowlands, Eastern Siberia). Journal Geophysical Research, 110, G02002. [38] Van Huissteden, J., Berrittella, C., Parmentier, F.J.W., Mi, Y., Maximov, T.C. and Dolman, A.J. (2011) Methane emissions from permafrost thaw lakes limited by lake drainage. Nature Climate Change, 1, 119-123. doi:10.1038/nclimate1101 [39] Muskett, R.R. (2011) Non-stationary drivers of polar sea ice area. Natural Science, 3, 351-368. doi:10.4236/ns.2011.35047 [40] Anders, E.L., Guest, P.S., Persson, P.O.G., Fairall, C.W., Horst, T.W., Moritz, R.E. and Semmer, S.R. (2002) Near-surface water vapor over polar sea ice is always near ice saturation. Journal Geophysical Research, 107, 8033. doi:10.1029/2000JC000411 [41] Shakhova, N., Semiltov, I., Salyuk, A., Yusupov, V., Cosmach, D. and Gustafsson, Ö. (2009) Extensive methane venting to the atmosphere from sediments of the  R. R. Muskett et al. / Natural Science 3 (2011) 827-836 Copyright © 2011 SciRes. OPEN ACCESS 836 East Siberian Arctic shelf. Science, 327, 1246-1250. doi:10.1126/science.1182221 [42] Kalabin, A.I. (1973) Scientific-procedural principles of investigation and the main features of the hydrogeology of northern countries (exemplified by northeastern USSR). In: Sanger, F.J. and Hyde, P.J., Eds., USSR Contribu- tion—Permafrost, 2nd International Conference, National Academy of Sciences, Washington, 13-28 July 1973. [43] Smith, L.C., Sheng, Y., MacDonald, G.M. and Hinzman, L.D. (2005) Disappearing ARCTIC LAkes. Science, 308, 1429. doi:10.1126/science.1108142 [44] Yoshikawa, K. and Hinzeman, L.D. (2003) Shrinking thermokarst ponds and groundwater dynamics in discon- tinuous permafrost near Council, Alaska. Permafrost & Periglacial Processess, 14, 151-160. doi:10.1002/ppp.451 [45] Jorgenson, MT., Romanovsky, V., Harden, J., Shur, Y., O’Donnell, J., Shuur, E.A.G., Kaneveskiy, M. and Mar- chenko, S. (2010) Resilience and vulnerability of perma- frost to climate change. Canadian Journal Forestry Re- search, 40, 1219-1236. doi:10.1139/X10-060 [46] Bloom, A.A., Palmer, P.L., Fraser, A., Reay, D.S. and Frankerberg, C. (2010) Large-scale controls of mathano- genesis inferred from methane and gravity data. Science, 327, 322-325. doi:10.1126/science.1175176
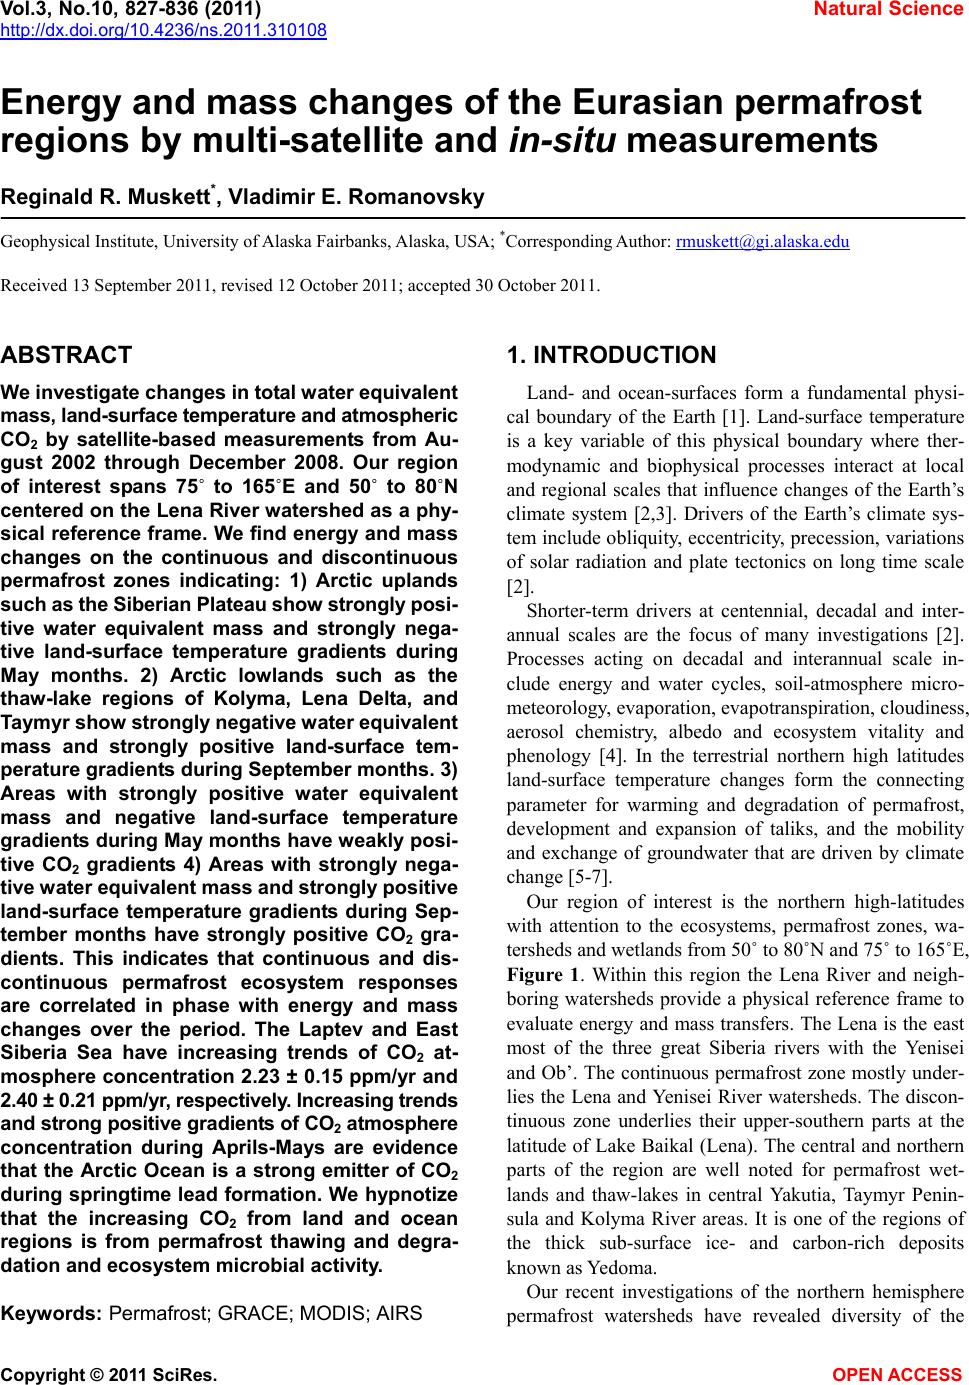
|