 Atmospheric and Climate Sciences, 2011, 1, 197-205 doi:10.4236/acs.2011.14022 Published Online October 2011 (http://www.SciRP.org/journal/acs) Copyright © 2011 SciRes. ACS A Probe for Consistency in CAPE and CINE during the Prevalence of Severe Thunderstorms: Statistical-Fuzzy Coupled Approach Sutapa Chaudhuri Department of Atmos p heri c S ci ences , University of Calcutta, Kolka ta, India E-mail: chaudhuri_sutapa@yahoo.com Received May 16, 2011; revised July 1, 2011; accepted July 20, 2011 Abstract Thunderstorms of pre-monsoon season (April-May) over Kolkata (22˚32' N, 88˚20' E), India are invariably accompanied with lightning flashes, high wind gusts, torrential rainfall, occasional hail and tornadoes which significantly affect the life and property on the ground and aviation aloft. The societal and economic impact due to such storms made accurate prediction of the weather phenomenon a serious concern for the meteor- ologists of India. The initiation of such storms requires sufficient moisture in lower troposphere, high surface temperature, conditional instability and a source of lift to initiate the convection. Convective available poten- tial energy (CAPE) is a measure of the energy realized when conditional instability is released. It plays an important role in meso-scale convective systems. Convective inhibition energy (CINE) on the other hand acts as a possible barrier to the release of convection even in the presence of high value of CAPE. The main idea of the present study is to see whether a consistent quantitative range of CAPE and CINE can be identi- fied for the prevalence of such thunderstorms that may aid in operational forecast. A statistical-fuzzy coupled method is implemented for the purpose. The result reveals that a definite range of CINE within 0 - 150 J·kg–1 is reasonably pertinent whereas no such range of CAPE depicts any consistency for the occurrence of severe thunderstorms over Kolkata. The measure of CINE mainly depends upon the altitude of the level of free convection (LFC), surface temperature (T) and surface mixing ratio (q). The box-and-whisker plot of LFC, T and q are drawn to select the most dependable parameter for the consistency of CINE in the prevalence of such thunderstorms. The skills of the parameters are evaluated through skill score analyses. The percentage error during validation with the observation of 2010 is estimated to be 0% for the range of CINE and 3.9% for CAPE. Keywords: Severe Thunderstorms, Forecast, CAPE, CINE, Statistics, Fuzzy Logic 1. Introduction Thunderstorms of pre-monsoon season (April-May) over Kolkata (22˚32' N, 88˚20' E, India are local severe stor- ms, termed as Nor’westers because the approach of these storms towards the station is predominantly from the north-westerly direction and are locally known as “Kal- baishakhi” meaning “danger in the month of Baishakh”. In general, thunderstorms are recurrent features and prevail over different parts of India. However, Nor’westers leads to remarkable devastation causing significant socio-eco- nomic impact over the region due to loss of life and prop- erty and aviation hazard. Precise forecast of Nor’westers continues to be a challenge for the atmospheric scientists of India. This has, doubtless, occupied the attention of the meteorologists over the last nine decades or so. Ini- tially all the investigations were based on the observa- tions of surface parameters before and immediately after the occurrence of thunderstorms. Priority was given to thermodynamic parameters especially the wet bulb and wet bulb potential temperature [1]. Indian meteorologists [2] could identify well before the publication of thunder- storm project report in United States [3] that not only the discontinuity in temperature and moisture in the vertical plane was a favorable environment for the genesis of such thunderstorms but the large-scale flow pattern to  S. CHAUDHURI 198 advect temperature and moisture were also important. A major contribution was made by introducing the micro- physics of cloud in explaining updraft and down draft [4]. Initially, the primary importance was given to the low level features [5] and later the upper atmosphere was observed to be a prime promoter of deep convection [6]. Coupling of low level and upper level features was then suggested to be important [7]. Theory of excessive over- shooting proved the validity of parcel convection in some form [8]. The significant parameters for the prediction of pre-monsoon thunderstorms at Kolkata were identified using statistical methods [9]. The level of downdraft for- mation was identified during Nor’westers using frequency domain analysis [10]. The multivariate technique was applied to reduce the number of variables in forecasting pre-monsoon thunderstorms [11]. The consequences, before and after the occurrence of Nor’westers were brought into the knowledge using statistical method [12]. Some cases of Nor’westers were simulated by different numerical models [13-15]. Probably due to the complex nature of the pheno- menon and non-availability of the proper network of observations, no single technique, so far, has proven to be sufficient enough for the accurate prediction of Nor’westers. The complex nature and non-linearity in- herent in the atmospheric processes necessitated a way out from the existing conventional methods. The application of artificial intelligence (AI) in the form of soft computing technique [16] in atmospheric sciences has become very popular since 1990s. Many scientists have used AI methods in meteorology [17-27]. The method of genetic algorithm (GA) is observed to be useful to identify the appropriate energy required for the genesis of severe thunderstorms over Kolkata [28]. The method of ampliative reasoning is used to identify the critical values of CAPE and CINE for definite occur- rence of severe thunderstorms [29]. Artificial Neural Network (ANN) model is developed to forecast the maximum wind speed associated with severe thunder- storms over Kolkata [30]. The depth of the potential convective instability during Nor’westers was quantified using a hybrid soft computing model [31]. The convec- tive available potential energy (CAPE) is observed to play a significant role in linking the thermodynamics and microphysical processes during severe thunderstorms [32]. The significance of the shape of CAPE in estimate- ing the severity of pre-monsoon thunderstorm over Kol- kata was established using chaotic graph theory [33]. The consequence of surface parameters due to the occurrence of severe thunderstorms is observed with rough set theory [34]. Preferred sequence of low level clouds for the de- velopment of severe thunderstorms was identified using soft computing technique [35]. The importance of 06 UTC observations in the study of Nor’westers is empha- sized in the paper. Bipartite graph model is developed for forecasting thunderstorm over Kolkata [36]. The model provides 12 hour forecast (nowcasting) of thunder- storms with 96% accuracy. The significance of convec- tive energies in forecasting severe thunderstorms is pre- sented with one hidden layer neural net and variable learning rate back propagation algorithm [37]. The con- cept of fractal dimension is introduced in the study of pre-monsoon thunderstorms [38]. Graph spectral distan- ce and entropy estimation are implemented for nowcast- ing thunderstorms [39]. The main objective of the study is to reveal a depen- dable quantitative range of CAPE and CINE for the prevalence of severe thunderstorms over Kolkata during the premonsoon season, which may abet in the opera- tional forecast of the weather system. 2. Materials and Methods 2.1. Meteorological Data The upper air Radiosonde (RS)/Rawinsonde (RW) data at 00 and 12 UTC used in the present study are collected from the website of the Department of Atmospheric Sci- ence, University of Wyoming for the pre-monsoon sea- son (April-May) during the period from 1997 to 2009. The location of the study is Kolkata (22˚32' N, 88˚20' E) (station no. 42809). The record of the occurrences of thunderstorms is collected from Regional Meteorologi- cal Centre, (RMC), Kolkata, India. The records include the time of occurrence, duration, maximum wind speed, direction of squall advancement and available satellite and radar observations. The input variables used in the present study are the RS/RW sounding data at the UTC before the occur- rence of thunderstorms. The convective available poten- tial energy (CAPE), convective inhibition energy (CINE), altitude of the level of free convection (LFC) from the surface level are computed using the RAOB (Rawin- sonde Observation) software and taken as the input pa- rameters along with the surface temperature and surface mixing ratio for implementing the coupled approach of statistics and fuzzy theory. The variability in the altitude of LFC, surface temperature and surface mixing ratio are estimated using box-whisker plots.The Thunderstorm days of 2010 are selected for the validation of the result with the observation. 2.2. Methodology The methodology in this study includes the Z-statistics of the statistical hypothesis testing to identify the quanti- Copyright © 2011 SciRes. ACS  S. CHAUDHURI 199 , tative ranges of CAPE and CINE for the occurrence of severe thunderstorms. The fuzzy membership is imple- mented to discern the significance of the linguistic vari- ables “more” in relation to the consistency of the ranges of CAPE and CINE. The box-and-whisker plot are drawn to view the variability in the altitude of LFC, surface temperature (T) and surface mixing ratio (q) during se- vere thunderstorms. According to Wilks [40], accuracy is simply the correspondence between the observations and forecasts while forecast skill refers to the accuracy of a forecast set relative to a set of control forecasts, an im- provement over a control forecast set. The Heidke Skill Score (HSS) uses random forecasts as the control set. However, Jolliffe and Stephenson [41] demonstrated that Odds Ratio Skill Score (Yule’s Q) is more preferable than HSS in evaluating the performance of binary fore- casts since Yule’s Q satisfies the criteria of equitability, regularity, and consistency where as HSS satisfies only the equitability. Nevertheless, either HSS or Yule’s Q should provide a better assessment of performance. A contingency table is prepared and the Yule’s Q, True Skill Statistics (TSS) and Hiedke Skill Score (HSS) are computed to identify the skill of the parameters. 2.2.1. Statistical Hypoth esi s T e stin g Meteorological data analysis and making prediction based on these data requires a huge archive of data. The weather prediction cannot be made accurate unless it is made on the basis of a sample data having adequate ver- satility because the nonlinearity and complexity are in- herent in the atmospheric processes. The implementa- tion of the logic of hypothesis testing thus becomes nec- essary [42]. Several statistics are used in testing different hypotheses. Use of a particular statistic depends upon the type of the problem. In the present study, Z-statistic is used. A sample of 124 severe thunderstorms with wind speed more than 65 km·h1 during the period from 1997 to 2009 in the pre-monsoon season (April-May) is col- lected for this study. The frequencies of the occurrence of thunderstorms for different ranges of CAPE and CINE are computed during the pre monsoon season over Kolkata within the period from 1997 to 2009 (Table 1). This gives a mean CINE = 131 and a standard deviation of CINE = 102.78. The mean CINE is assumed to be 150 J·kg1 in this study because the maximum number of thunderstorms occurred for CINE within the range of 0 to 150 J·kg1. The null hypothesis in case of CINE is thus, defined as:H0: = 150. Without contradicting the observational records, an alternative hypothesis becomes: Table 1. Frequency (percentage) of pre-monsoon thunder- storms over Kolkata within different ranges of CAPE and CINE. CAPE (J·kg1)CINE (J·kg1) 0 - 150151 - 300 301 - 450 451 - 600Total 0000 - 100016 (12.9%) 16 (12.9%) 07 (5.7%) 00 (0%) 39 (31.5%) 1000 - 200025 (20.2%) 07 (5.6%) 02 (1.6%) 00 (0%) 34 (27.4%) 2000 - 300022 (17.7%) 04 (3.2%) 00 (0%) 01 (1%) 27 (21.9%) > 3000 24 (19.4%) 00 (0%) 00 (0%) 00 (0%) 24 19.4%) Total 87 27 09 01 124 (70.2%)(21.7%) (7.3%) (1%) (100%) H1: < 150 A one-tailed test is performed in this case. As the variance of CINE associated with the occurrence of thunderstorms is not known, the standard deviation ˆ is estimated: ˆ = SD = 103.19 (1) where n = 124. The test-statistic, Z = (–) 2.053 and Z 0.05 = 1.645 [from standard table] The result shows that the absolute value of the test- statistic, Z computed for the samples exceeds the tabular value at 5% level of significance (Figure 1). Thus, null hypothesis is rejected and the alternative hypothesis is accepted. This indicates that, in 95% cases the mean value of CINE for the occurrence of pre-monsoon thun- derstorms will be less than 150 J·kg–1. To fix the range of CINE, a two-tailed test is to be performed. The test-statistic in this case is Z0.025 = 1.96 [from standard table] because Z = Z if Z > 0 and Z = () Z if Z < 0 [by definition] Using the Equation (2) (Wilks, 1995): 0 n PZAP xA (2) We obtain: P [113 148] = 95% (3) where, P Probability. It is thus, observed that if 124 samples of severe thun- derstorms of pre-monsoon season are repeatedly col- lected then 95% of the average CINE associated with the maximum frequency of severe thunderstorms will be within the range of 113 to 148 J·kg1. This finding does not involve serious Type-1 error and is, therefore rea- Copyright © 2011 SciRes. ACS 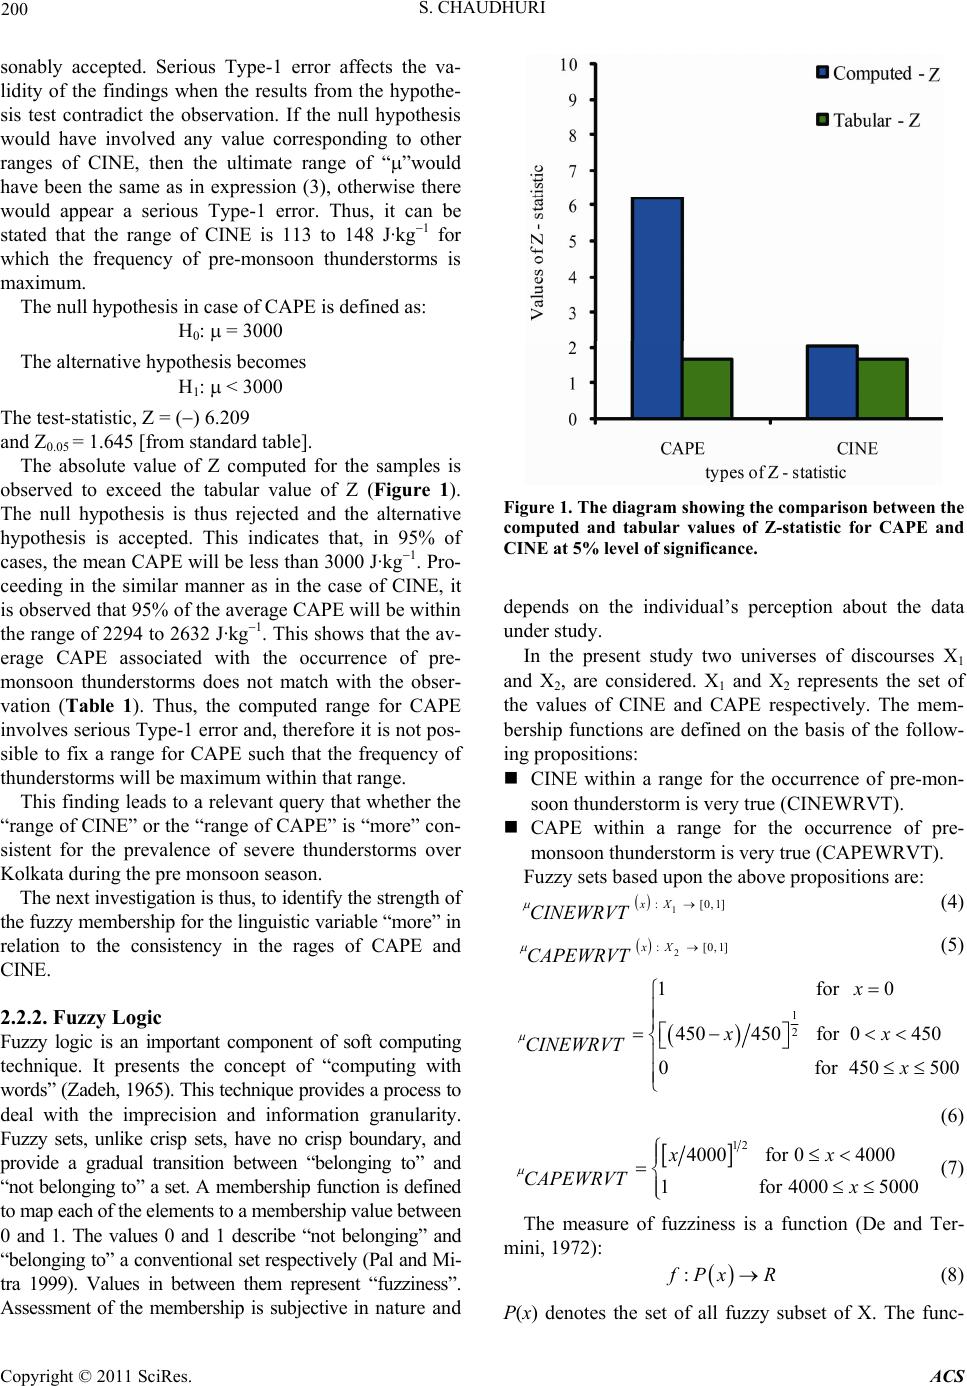 S. CHAUDHURI 200 sonably accepted. Serious Type-1 error affects the va- lidity of the findings when the results from the hypothe- sis test contradict the observation. If the null hypothesis would have involved any value corresponding to other ranges of CINE, then the ultimate range of “”would have been the same as in expression (3), otherwise there would appear a serious Type-1 error. Thus, it can be stated that the range of CINE is 113 to 148 J·kg1 for which the frequency of pre-monsoon thunderstorms is maximum. The null hypothesis in case of CAPE is defined as: H0: = 3000 The alternative hypothesis becomes H1: < 3000 The test-statistic, Z = () 6.209 and Z0.05 = 1.645 [from standard table]. The absolute value of Z computed for the samples is observed to exceed the tabular value of Z (Figure 1). The null hypothesis is thus rejected and the alternative hypothesis is accepted. This indicates that, in 95% of cases, the mean CAPE will be less than 3000 J·kg1. Pro- ceeding in the similar manner as in the case of CINE, it is observed that 95% of the average CAPE will be within the range of 2294 to 2632 J·kg1. This shows that the av- erage CAPE associated with the occurrence of pre- monsoon thunderstorms does not match with the obser- vation (Table 1). Thus, the computed range for CAPE involves serious Type-1 error and, therefore it is not pos- sible to fix a range for CAPE such that the frequency of thunderstorms will be maximum within that range. This finding leads to a relevant query that whether the “range of CINE” or the “range of CAPE” is “more” con- sistent for the prevalence of severe thunderstorms over Kolkata during the pre monsoon season. The next investigation is thus, to identify the strength of the fuzzy membership for the linguistic variable “more” in relation to the consistency in the rages of CAPE and CINE. 2.2.2. Fuzzy Logic Fuzzy logic is an important component of soft computing technique. It presents the concept of “computing with words” (Zadeh, 1965). This technique provides a process to deal with the imprecision and information granularity. Fuzzy sets, unlike crisp sets, have no crisp boundary, and provide a gradual transition between “belonging to” and “not belonging to” a set. A membership function is defined to map each of the elements to a membership value between 0 and 1. The values 0 and 1 describe “not belonging” and “belonging to” a conventional set respectively (Pal and Mi- tra 1999). Values in between them represent “fuzziness”. Assessment of the membership is subjective in nature and Figure 1. The diagram showing the comparison between the computed and tabular values of Z-statistic for CAPE and CINE at 5% level of significance. depends on the individual’s perception about the data under study. In the present study two universes of discourses X1 and X2, are considered. X1 and X2 represents the set of the values of CINE and CAPE respectively. The mem- bership functions are defined on the basis of the follow- ing propositions: CINE within a range for the occurrence of pre-mon- soon thunderstorm is very true (CINEWRVT). CAPE within a range for the occurrence of pre- monsoon thunderstorm is very true (CAPEWRVT). Fuzzy sets based upon the above propositions are: 1 :[0,xX CINEWRVT 1 ,1] ] (4) 2 :[0xX CAPEWRVT (5) 1 2 1 for 0 450450for 0450 0 for 450500 x xx CINEWRVT x (6) 12 4000for 04000 1 for 40005000 xx CAPEWRVT x (7) The measure of fuzziness is a function (De and Ter- mini, 1972): : Px R (8) P(x) denotes the set of all fuzzy subset of X. The func- Copyright © 2011 SciRes. ACS 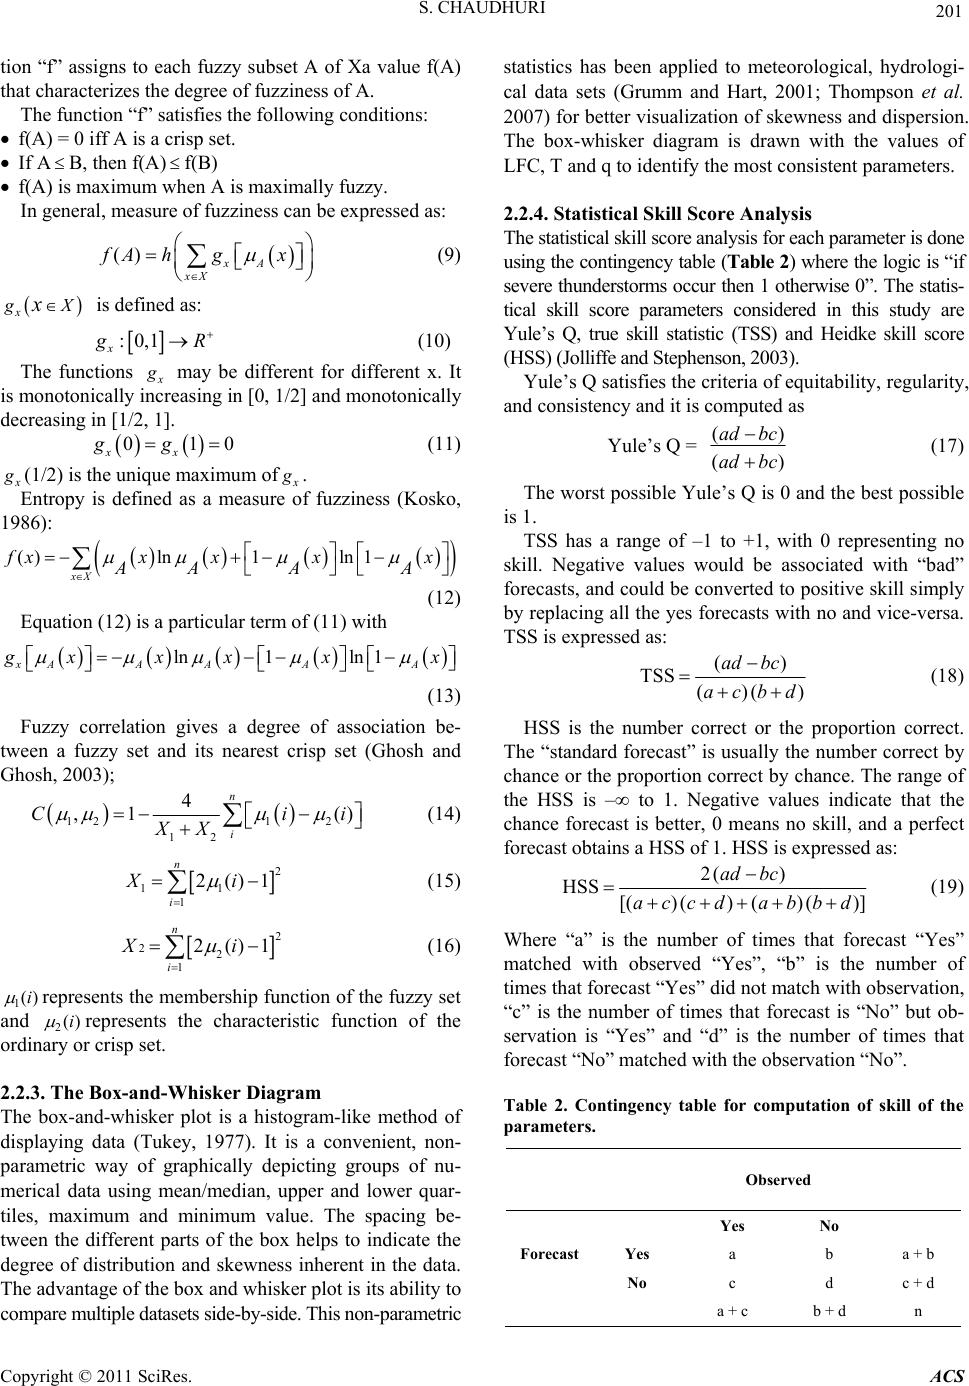 S. CHAUDHURI 201 tion “f” assigns to each fuzzy subset A of Xa value f(A) that characterizes the degree of fuzziness of A. The function “f” satisfies the following conditions: f(A) = 0 iff A is a crisp set. If AB, then f(A)f(B) f(A) is maximum when A is maximally fuzzy. In general, measure of fuzziness can be expressed as: () xA xX fA hgx (9) x Xx is defined as: :0,1 x R (10) The functions may be different for different x. It is monotonically increasing in [0, 1/2] and monotonically decreasing in [1/2, 1]. 01 xx gg0 (11) (1/2) is the unique maximum of . Entropy is defined as a measure of fuzziness (Kosko, 1986): ()ln 1 ln1 xX xxxx AA AA x (12) Equation (12) is a particular term of (11) with ln1ln1 xAA AAA xxx x x 3) Fuzzy correlation gives a degree of association be tween a fuzzy set and its nearest crisp set (Ghosh G (1 - and hosh, 2003); 12 4 ,1 () n Cii 1 2 12 i XX (15) (14) 2 11 1 2()1 n i Xi 2 22 1 2()1 n i Xi (16) 1()i represents the membership function of the fuzzy set and 2()i represents the characteristic function of the ordin hisker Diagram The box-and-whisker plot is a histogram-like method of onvenient, non- Thstical skill score analysis for each parameter is done ere the logic is “if ary or crisp set. 2.2.3. The Box-and-W displaying data (Tukey, 1977). It is a c parametric way of graphically depicting groups of nu- merical data using mean/median, upper and lower quar- tiles, maximum and minimum value. The spacing be- tween the different parts of the box helps to indicate the degree of distribution and skewness inherent in the data. The advantage of the box and whisker plot is its ability to compare multiple datasets side-by-side. This non-parametric statistics has been applied to meteorological, hydrologi- cal data sets (Grumm and Hart, 2001; Thompson et al. 2007) for better visualization of skewness and dispersion. The box-whisker diagram is drawn with the values of LFC, T and q to identify the most consistent parameters. 2.2.4. Statistical Skill Sco re Analysis e stati using the contingency table (Table 2) wh severe thunderstorms occur then 1 otherwise 0”. The statis- tical skill score parameters considered in this study are Yule’s Q, true skill statistic (TSS) and Heidke skill score (HSS) (Jolliffe and Stephenson, 2003). Yule’s Q satisfies the criteria of equitability, regularity, and consistency and it is computed as Yule’s Q = () () ad bc ad bc (17) The worstle’s Q is 0 is 1. Negative values would be associated with “bad” fo possible Yu and the best possible TSS has a range of –1 to +1, with 0 representing no skill. recasts, and could be converted to positive skill simply by replacing all the yes forecasts with no and vice-versa. TSS is expressed as: () TSS ad bc (18) () ( )acbd HSS is the number correct or the The “standard forecast” is usually the number correct by ch proportion correct. ance or the proportion correct by chance. The range of the HSS is –∞ to 1. Negative values indicate that the chance forecast is better, 0 means no skill, and a perfect forecast obtains a HSS of 1. HSS is expressed as: 2( ) HSS [()() ()()] ad bc accd abbd (19) Where “a” is the number of times that for matched with observed “Yes”, “b” is the number of of the Observed ecast “Yes” times that forecast “Yes” did not match with observation, “c” is the number of times that forecast is “No” but ob- servation is “Yes” and “d” is the number of times that forecast “No” matched with the observation “No”. Table 2. Contingency table for computation of skill arameters. p YesNo Yes a b a + b Forecast No c + d a + c b + d c d n Copyright © 2011 SciRes. ACS 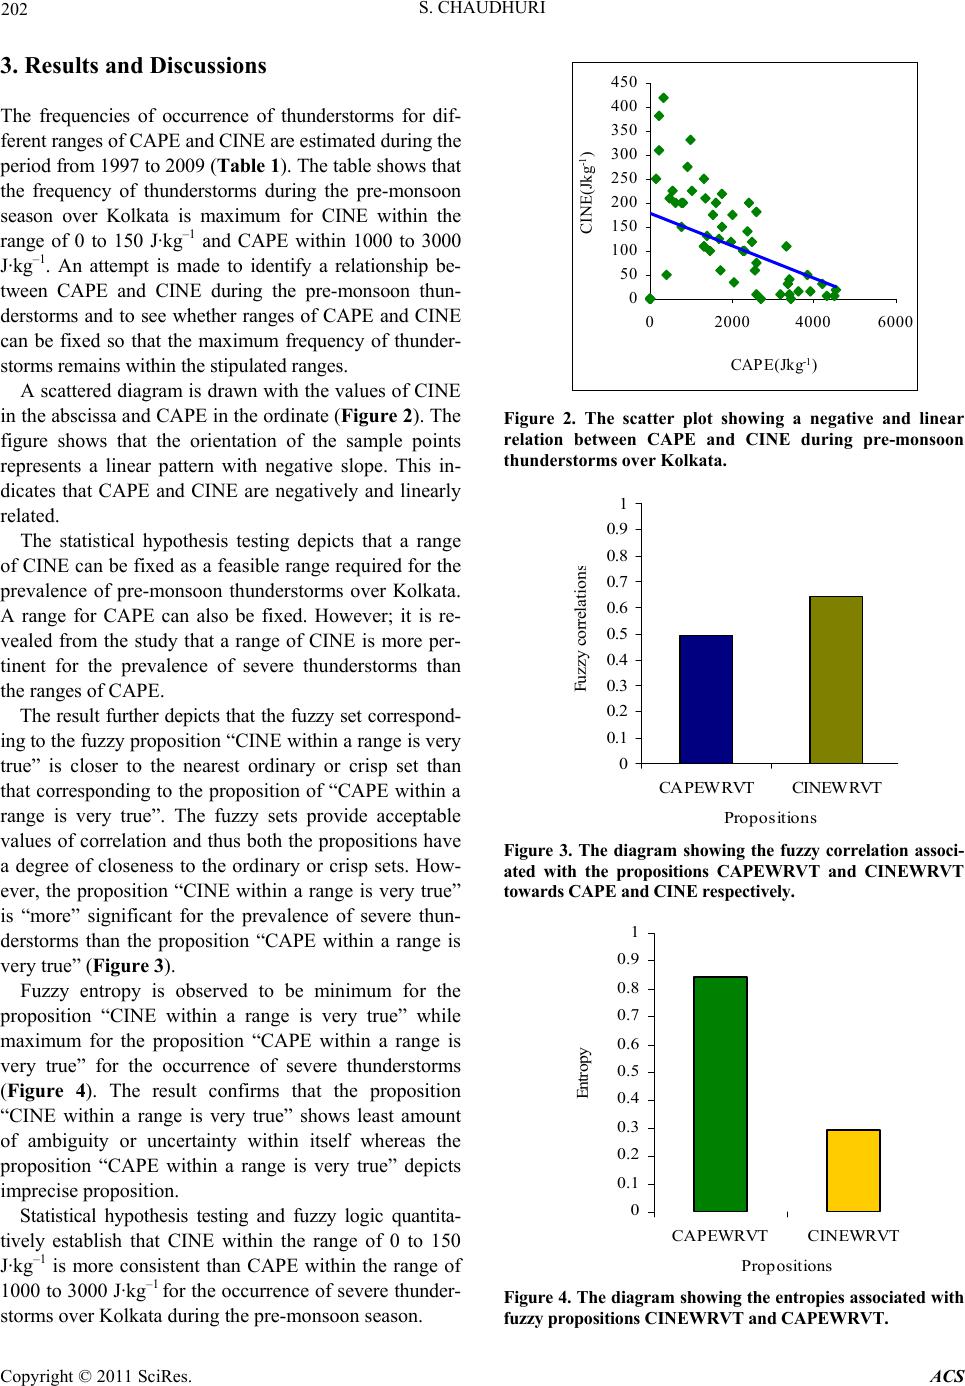 S. CHAUDHURI 202 3. Results and Discussions thunderstorms for dif- re estimated during the The frequencies of occurrence of ferent ranges of CAPE and CINE a period from 1997 to 2009 (Table 1). The table shows that the frequency of thunderstorms during the pre-monsoon season over Kolkata is maximum for CINE within the range of 0 to 150 J·kg–1 and CAPE within 1000 to 3000 J·kg–1. An attempt is made to identify a relationship be- tween CAPE and CINE during the pre-monsoon thun- derstorms and to see whether ranges of CAPE and CINE can be fixed so that the maximum frequency of thunder- storms remains within the stipulated ranges. A scattered diagram is drawn with the values of CINE in the abscissa and CAPE in the ordinate (Figure 2). The figure shows that the orientation of the sample points represents a linear pattern with negative slope. This in- dicates that CAPE and CINE are negatively and linearly related. The statistical hypothesis testing depicts that a range of CINE can be fixed as a feasible range required for the prevalence of pre-monsoon thunderstorms over Kolkata. A range for CAPE can also be fixed. However; it is re- vealed from the study that a range of CINE is more per- tinent for the prevalence of severe thunderstorms than the ranges of CAPE. The result further depicts that the fuzzy set correspond- ing to the fuzzy proposition “CINE within a range is very true” is closer to the nearest ordinary or crisp set than that corresponding to the proposition of “CAPE within a range is very true”. The fuzzy sets provide acceptable values of correlation and thus both the propositions have a degree of closeness to the ordinary or crisp sets. How- ever, the proposition “CINE within a range is very true” is “more” significant for the prevalence of severe thun- derstorms than the proposition “CAPE within a range is very true” (Figure 3). Fuzzy entropy is observed to be minimum for the proposition “CINE within a range is very true” while maximum for the proposition “CAPE within a range is very true” for the occurrence of severe thunderstorms (Figure 4). The result confirms that the proposition “CINE within a range is very true” shows least amount of ambiguity or uncertainty within itself whereas the proposition “CAPE within a range is very true” depicts imprecise proposition. Statistical hypothesis testing and fuzzy logic quantita- tively establish that CINE within the range of 0 to 150 J· –1 kg is more consistent than CAPE within the range of 1000 to 3000 J·kg–1 for the occurrence of severe thunder- storms over Kolkata during the pre-monsoon season. 0 50 100 150 200 250 300 350 400 450 02000 40006000 CAPE(Jkg-1) CINE(Jkg-1 ) Figure 2. The scatter plot showing a negative and linear relation between CAPE and CINE during pre-monsoon thunderstorms ov er Ko lkata. 0 0.1 0.2 0.3 0.4 0.5 0.6 0.7 0.8 0.9 1 CAPEWRVT CINEWRVT Propositions Fuzzy correlation Figure 3. The diagram showing the fuzzy correlation associ- ated with the propositions CAPEWRVT and CINEWRVT towards CAPE and CINE respectively. 0 0.1 0.2 0.3 0.4 0.5 0.6 0.7 0.8 0.9 1 CAPEWRVT CINEWRVT Pro ositions Entropy Figure 4. The diagram showing the entropies associated with fuzzy p ropositions CINEWRVT and CAPEWRVT. Copyright © 2011 SciRes. ACS 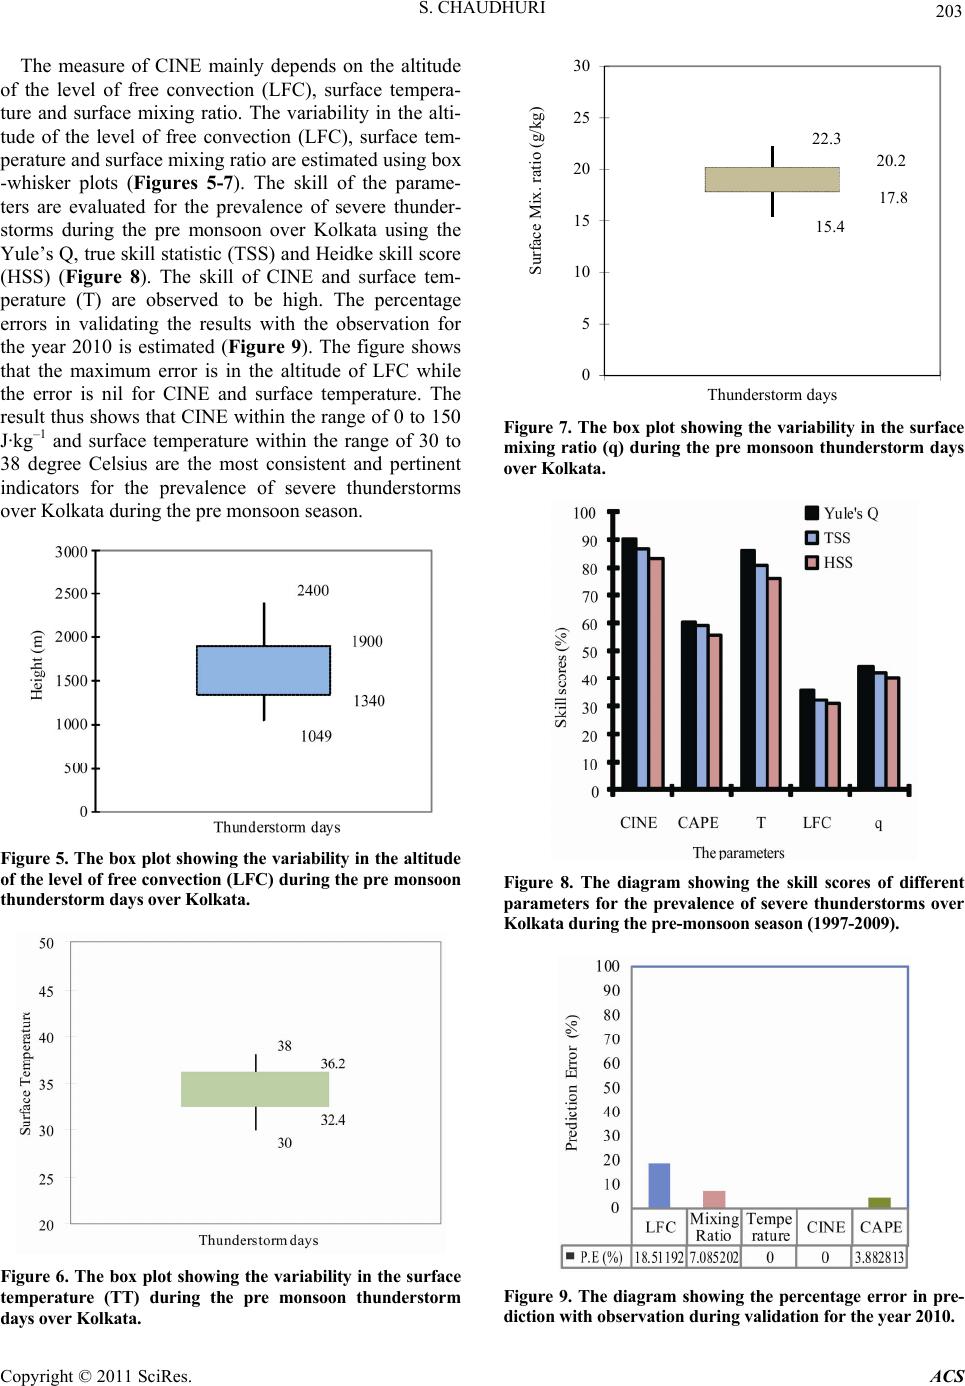 S. CHAUDHURI 203 The measure of CINE mainly depends on the altitude of the level of free convection (LFC), surface tempera- ture and surface mixing ratio. The variability in the alti- tude of the level of free convection (LFC), surface tem- perature and surface mixing ratio are estimated using box -whisker plots (Figures 5-7). The skill of the parame- ters are evaluated for the prevalence of severe thunder- storms during the pre monsoon over Kolkata using the Yule’s Q, true skill statistic (TSS) and Heidke skill score (HSS) (Figure 8). The skill of CINE and surface tem- perature (T) are observed to be high. The percentage errors in validating the results with the observation for the year 2010 is estimated (Figure 9). The figure shows that the maximum error is in the altitude of LFC while the error is nil for CINE and surface temperature. The result thus shows that CINE within the range of 0 to 150 J·kg–1 and surface temperature within the range of 30 to 38 degree Celsius are the most consistent and pertinent indicators for the prevalence of severe thunderstorms over Kolkata during the pre monsoon season. Figure 5. The box plot showing the variability in the altitude of the level of free convection (LFC) during the pre monsoon thunderstorm days over Kolkata. Figure 6. The box plot showing the variability in the surface temperature (TT) during the pre monsoon thunderstorm days over Kolkat a. 20.2 22.3 15.4 17.8 0 5 10 15 20 25 30 Thunderstorm days Surface Mix. ratio (g/kg) Figure 7. The box plot showing the variability in the surface mixing ratio (q) during the pre monsoon thunderstorm days over Kolkata. Figure 8. The diagram showing the skill scores of different arameters for thp Kolka e prevalence of severe thunderstorms over ta during the pre-monsoon season (1997-2009). Figure 9. The diagram showing the percentage error in pre- diction with observation during validation for the year 2010. Copyright © 2011 SciRes. ACS 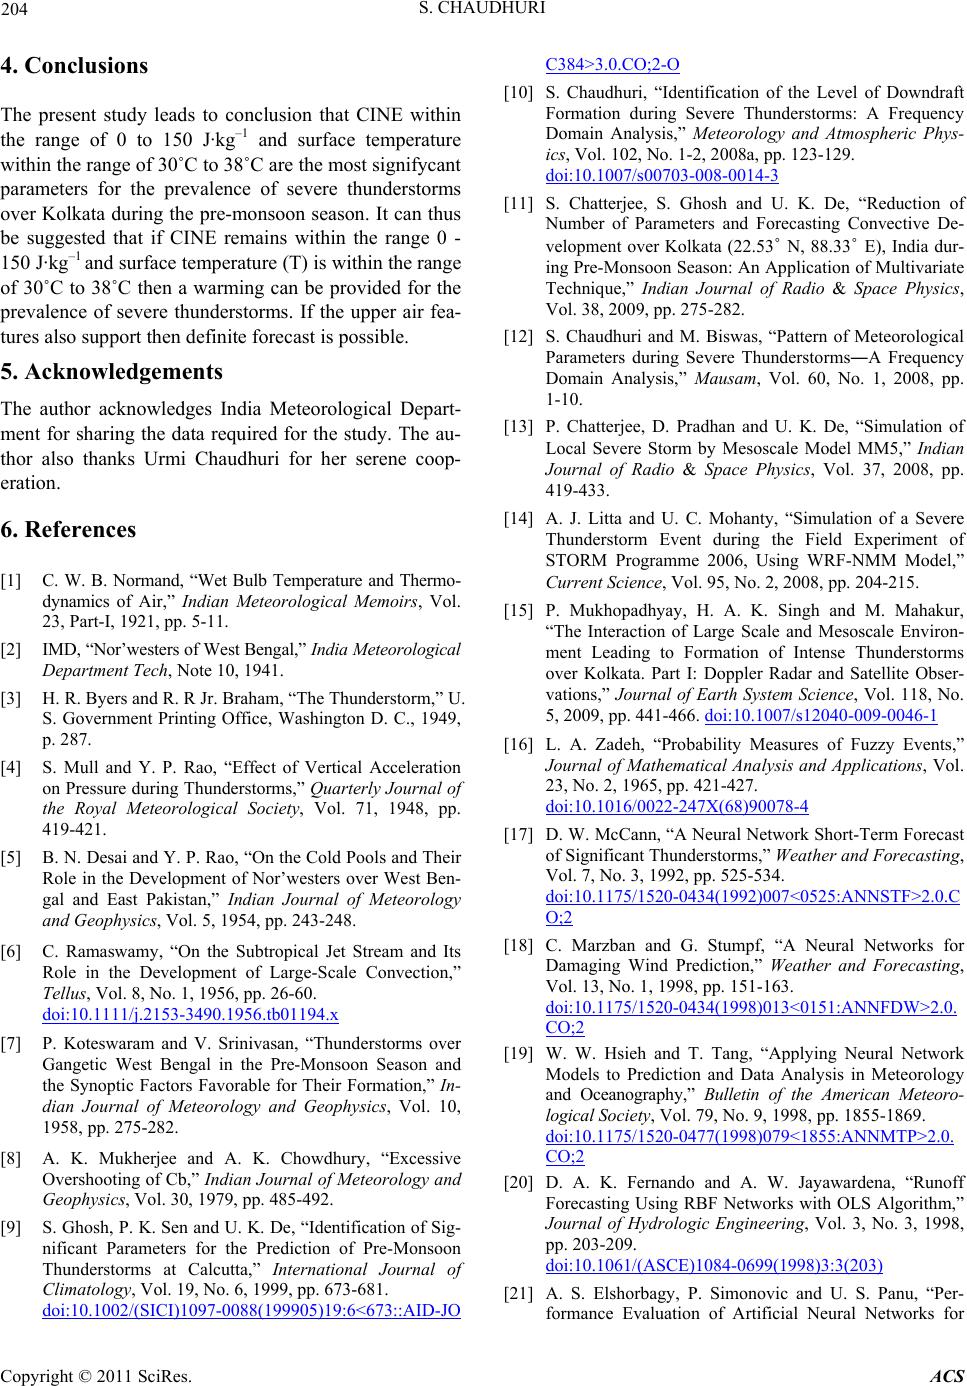 S. CHAUDHURI 204 he present study leads to conclusion that CINE with the range of 0 to 150 J·kg–1 and surface temperature within the range of 30˚C to 38˚C are the most signifycant parameters for the prevalence of severe thunderstorms over Kolkata during the pre-monsoon season. It can t be suggested that if CINE remains within the range 0 - 150 J·kg–1 and surface temperature (T) is within the range of 30˚C to 38˚C then a warming can be provided for the prevalence of severe thunderstorms. If the upper ai tures also support then definite forecast is possible. 5. Acknowledgements The author acknowledges India Meteorological Depa ment for sharing the data required for the study. The au- 6. References of Society, Vol. 71, 1948, pp. eophysics, Vol. 5, 1954, pp. 243-248. y, “On the Subtropical Jet Stream and evelopment of Large-Scale Convection,” Tellus, Vol. 8, No. 1, 1956, pp. 26-60. 4. Conclusions Tin hus r fea- rt- thor also thanks Urmi Chaudhuri for her serene coop- eration. [1] C. W. B. Normand, “Wet Bulb Temperature and Thermo- dynamics of Air,” Indian Meteorological Memoirs, Vol. 23, Part-I, 1921, pp. 5-11. [2] IMD, “Nor’westers of West Bengal,” India Meteorological Department Tech, Note 10, 1941. [3] H. R. Byers and R. R Jr. Braham, “The Thunderstorm,” U. S. Government Printing Office, Washington D. C., 1949, p. 287. [4] S. Mull and Y. P. Rao, “Effect of Vertical Accele erstorms,” Quarterly Journal ration on Pressure during Thund the Royal Meteorological 419-421. [5] B. N. Desai and Y. P. Rao, “On the Cold Pools and Their Role in the Development of Nor’westers over West Ben- gal and East Pakistan,” Indian Journal of Meteorology and G [6] C. Ramaswam Role in the D Its doi:10.1111/j.2153-3490.1956.tb01194.x [7] P. Koteswaram and V. Srinivasan, “Thunderstorms over Gangetic West Bengal in the Pre-Monsoon Season and Geophysics, Vol. 10, oting of Cb,” Indian Journal of Meteorology and orms at Calcutta,” International Journal of the Synoptic Factors Favorable for Their Formation,” In- dian Journal of Meteorology and 1958, pp. 275-282. [8] A. K. Mukherjee and A. K. Chowdhury, “Excessive Oversho Geophysics, Vol. 30, 1979, pp. 485-492. [9] S. Ghosh, P. K. Sen and U. K. De, “Identification of Sig- nificant Parameters for the Prediction of Pre-Monsoon Thunderst Climatology, Vol. 19, No. 6, 1999, pp. 673-681. doi:10.1002/(SICI)1097-0088(199905)19:6<673::AID-JO C384>3.0.CO;2-O [10] S. Chaudhuri, “Identification of the Level of Downdraft 29. Formation during Severe Thunderstorms: A Frequency Domain Analysis,” Meteorology and Atmospheric Phys- ics, Vol. 102, No. 1-2, 2008a, pp. 123-1 doi:10.1007/s00703-008-0014-3 [11] S. Chatterjee, S. Ghosh and U. K. De, “Reduction of Number of Parameters and Forecasting Convective De- velopment over Kolkata (22.53˚ N, 88.33˚ E), India dur- ing Pre-Monsoon Season: An Application of Multivariate Technique,” Indian Journal of Radio Space Physics&, ingh and M. Mahakur, Vol. 38, 2009, pp. 275-282. [12] S. Chaudhuri and M. Biswas, “Pattern of Meteorological Parameters during Severe Thunderstorms―A Frequency Domain Analysis,” Mausam, Vol. 60, No. 1, 2008, pp. 1-10. [13] P. Chatterjee, D. Pradhan and U. K. De, “Simulation of Local Severe Storm by Mesoscale Model MM5,” Indian Journal of Radio & Space Physics, Vol. 37, 2008, pp. 419-433. [14] A. J. Litta and U. C. Mohanty, “Simulation of a Severe Thunderstorm Event during the Field Experiment of STORM Programme 2006, Using WRF-NMM Model,” Current Science, Vol. 95, No. 2, 2008, pp. 204-215. [15] P. Mukhopadhyay, H. A. K. S “The Interaction of Large Scale and Mesoscale Environ- ment Leading to Formation of Intense Thunderstorms over Kolkata. Part I: Doppler Radar and Satellite Obser- vations,” Journal of Earth System Science, Vol. 118, No. 5, 2009, pp. 441-466. doi:10.1007/s12040-009-0046-1 [16] L. A. Zadeh, “Probability Measures of Fuzzy Events,” Journal of Mathematical Analysis and Applications, Vol. 23, No. 2, 1965, pp. 421-427. doi:10.1016/0022-247X(68)90078-4 [17] D. W. McCann, “A Neural Network Short-Term Forecast of Significant Thunderstorms,” Weather and Forecasting, Vol. 7, No. 3, 1992, pp. 525-534. doi:10.1175/1520-0434(1992)007<0525:ANNSTF>2.0.C O;2 [18] C. Marzban and G. Stumpf, “A Neural Networks for Damaging Wind Prediction,” Weather and Forecasting, Vol. 13, No. 1, 1998, pp. 151-163. doi:10.1175/1520-0434(1998)013<0151:ANNFDW>2.0. CO;2 [19] W. W. Hsieh and T. Tang, “Applying Neural Network Models to Prediction and Data Analysis in Meteorology and Oceanography,” Bulletin of the American Meteoro- logical Society, Vol. 79, No. 9, 1998, pp. 1855-1869. doi:10.1175/1520-0477(1998)079<1855:ANNMTP>2.0. CO;2 [20] D. A. K. Fernando and A. W. Jayawardena, “Runoff Forecasting Using RBF Networks with OLS Algorithm,” Journal of Hydrologic Engineering, Vol. 3, No pp. 203-209. . 3, 1998, doi:10.1061/(ASCE)1084-0699(1998)3:3(203) [21] A. S. Elshorbagy, P. Simonovic and U. S. Panu, “Per- formance Evaluation of Artificial Neural Networks for Copyright © 2011 SciRes. ACS  S. CHAUDHURI Copyright © 2011 SciRes. ACS 205 , Vol. 5, No. 4, 2000, pp. 424-427. Runoff Prediction,” Journal of Hydrologic Engineering ASCE doi:10.1061/(ASCE)1084-0699(2000)5:4(424) [22] A. S. Tokar and M. Markus, “Precipitation-Runoff Mod- eling Using Artificial Neural Netw Models,” Journal of Hydrologic Engineering, Vol. 5, No. 2, 2000 orks and Conceptu , pp. 156-161. al doi:10.1061/(ASCE)1084-0699(2000)5:2(156) [23] C. Marzban and A. Witt, “A Bayesian Neural Network for Severe Hail Size Prediction,” Weather and Forecast- ing, Vol. 16, No. 5, 2001, pp. 600-610. doi:10.1175/1520-0434(2001)016<0600:ABNNFS>2.0.C O;2 [24] A. Abraham, N. S. Philip and B. Joseph, “Will We Have a Wet Summer? Long Term Rain Forecasting Using Soft Computing Models,” In: E. J. H. Kerchoffs and M. Snorek, eds., Modeling and Simulation 2001, Pu of the Society for Computer Simulation Inteblication rnational, , Vol. 285, Prague, 2001, pp. 1044-1048. [25] M. P. Rajurkar , U. C. Kothyari and U. C. Chaube, “Mod- eling of the Daily Rainfall-Runoff Relationship with Ar- tificial Neural Network,” Journal of Hydrology No. 1-4, 2001, pp. 96-113. doi:10.1016/j.jhydrol.2003.08.011 [26] L. Jin, C. Yao and Y. K. Huang, “A Nonlinear Artificial Intelligence Ensemble Prediction Model for Typhoon In- tensity,” Monthly Weather Review, Vol. 136, 2008, pp. 4541-4554. No. 12, 69.1doi:10.1175/2008MWR22 ology, Vol. 25, No. 7, 2008, pp. 1136-1148. [27] Y. Wang, T. Y. Yu, M. Yeary, A. Shapiro, S. Nemati, M. Foster, D. L. Jr Andra and M. Jain, “Tornado Detection Using a Neuro-Fuzzy System to Integrate Shear and Spec- tral Signatures,” Journal of Atmospheric and Oceanic Techn doi:10.1175/2007JTECHA1022.1 [28] S. Chaudhuri, “Genetic Algorithm to Recognize Apt En- ergy for the Genesis of Severe Thunderstorms,” Vatabaran, AFAC Journal of Meteorology, Vol. 29, No. 2, 2008, pp. 1-8. S. Chaudhuri, “Ampliative Rea[29] soning to View the Preva- lence of Severe Thunderstorms,” Mausam-Quarterly Journal of Meteorology, Hydrology & Geophysics, Vol. 57, No. 3, 2006, pp. 523-526. [30] S. Chaudhuri, “Artificial Neural Ne cast Maximum Wind Speed Associa twork Model to Fore- ted with Severe Thun- derstorms,” Vatabaran, AFAC Journal of Meteorology, Vol. 30, No. 1, 2006, pp. 14-19. [31] S. Chaudhuri, “A Hybrid Model to Estimate the Depth of Potential Convective Instability during Severe Thunder- storms,” Soft Computing, Vol. 10, No. 8, 2006, pp. 643- 648. doi:10.1007/s00500-005-0532-6 [32] S. Chaudhuri and S. Aich Bhowmik, “CAPE―A Link between Thermodynamics and Microphysics for the Oc- currence of Severe Thunderstorms,” Mausam-Quarterly Journal of Meteorology, Hydrology & Geophysics, Vol. 57, No. 2, 2006, pp. 249-254. [33] S. Chaudhuri, “Chaotic Graph Theory Approach for Identification of Convective Available Potential Energy (CAPE) Patterns Required for the Genesis of Severe Thunderstorms,” Advances in Complex Systems, Vol. 10, No. 3, 2007, pp. 413-422. doi:10.1142/S0219525907001215 [34] S. Chaudhuri, “Consequences of Surface Parameters due to the Occurrence of Severe Thunderstorms―A View through Rough Set Theory,” Science & Culture, Vol. 73, No. 11-12, 2007, pp. 391-395. [35] S. Chaudhuri, “Preferred Type of Cloud in the Genesis of Severe Thunderstorms―A Soft Computing Approach,” Atmospheric Research, Vol. 88, No. 2, 2008, pp. 149-156. doi:10.1016/j.atmosres.2007.10.008 [36] S. Chaudhuri and A. Middey, “The Applicability of Bi- partite Graph Model for Thunderstorm Forecast over Kolkata,” Advances in Meteorology, Vol. 2009, 2009, pp. 1-12. doi:10.1155/2009/270530 [37] S. Chaudhuri, “Convective Energies in Forecasting Se- vere Thunderstorms with One Hidden Layer Neural Net and Variable Learning Rate Back Propagation Algo- rithm,” Asia-Pacific Journal of Atmospheric Sciences, Vol. 46, No. 2, 2010, pp. 173-183. [38] S. Chaudhuri, “Predictability of Severe Thunderstorms with Fractal Dimension Approach,” Asian Journal of Wa- ter, Air & Environmental Pollution, Vol. 7, No. 4, 2010, pp. 81-87. [39] S. Chaudhuri and A. Middey, “Nowcasting Thunder- storms with Graph Spectral Distance and Entropy Esti- mation,” Meteorological Applications, Vol. 18, No. 2, 2011, pp. 238-249. doi:10.1002/met.240 [40] D. S. Wilks, “Statistical Methods in the Atmospheric ns, Chichester, 2003. Sciences,” 2nd Edition, Elsevier, Oxford, 2006. [41] I. T. Jolliffe and D. B. Stephenson, “Forecast Verification: A Practitioner’s Guide in Atmospheric Science,” John Wiley and So [42] D. S. Wilks, “Statistical Methods in Atmospheric Sci- ences,” Academic Press, Cambridge, 1995, pp. 114-122.
|