Atmospheric and Climate Sciences, 2011, 1, 172-185
doi:10.4236/acs.2011.14019 Published Online October 2011 (http://www.SciRP.org/journal/acs)
Copyright © 2011 SciRes. ACS
Numerical Study of Initial Soil Moisture
Impacts on Regional Surface Climate
Xueli Shi
National Climate Cen ter, China Meteorological Administration, Beijing, China
E-mail: shixl@cma.gov.cn
Received July 8, 2011; revised August 16, 2011; accepted August 29, 2011
Abstract
In this paper, the impacts of initial soil moisture (SM) over the Huaihe River Basin of China on the summer-
time climate have been investigated with a regional climate model. Three fourth-month-long simulations are
made for two summers, the abnormal flooding in 2003 and normal climate in 2004. Besides control simula-
tions (noted as CTL), sensitivity experiments have been conducted by assigning the initial soil moisture
equals to 50% and 150% of the simulated soil moisture while keeping the others unchanged, which are noted
as SM50 and SM150, respectively. The results show that effects of initial SM anomalies at late spring can
last for the whole summer, and the increase of initial soil moisture (SM150) has more significant effects than
the decreased one (SM50). The differences between sensitivity experiments and CTL mainly appear at sur-
face and near-surface atmosphere. When increasing the initial SM, the latent heat flux and surface soil mois-
ture are increased, correspondingly the sensible heat flux, temperature and radiation are all decreased. The
changes of rainfall are not distinct between SM50 and SM150, which might be related to the processes
within atmosphere, especially the humidity pattern.
Keywords: Soil Moisture, Surface Climate, Model Simulation, Huaihe River Basin Component
1. Introduction
As a widely recognized low-pass filter, the soil moisture
(SM) plays an important role in the interactions between
land and atmosphere [1-3]. Liu (2003) suggested that SM
might be more important in monthly and seasonal vari-
ability at regional scales [4]. Eltahir (1998) showed the
key roles of SM in regulating the precipitation anomaly
through the radiation and dynamic feedback on an ob-
servation basis [5].
But because of the lack in systematic measurements of
long-term SM, most studies with observed datasets are
locally confined. As an effective and unique compensa-
tion, numerical models have been widely used to invest-
tigate the SM roles in predictions/simulations at various
space-time scales over different regions. Results have
shown that the SM has complex interactions with at-
mosphere and climate, and the feedbacks are not always
consistent with different models and regions [6-8].
The Huaihe River Basin (HRB) region is one of the
prominent political and economic regions of China,
therefore the rainfall/flood prediction, control and pre-
vention here is of extreme importance. Ma et al. (2000)
has analyzed the observed relationship between SM and
rainfall, and shown somewhat positive feedbacks be-
tween them [9]. Sun et al. (2005) also found positive
correlation with the previous or concurrent rainfall, but
negative with the subsequent rainfall a half year later
[10]. With the land surface models, Lin et al. (2001)
studied the initial SM effects on land surface processes
via sensitivity experiments [11].
In this paper, initial SM effects on the subsequent cli-
mate will be further tested with a regional climate model.
Two cases are selected, i.e., abnormal flooding year of
2003 and normal year of 2004, which are necessary to
find some common SM effects in different years and
relative processes involved. The numerical model and
experiment configuration introductions are given in sec-
tion 2. The model simulation and sensitivity experiment
results are, respectively, presented in sections 3 and 4.
Finally is the summary and discussion in section 5.
2. The Numerical Model and Experimental
Configurations
The regional climate model of National Climate Center
173
X. L. SHI
(RegCM_NCC) is used for the study, detailed infor- ma-
tion about the model can be referred to Ding et al. (2008)
[12] and Chow et al. (2008) [13]. The model has a 45-km
horizontal resolution, with 105 and 85 grid numbers, re-
spectively, in latitudinal and longitudinal direc- tions. The
large-scale datasets are from the NCEP/NCAR Reanaly-
sis II (2.5˚ 2.5˚) with 6-hr interval [14]. The integration
period is from 1 May to the end of August in each year.
Besides control simulations (noted as “CTL”), two
sets of sensitivity experiments have been made, by modi-
fying the initial SM into 50% and 150% over the broad
HRB region (105˚ N - 120˚ E, 30˚ N - 37˚ N), which are
noted as SM50 and SM150. The initial SM is not the one
at the right beginning, but the simulated SM at the last
time slice for certain period (the 31st day), similar to
Pielke et al. [1]. Except the initial SM, other configure-
tions are all same as CTL. And in order to keep the SM
being within a reasonable range, the modified SM is
confined within the range from the permanent wilting
point to the field capacity.
In all the simulations, the first month is taken as the
spin-up period, and the focus is on the climate features in
the whole summer (June, July and August).
3. Model Control Run Results
The summer 2003 experienced abnormal climate at dif-
ferent regions around the world. In China, the HRB en-
countered the maximum rainfall and flooding since 1954,
with about 50% larger than the normal at several prov-
inces (such as the Jiangsu, Anhui and Henan), while 50%
less than the normal at provinces of south China (Jiangxi,
Hunan and Guangxi provinces) (Figure 1).
To facilitate the interpretation of the results for sensi-
tivity experiments, the control simulations of the 2003
summer are shown firstly. The observed precipitation is
generally featured by the heavy rainfall centers at south-
western part of the model domain and the ocean near the
Taiwan Island (Figure 2(a)). The model basically re-
produced the pattern, but the rainfall is somewhat under-
estimated (overestimated) at the continental (costal and
ocean) regions (Figure 2(b)).
The vertical profiles of zonal wind over HRB are
shown in Figure 3. The westerly controls the higher tro-
posphere in June, July and the second half of August
above 700 hPa, with the strongest wind appearing at up-
per troposphere layers (Figure 3(a)), those are reasona-
bly reproduced by in CTL simulation in both intensity
and temporal evolution, such as the timing of the down-
ward propagating of the westerly in the Middle of June
and July (Figure 3(b)).
Therefore, the RCM has the capacity of reasonably
reproducing the climate and weather features of both
surface and atmosphere in summer 2003, it is suitable to
the following sensitivity experiments.
4. Effects of the Initial Soil Moisture
The reanalyzed SM pattern at 31st May is featured by the
centers located at the south and west of HRB (Figure
4(a)), which is generally consistent reproduced by the
CTL simulation (Figuire 4(b)), but with certain differ-
ence in the “empirical” assigned SM (Figure 4(c)).
During JJA, the CTL and sensitivity experiments all
show much of synoptic scale evolution, which are gener-
ally similar and consistent with each other, except certain
magnitude differences (Figures omitted). So in this part,
differences between sensitivity experiments and CTL will
be analyzed to denote the initial SM effects, which can
also avoid some impact due to the CTL simulation bias.
Figure 1. Observed precipitation abnormal (w.r.t. 1961-1990 climate, %).
Copyright © 2011 SciRes. ACS
X. L. SHI
174
(a) (b)
Figure 2. GPCP (a) and CTL simulated (b) precipitation in JJA 2003 (mm). Contour interval is 100 mm. Rainfall amounts
400 mm are shaded.
(a)
(b)
Figure 3. NCEP reanalyzed (a) and CTL simulated (b) regional mean zonal wind evolution in JJA 2003 (m·s–1). Contour in-
terval is 5 m·s–1. Shaded represents wind 5 m·s–1.
Copyright © 2011 SciRes. ACS
X. L. SHI
Copyright © 2011 SciRes. ACS
175
(a)
(b) (c)
Figure 4. NCEP reanalyzed (a) and CTL simulated (b) soil moisture at 31 May of 2003, and CTL simulated at 1st May 2003
(c). Unit of soil water in (a) and (b, c) is percentage and mm, respectively Shaded are a represents the magnitude 0.3 and 3 0
m.
m
Temporally, the wetting of SM causes the increase (de-
crease) of the latent (sensible) heat fluxes, with the magni-
tude being as large as 100 (–80) W·m2 at the SM-changed
area in SM150, but less change occurred in the SM50 (Fig-
ures 5(a)-(b)). As Hong and Pan (2000) [15] has pointed,
one major role of SM is the partitioning of heat and latent
fluxes in the surface energy budget, which affects the
boundary layer development. With the change of surface
heat flux, the surface temperature is obviously decreased (as
low as –5˚C) in the SM150, but not too much in SM50
(Figure 5(c)). Differences of the net upward long-wave
radiation at surface follow the same patterns (Figure 5(d)).
The SM of upper layer is increased in SM150 but less
changed in SM50 (Figure 5(e)). The precipitation, however,
is fluctuated in both SM150 and SM50 experiments, with
relative larger from 20th June to 21st July, the episode of
extensive and prolonged rainfall along the HRB (Figure
5(f)). Additionally, the differences are not decreased with
time, and the largest departure appear at the middle
Julyalmost two months later, which means that the im-
pacts of the initial SM anomalies in mid-May can persist for
the whole subsequent summer.
X. L. SHI
176
(a)
(b)
(c)
Copyright © 2011 SciRes. ACS
177
X. L. SHI
(d)
(e)
(f)
Figure 5. Differences between sensitivity experiments and CTL of summer 2003 for sensible (a) and latent (b) heat flux,
surface temperature (c), radiation (d), surface layer soil moisture (e) and rainfall (f). Unit of heat flux and radiation is W·m–2,
temperature is ˚C, rainfall and soil moisture are mm day–1. Dashed line with cross: SM150-CTL, Solid line with circle:
SM50-CTL.
Copyright © 2011 SciRes. ACS
X. L. SHI
Copyright © 2011 SciRes. ACS
178
Figure 7 lists the vertical profile of differences be-
tween SM150 and CTL for various variables. The tem-
perature is mostly decreased below 700 hPa, with the
largest decrease being over –5˚C (Figure 7(a)). For the
moisture (atmosphere humidity), the unique feature is the
abnormal increase at the near surface layers below 850
hPa, decrease between 500 hPa - 800 hPa, and some
small positive anomalies at the upper layer above 500
hPa, a sandwich-like pattern during the first half of June
and from late July to the first half of August (Figure
7(b)). The zonal wind anomaly is positive (negative) at
the lower (upper) levels during the two periods, and
negative differences appeared at mid-troposphere from
late July to 15th August (Figure 7(c)). The corres-
ponding vertical motion is downward in the two periods
(Figure 7(d)). The regional mean to the south of SM-
changed area (25˚ N -30˚ N, 110˚ N - 120˚ E) is gener-
ally similar in pattern with those of HRB region (Figures
omits).
Spatially, with the wetting of initial SM, the latent heat
flux (LHF) increases overwhelmed in East China (Fig-
ure 6(a)), and the sensible heat flux (SHF) is oppositely
decreased in mostly SM-changed regions in SM150
(Figure 6(b)). There is an increase of rainfall at regions
to the west and north of the SM-changed area in SM150
(Figure 6(c)). The changes in SM50 experiment are not
so significant, but still show regional increased LHF and
lessened SHF (Figures 6(c)-6(d)). The precipitation was
mostly decrease at regions to the south of the Yangtze
River Valley as well as the southwestern of the HRB,
while increase north to the HRB in SM50 (Figure 6(f)).
The different responses of sensible and latent heat fluxes
are consistent with previous findings, but compared with
CTL, the changes are larger in the SM-wetting experi-
ment (SM150) than those in SM-drying one (SM50). It
might be related to the fact that the actual soil water is
actually much changed (increased) in SM150 than the
decrease in SM50 sensible.
(a) (b) (c)
(d) (e) (f)
Figure 6. Spatial differences of latent heat flux (a-b), sensible heat flux (c-d) and precipitation (e-f) of SM150-CTL (left) and
SM50-CTL (right) in JJA 2003. Unit of heat flux is W·m–2, precipitation is mm. Shaded regions denote the heat flux 20
W·m-2 in (a) and (c), 20 W·m–2 in (b) and (d), rainfall differences 100 mm in (e) and 100 mm in (f).
179
X. L. SHI
(a)
(b)
(c)
Copyright © 2011 SciRes. ACS
X. L. SHI
Copyright © 2011 SciRes. ACS
180
(d)
Figure 7. Regional mean vertical profiles of SM150-CTL over HRB in JJA 2003. (a): temperature (˚C), (b): humidity
(kg·kg1), (c) zonal wind (m·s1), (d): vertical velocity (102 Pa·s1).
Horizontally the vector and convergence presented dif-
ferent features at different levels. It is overwhelmed
anti-cyclonic circulation at 850 hPa, with large conver-
gence appearing at regions to the south of and at the west-
ern part of SM-change area, which is favorable for the
moisture gathering lower level (Figure 8(a)). At 700 hPa,
although abnormal cyclonic circulation appeared at large
model domain, but the convergence sparsely located to the
west and north of the SM-changed region (Figure 8(b)).
The 500 hPa level was featured by cyclonic circulation
and weaker convergence at the HRB, and anti-cyclonic
circulation to the south of HRB (Figure 8(c)). At 200 hPa,
the anti-cyclonic circulation was dominant at broad re-
gions, and the convergence belt located to the south of
HRB (Figure 8(d)). This relative larger convergence at
850 and 200 hPa might be the reason for the vertical
moisture pattern, and needs further investigations.
Therefore significant impacts of the initial SM anoma-
lies appear in the mid-lower troposphere in SM150. The
wet (dry) SM experiments reveal cooling (warming) and
moistening (drying) in the lower troposphere, indicating
weak (strong) dry convection. But the rainfall differences
and processes within atmosphere are not always opposite
between SM150 and SM50 experiments.
4.2. Differences in Summer 2004
The seasonal mean differences of LHF and SHF between
sensitivity experiments and CTL in summer 2004 show
general similar patterns as in summer 2003 (Figures
omitted). At to the rainfall, it is generally decreased to
the north of and at the mid-north part of SM-changed
area, as well as regions to the south of the Yangtze River
Valley, and is slightly increased along the latitude-belt
between 28˚ N - 32˚ N in SM150 (Figure 9(a)). The pre-
cipitation differences are not too distinct in and outside
the SM-changed area, although it is decreased at the
mideastern part of HRB and part of South China. In-
creased rainfall appeared at the latitude belt of 28˚ N -
32˚ N (Figure 9(b)), consistent with but not opposite to
that in SM150.
The temporal evolutions of surface variables are gen-
erally consistent with those of summer 2003, with more
prominent differences appearing at SM150 experiments
than SM50, such as the increase (decrease) of latent
(sensible) heat flux (Figures 10(a)-(b)), decrease of sur-
face temperature (Figure 10(c)) and long wave radiation
(Figure 10(d)), increase of surface soil water (Figure
10(e)). The rainfall differences are comparative between
SM150 and SM50 (Figure 10(f)).
Therefore, initial SM modification can cause climate
changes at surface and atmosphere, with the manners of
impact being generally consistent in two cases. All of
these seem to be related to heat flux (e.g. sensible heat
flux and the latent heat flux as an index of evaporation).
Particularly, when increasing the initial SM, the summer
evaporation (LHF) is increased in regions at the south
part of HRB and south to the mid-lower reaches of
Yangtze River valley, while the SHF is decreased. This
surface changes induced lower temperature and bound-
ary layer mixing processes, as well as changes in the
velocity and especially vertical moisture profiles. As to
the rainfall, some locally changes occurred with the
SM-change, but not too distinct in SM150 and SM50,
which imply that SM did not affect rainfall via the direct
impact of low-level atmosphere moisture from surface,
but some more complex interactions within atmosphere,
which need further studies.
181
X. L. SHI
(a) (b)
(c) (d)
Figure 8. Horizontal distribution of UV-vector and divergence (shaded, < 3. e-5 s–1) at 850 (a), 700 (b), 500 (c) and 200 (d)
hPa. Units of vector and divergence is, respectively, m·s–1 and 1. e-5 s–1.
(a) (b)
Figure 9. Seasonal precipitation differences of SM150-CTL (a) and SM50-CTL (b) in summer 2004 and 1999 (mm). Shaded is
rainfall > 100 mm in (a) and < 100 mm in (b).
Copyright © 2011 SciRes. ACS
X. L. SHI
182
(a)
(b)
(c)
Copyright © 2011 SciRes. ACS
183
X. L. SHI
(d)
(e)
(f)
Figure 10. Same as Figure 5, but for the summer of 2004.
Copyright © 2011 SciRes. ACS
X. L. SHI
Copyright © 2011 SciRes. ACS
184
5. Summary and Discussion
The effects of the initial soil moisture (SM) conditions
over the Huaihe River Basin on the subsequent climate
have been investigated with sensitivity experiments of
the regional climate model. Results show that in both the
abnormal flooding summer of 2003 and normal summer
of 2004, the initial SM has significant effects on the
subsequent climate of surface and atmosphere variables.
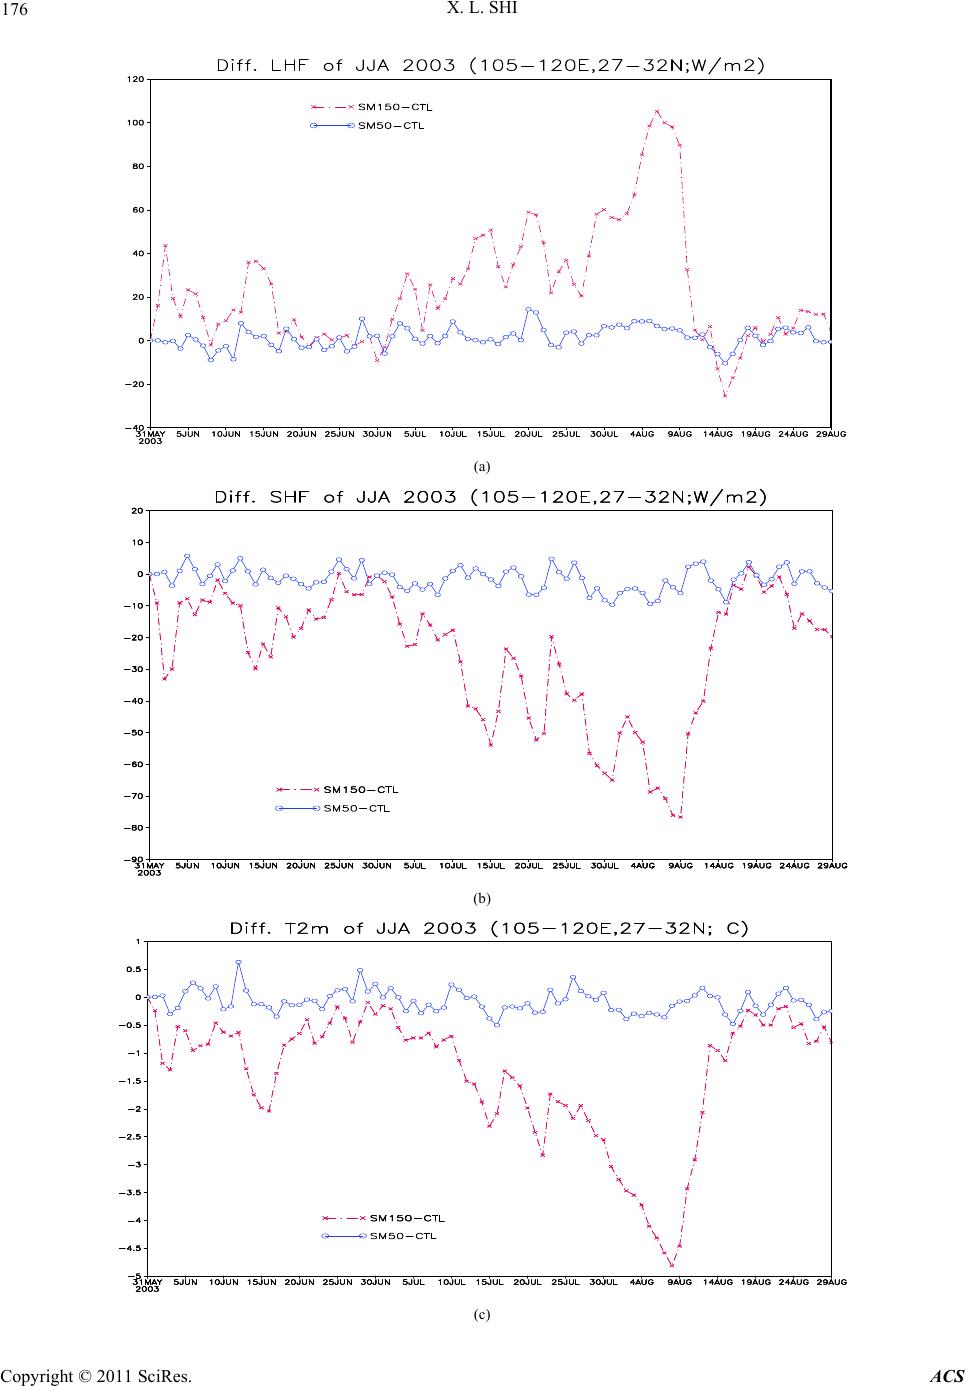
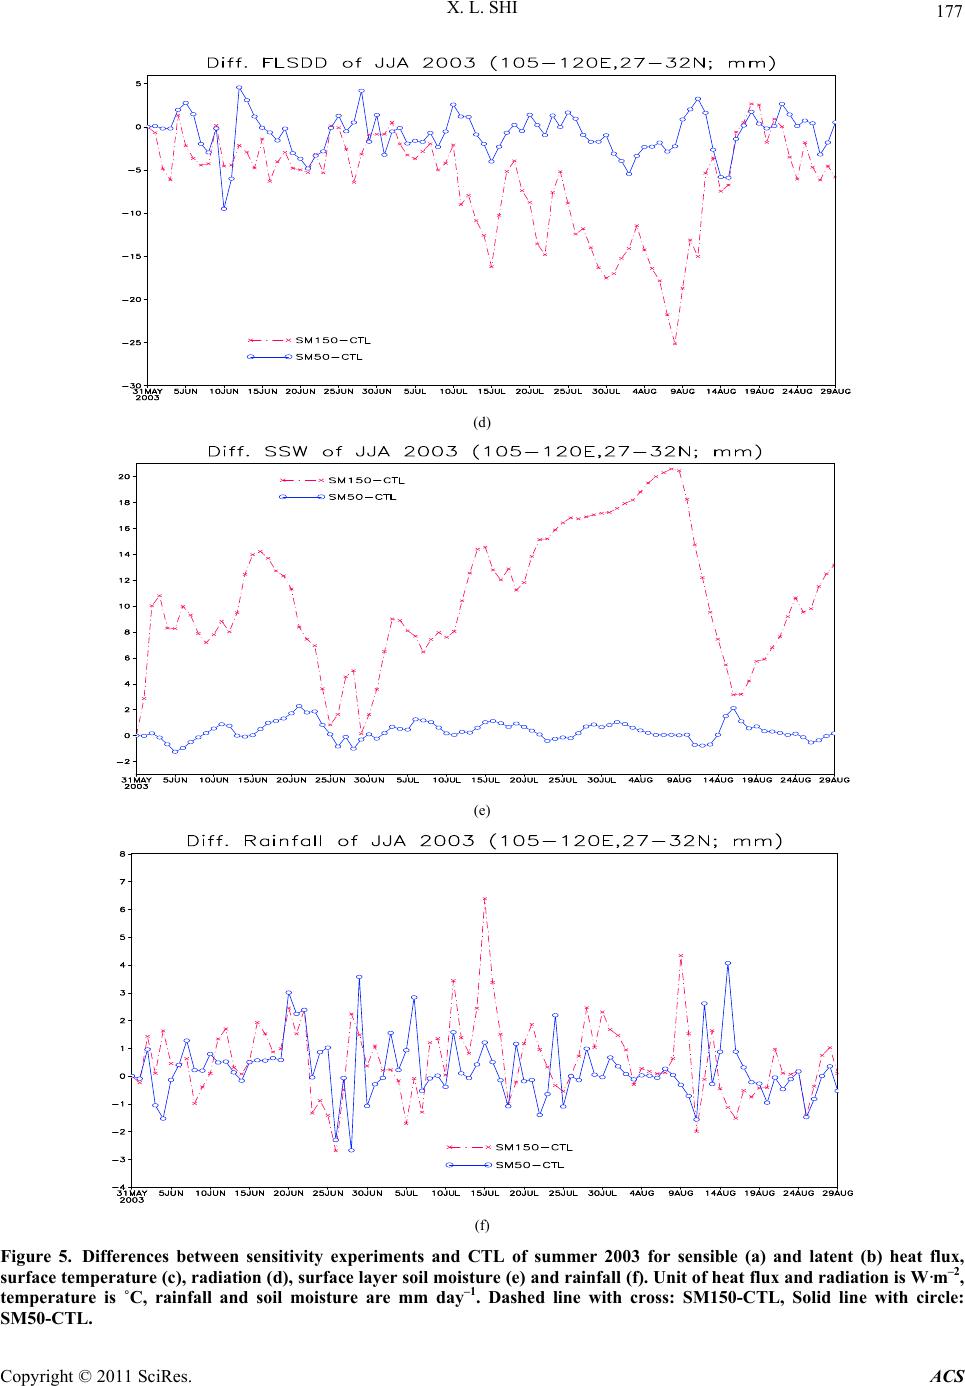
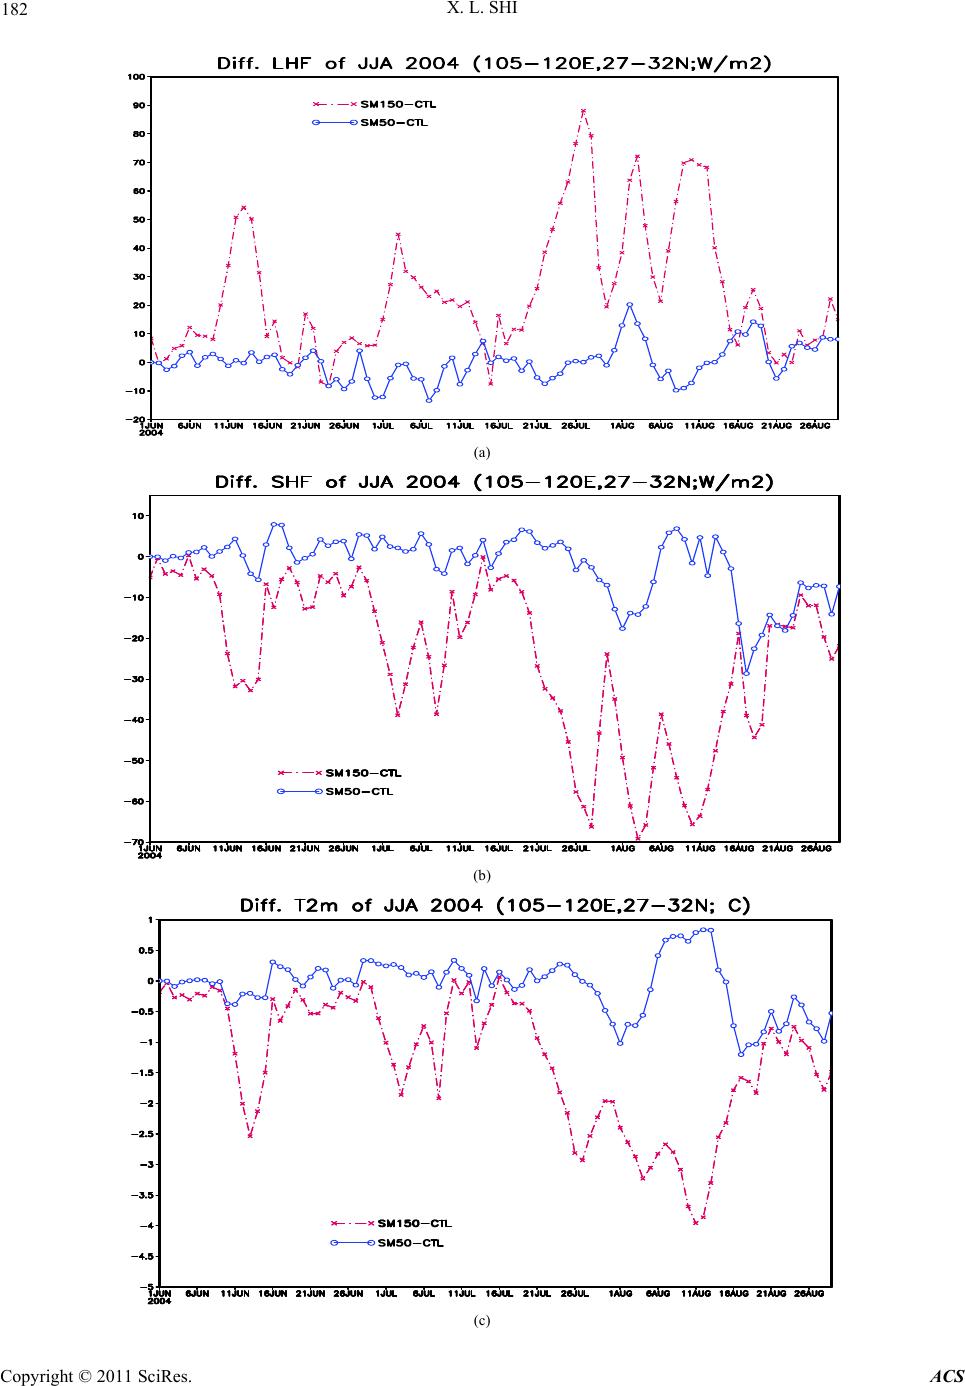
(1) The initial SM abnormal has significant effects on
the subsequent surface climate. The initial “wet” (“dry”)
SM anomalies led to the increase (decrease) of latent
heat flux and upper layer soil moisture, decrease (in-
crease) of surface temperature and sensible heat flux.
This general agrees with several previous results, but
here the SM- wetting experiments show much significant
effects than the SM-drying ones.
(2) The initial SM has certain impacts on the above
atmosphere, especially at the mid-lower troposphere lay-
ers, such as the decrease (increase) of temperature with
the wet (dry) initial SM. Particularly in SM150, the
moisture is increased (decreased) at the lower (mid-lower)
troposphere layers.
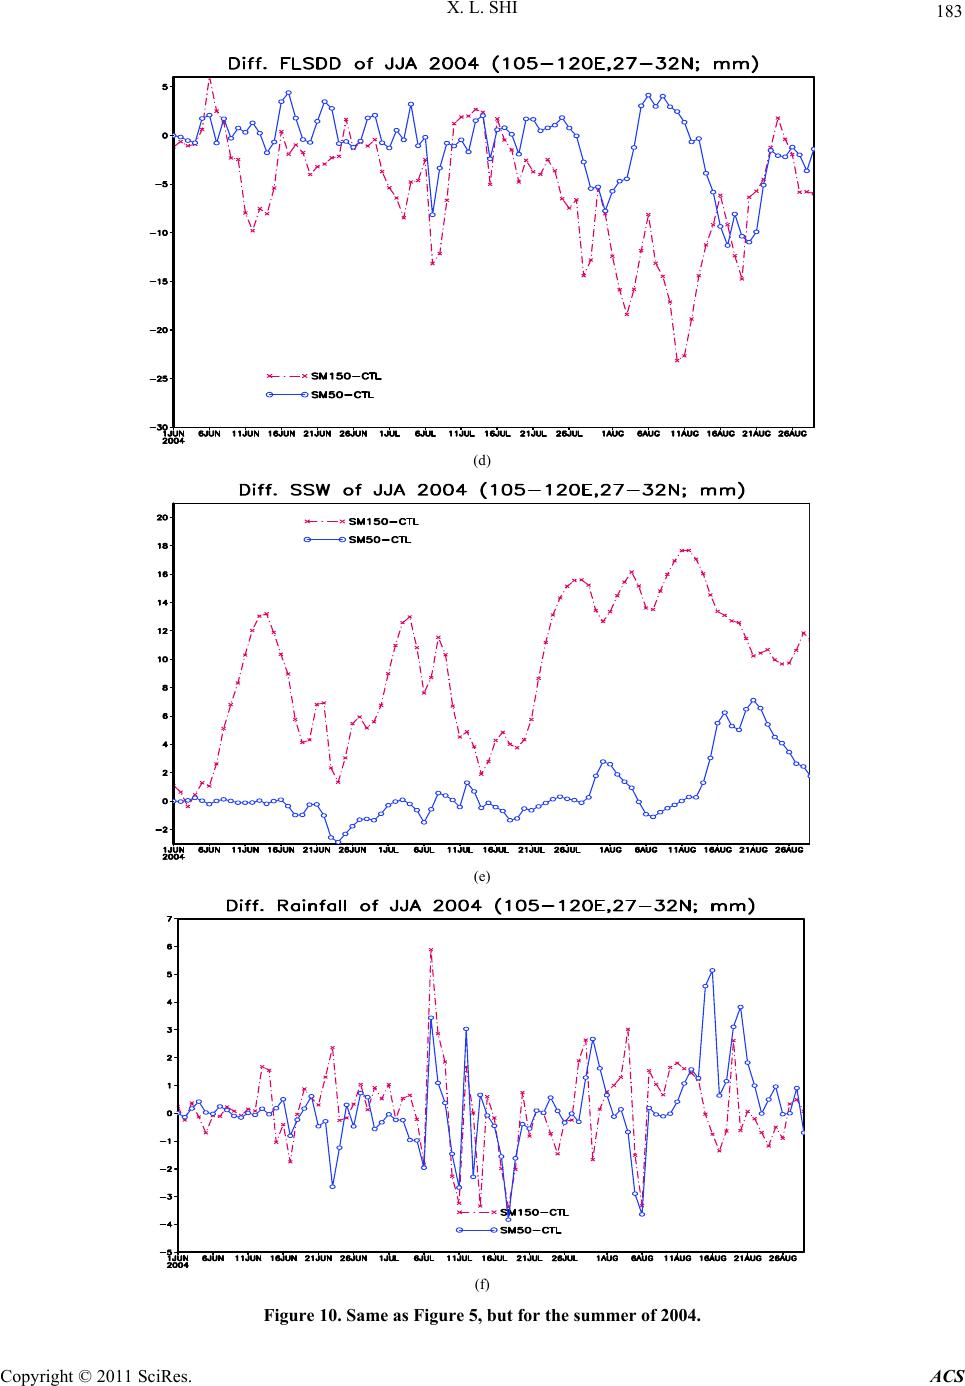
(3) Not totally opposite changes occur in SM50 and
SM150 experiments, especially for the rainfall, which is
related to the processes within atmosphere and need to
study further.
This study focuses on the initial SM anomalies effects
on the subsequent climate with the abnormal flooding
and normal cases in summer 2003 and 2004. Some more
cases (e.g., the abnormal drought cases along HRB) and
further investigations are needed, such as processes in-
volved and temporal efficiency of the SM impacts on
precipitation. Additionally, although plenty of SM data-
set are available from observation, model simulation or
retrieval, great differences exist among them because of
the differences in instruments, land-surface model and its
initializing methods (e.g., Rodell et al. 2005) [16]. So the
initialization of SM should be careful selected. The
method used in study may be better to keep some inter-
nal consistent of the model system. And the half de-
crease/increase of SM is possible occur (but not extreme
ones as the permanent wilting point and field capacity) in
the nature, so the results present in this study have cer-
tain roles in the seasonal predictions, especially when the
initial SM is abnormally wet.
Finally, the regional climate model is used, which is
driven by the realistic representation of the large-scale
atmospheric circulation, and therefore should be better to
isolate the response of SM conditions. However, the re-
sults might be model-dependent; some other models
should be applied for further investigation, for instance,
combining the global climate model with the regional
climate model.
6. Acknowledgements
The author is grateful for the valuable suggestions of
Prof. D. L. Chen, Y. H. Ding and X. B. Zhang, as well as
the comments of the anonymous reviewer. This work is
jointed supported by the 973 projects (Grant No.
2007CB411505 and 2010CB951902).
7. References
[1] R. A. Pielke, G. E. Liston, J. E. Eastman and L. X. Lu,
“Seasonal Weather Prediction as an Initial Value Prob-
lem,” Journal of Geophysical Research, Vol. 104, No.
D16, 1999, pp. 19463-19479. doi:10.1029/1999JD900231
[2] W. R. Wu, M. A. Geller and R. E. Dickinson, “The Re-
sponse of Soil Moisture to Long-Term Variability of Pre-
cipitation,” Journal of Hydrometeorology, Vol. 3, No. 5,
2002, pp. 604-613.
doi:10.1175/1525-7541(2002)003<0604:TROSMT>2.0.C
O;2
[3] T. C. Yeh, R. T. Wetherald and S. Manabe, “The Effect
of Soil Moisture on the Short-Term Climate and Hydrol-
ogy ChangeA Numerical Experiment,” Monthly
Weather Review, Vol. 112, No. 3, 1984, pp. 474-490.
doi:10.1175/1520-0493(1984)112<0474:TEOSMO>2.0.
CO;2
[4] Y. Q. Liu, “Spatial Patterns of Soil Moisture Connected
to Monthly-Seasonal Precipitation Variability in a Mon-
soon Region,” Journal of Geophysical Research, Vol.
108, No. D22, 2003, p. 8856.
doi:10.1029/2002JD003124
[5] E. A. B. Eltahir, “A Soil Moisture-Rainfall Feedback
Mechanism, 1: Theory and Observations,” Water Re-
source Research, Vol. 34, No. 4, 1998, pp. 765-776.
doi:10.1029/97WR03499
[6] R. D. Koster, P. A. Dirmeyer, Z. C. Guo and Coauthors,
“Regions of Strong Coupling between Soil Moisture and
Precipitation,” Science, Vol. 305, No. 5687, 2004, pp.
1138-1140. doi:10.1126/science.1100217
[7] J. J. Xu, W. J. Shuttleworth and X. Gao, “Soil Mois-
ture-Precipitation Feedback on the North American
Monsoon System in the MM5-OSU Model,” Quarterly
Journal of Royal Meteorology Society, Vol. 130, No. 603,
2004, pp. 2873-2890. doi:10.1256/qj.03.192
[8] H. Douville, F. Chauvin and H. Broqua, “Influence of
Soil Moisture on the Asian and African Monsoons Part I:
Mean Monsoon and Daily Precipitation,” Journal of Cli-
mate, Vol. 14, No. 11, 2001, pp. 2381-2403.
doi:10.1175/1520-0442(2001)014<2381:IOSMOT>2.0.C
O;2
[9] Z. G. Ma, H. L. Wei and C. B. Fu, “Relationship between
Regional Soil Moisture Variation and Climatic Variabil-
ity over East China,” ACTA Meteorological Sinica, Vol.
58, 2000, pp. 278-287. (in Chinese)
[10] C. H. Sun, W. J. Li and Z. Q. Zhang, et al., “Impact of
185
X. L. SHI
Huaihe River Basin Soil Temperature and Humidity Ab-
normality in Pre-Winter and Sprint Time on the Anoma-
lous Summer Rainfall and Its Application,” ACTA Mete-
orological Sinica, Vol. 63, 2005, pp. 115-122. (in Chi-
nese)
[11] Z. H. Lin, X. S. Yang and Y. F. Guo, “Sensitivity of Land
Surface Model to the Initial Condition of Soil Moisture,”
Climate and Environment Research, Vol. 6, 2001, pp.
240-248. (in Chinese)
[12] Y. H. Ding, X. L. Shi, Y. M. Liu, Y. Liu, Q. Q. Li, Y. F.
Qian, M. Q. Miao, G. Q. Zhao and K. Gao, “Multi-Year
Simulations and Experimental Seasonal Prediction for
Rainy Seasons in China by Using a Nested Regional
Climate Model (RegCM_NCC). Part I: Sensitivity
Study,” Advances in Atmospheric Sciences, Vol. 23, No.
3, 2006, pp. 323-341. doi:10.1007/s00376-006-0323-8
[13] K. C. Chow, J. C. L. Chan, X. L. Shi and Y. H. Ding,
“Time-Lagged Effects of Spring Tibetan Plateau Soil
Moisture on the Monsoon over China in Early Summer,”
International Journal of Climatology, Vol. 28, No. 1,
2008, pp. 55-67. doi:10.1002/joc.1511
[14] M. Kanamitsu, W. Ebisuzake, J. Woollen, S. K. Yang, J.
J. Hnilo, M. Fiorino and G. L. Potter, “NCEP-DEO
AMIP-II Reanalysis (R-2),” Bulletin of Atmosphere Me-
teorology Society, Vol. 83, No. 11, 2002, pp.1631-1643.
doi:10.1175/BAMS-83-11-1631
[15] S. Y. Hong and H. L. Pan, “Impact of Soil Moisture
Anomalies on Seasonal Summertime Circulation over
North America in a Regional Climate Model,” Journal of
Geophysical Research, Vol. 105, No. D24, 2000, pp.
29625-29634. doi:10.1029/2000JD900276
[16] M. Rodell, P. R. Houser, A. A. Berg and J. S. Famiglietti,
“Evaluation of 10 Methods for Initializing a Land Surface
Model,” Journal of Hydrometeorology, Vol. 6, No. 2,
2005, pp.146-155. doi:10.1175/JHM414.1
Copyright © 2011 SciRes. ACS