M. A. REVESHTY299
and that major changes in the crop pattern are ongoing.
Many researchers have employed satellite imagery for
land use mapping as well as change detection. Sunar
(1996) has compared the results of five different tech-
niques: band combination, subtraction, band division,
principal component analysis and classification, in Eki-
tally, Turkey [4]. This study revealed that the principal
component analysis (PCA) shows better results compar-
ing with classification results. Gupta and Parakash (1998)
used a combined method of color composite, band sub-
traction, band division and supervised classification to
prepare a land-use map for change detection in a coal-
mining district in India [5]. They concluded that the su-
pervised classification gives better results for detecting
changes. Ahanejad (2002) used PCA, image differencing
and classification methods for change detection in
Maragheh region, Iran. He concluded that a crosstab
method and a comparison image classification method are
very suitable for land use change assessment [6]. Neshat
(2002) employed Markov Chain to detect the change of
forest areas to urban use in Golestan province, Iran [7].
2. Material and Methods
In this paper, Landsat TM images captured in 1984, 1991,
2006 and 2011 are employed for digital image processing.
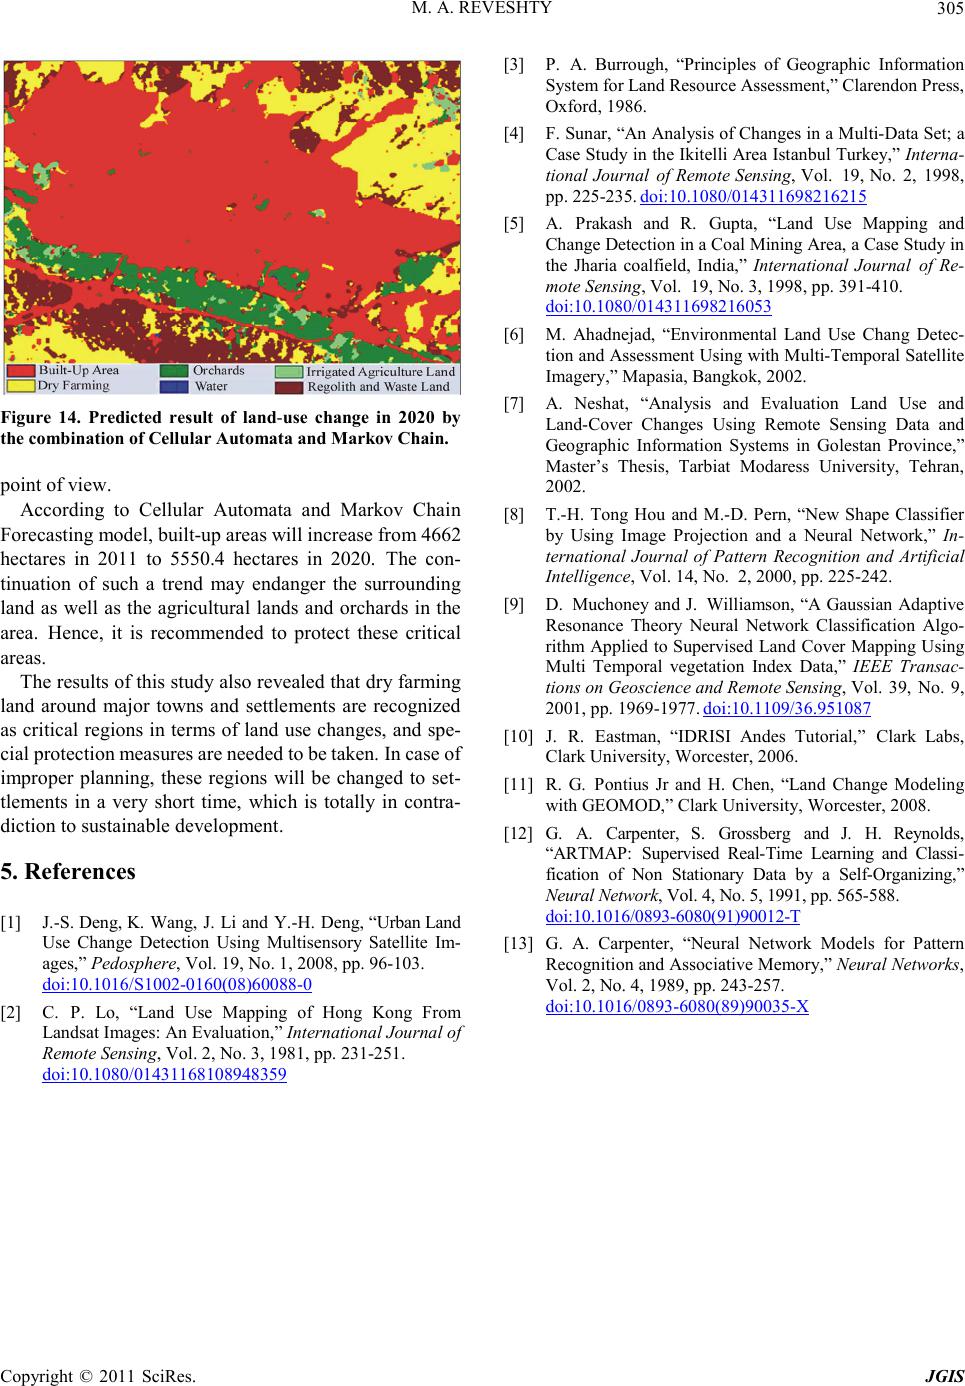
Figure 1 shows Landsat TM image were used in this
study. Also Figure 2 shows the flowchart of this study.
Various methods have been employed for classification
of satellite imagery. Recently, artificial fuzzy methods are
used widely because they show very high accuracy in
comparison with the conventional ones like Maximum
Likelihood Classification (MLC), Minimum Distance
Zanjan Area-Landsat5-1984-02-26 Zanjan Area-Landsat5-1991-06-16
Zanjan Area-Landsat5-2006-09-27 Zanjan Area-Landsat5-2010-06-05
Figure 1 . 741 Landsat TM colo ur composite i mages.
Classification, and Parallelepiped Classification [8,9].
In this paper, the fuzzy adaptive resonance theory
(Fuzzy Artmap) is employed for image classification.
First, 741 RGB color composites of Landsat images were
prepared. Then, training areas were selected for 6 land
use and Land cover classes, which are built-up area,
orchards, irrigated agriculture land, dry farming, water,
regolith and waste land. These training areas were de-
termined, referring to aerial photographs and GIS the-
matic maps. To assess the accuracy of classification,
topographic maps and aerial photos were employed.
Overall accuracy was estimated to be around 96.%
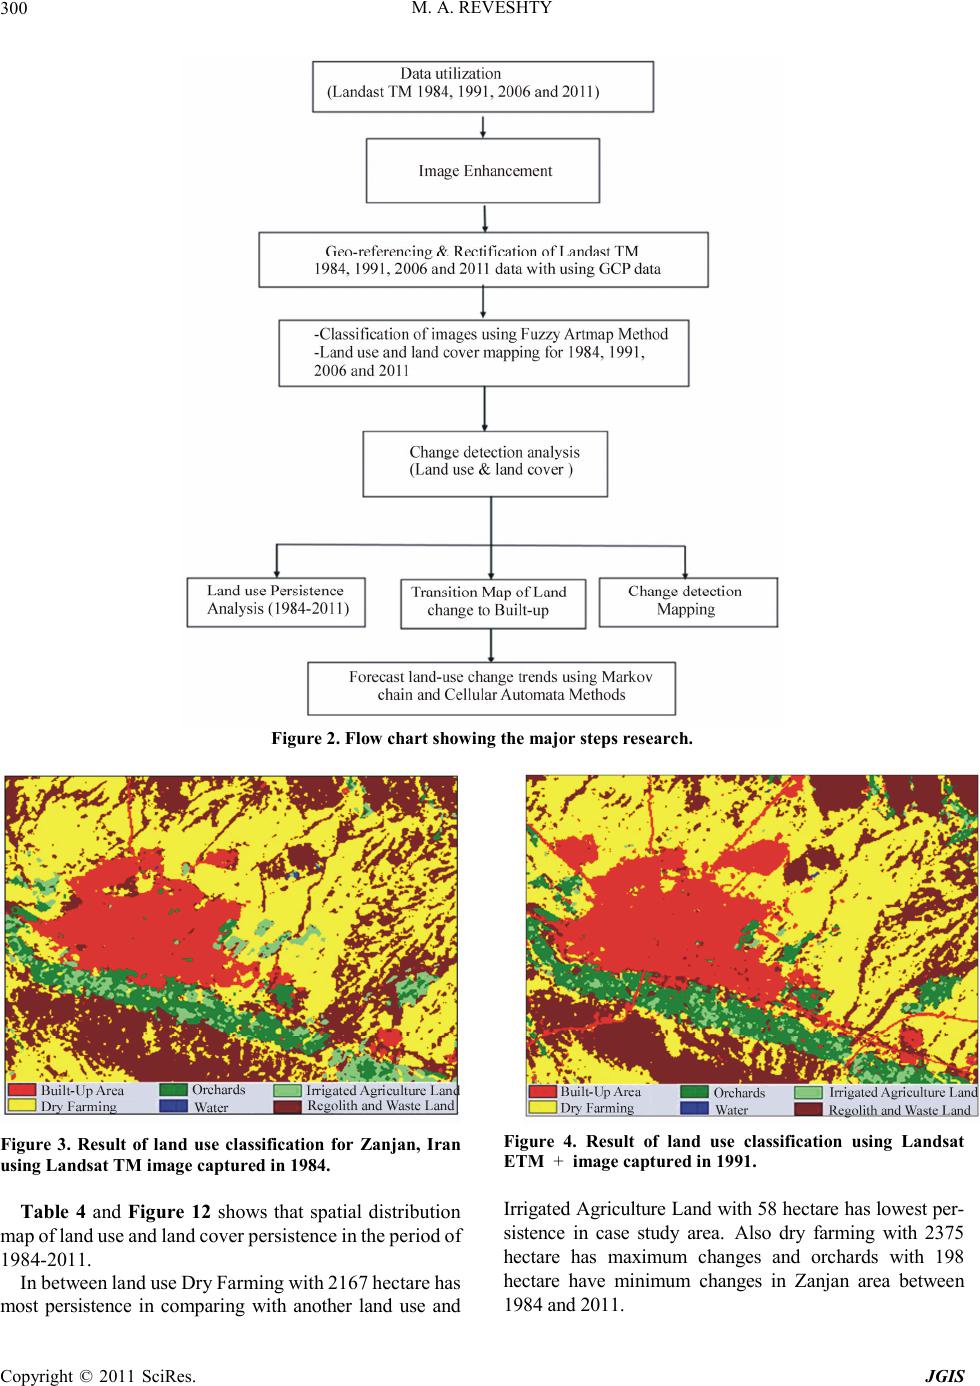
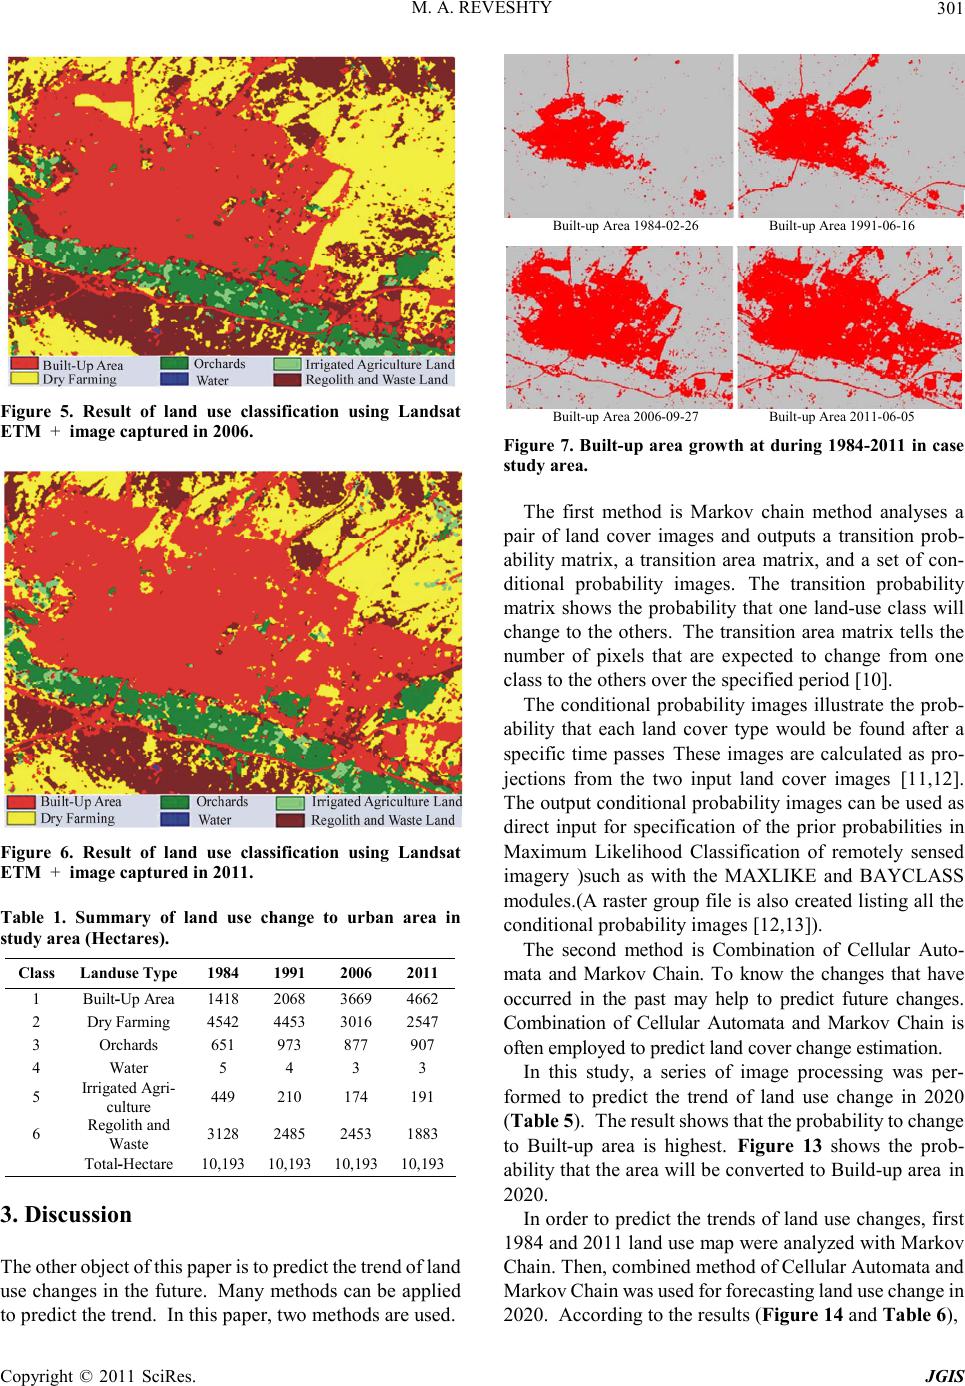
Figures 3 to 6 shows the results of land use classification
and Table 1 shows the summary of the classification.
The classification results for the four different times
revealed that the land use of the target area has changed
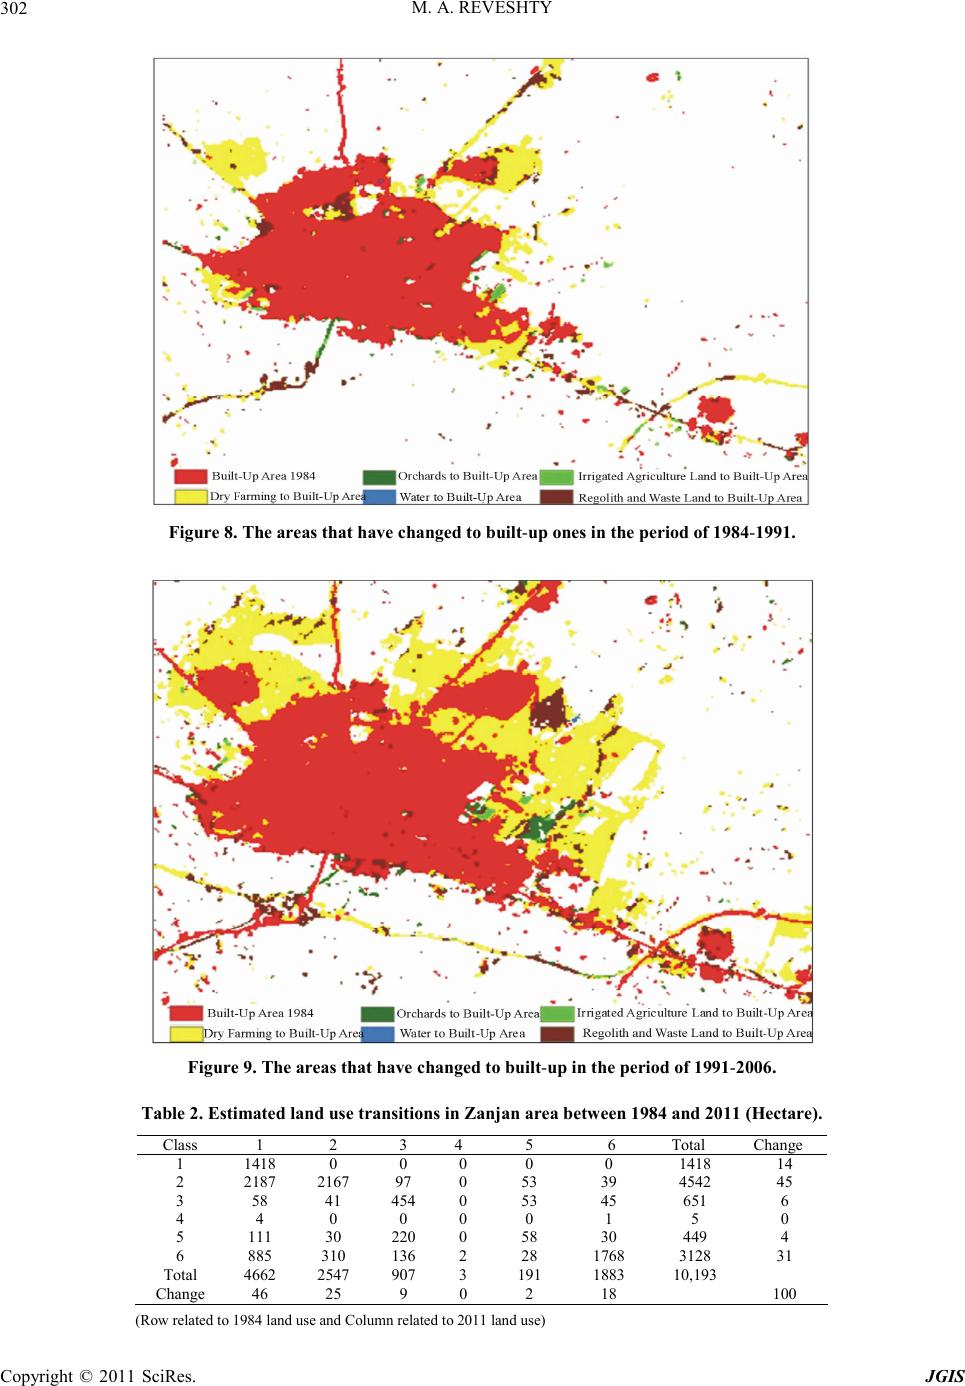
about 44% during the period of 1984-2011. Table 2
shows the estimated land use transitions based on the
comparison of the classification results for the 1984 and
2011 images. More than 68% of the area that belongs to
built-up changes to dry farming and waste areas. Dry
land farming attains the least changes 25% in this period
(Table 2).
The results also show that built -up area changed from
1418 hectare in 1984 to 4662 hectare in 2011. The in-
crease is mainly due to the needs of settlements in Zanjan
City because its population has increased from 215,458 in
1986 to 349,713 in 2006. New suburban areas, such as
Sayan, Elahieh, Amir Kabir, GolShahr and Kazemieh,
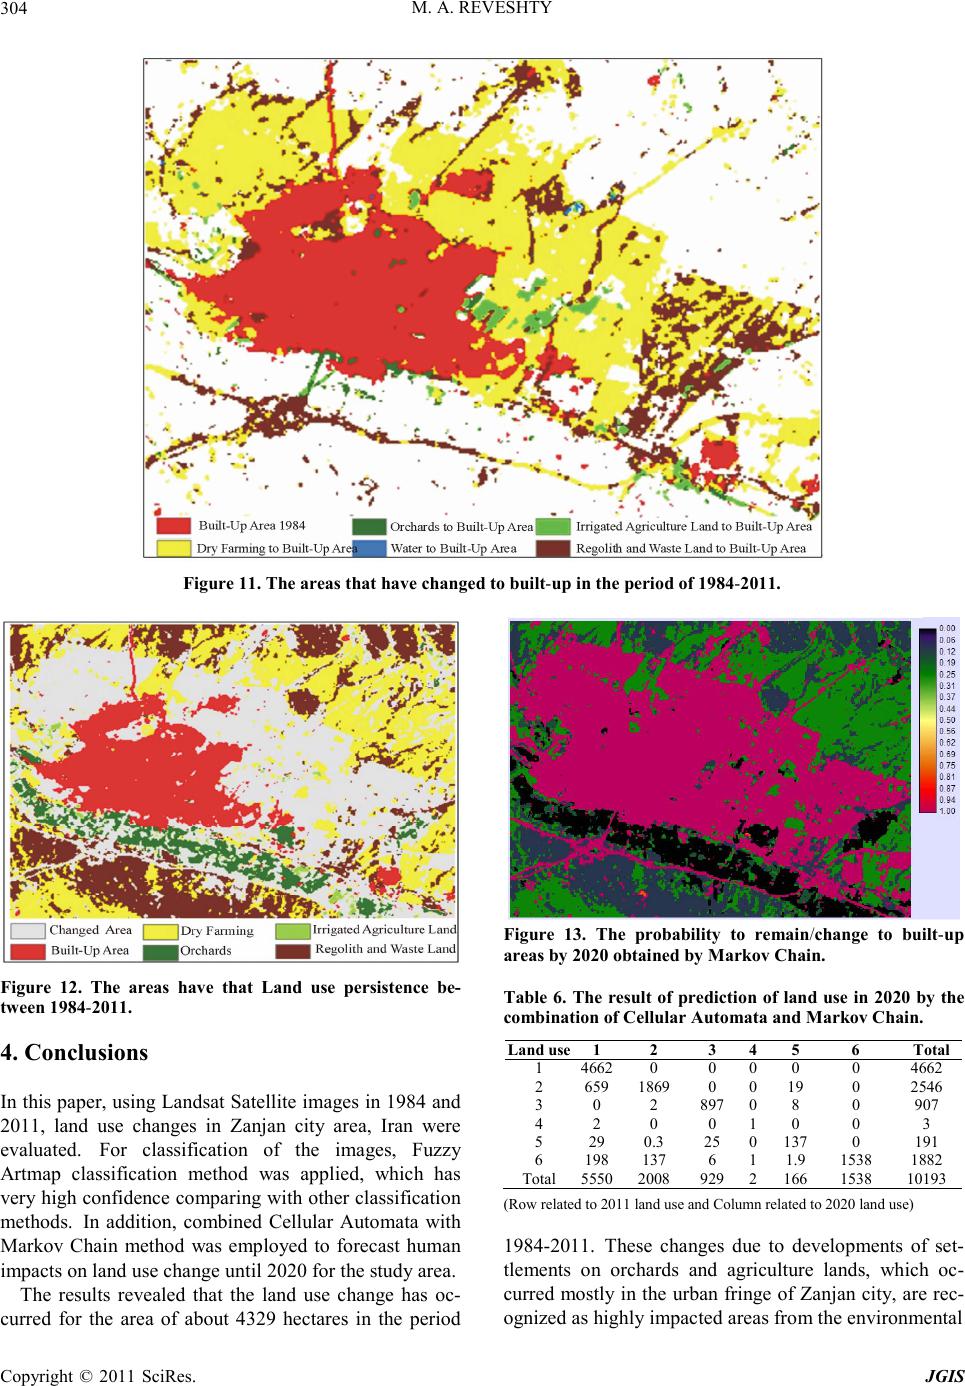
have also developed in the period. Figure 7 shows built-
up area growth in case study area.
The Results of Land use changes analysis show that in
case study area dry farming and regolith and waste land
have most change to built -up area that respectively 2187
and 885 hectares. Also water body and orchards have
minimum changes to built-up area that respectively 4 and
58 hectares. Table 3 shows land use transition to built-up
area in case study area during 1984-1991, 1991-2006 and
2006-2011.
In totally in Land use and Land cover changes in
1984-2011, Built -up area have maximum changes with
47.04 percent and minimum changes related to water
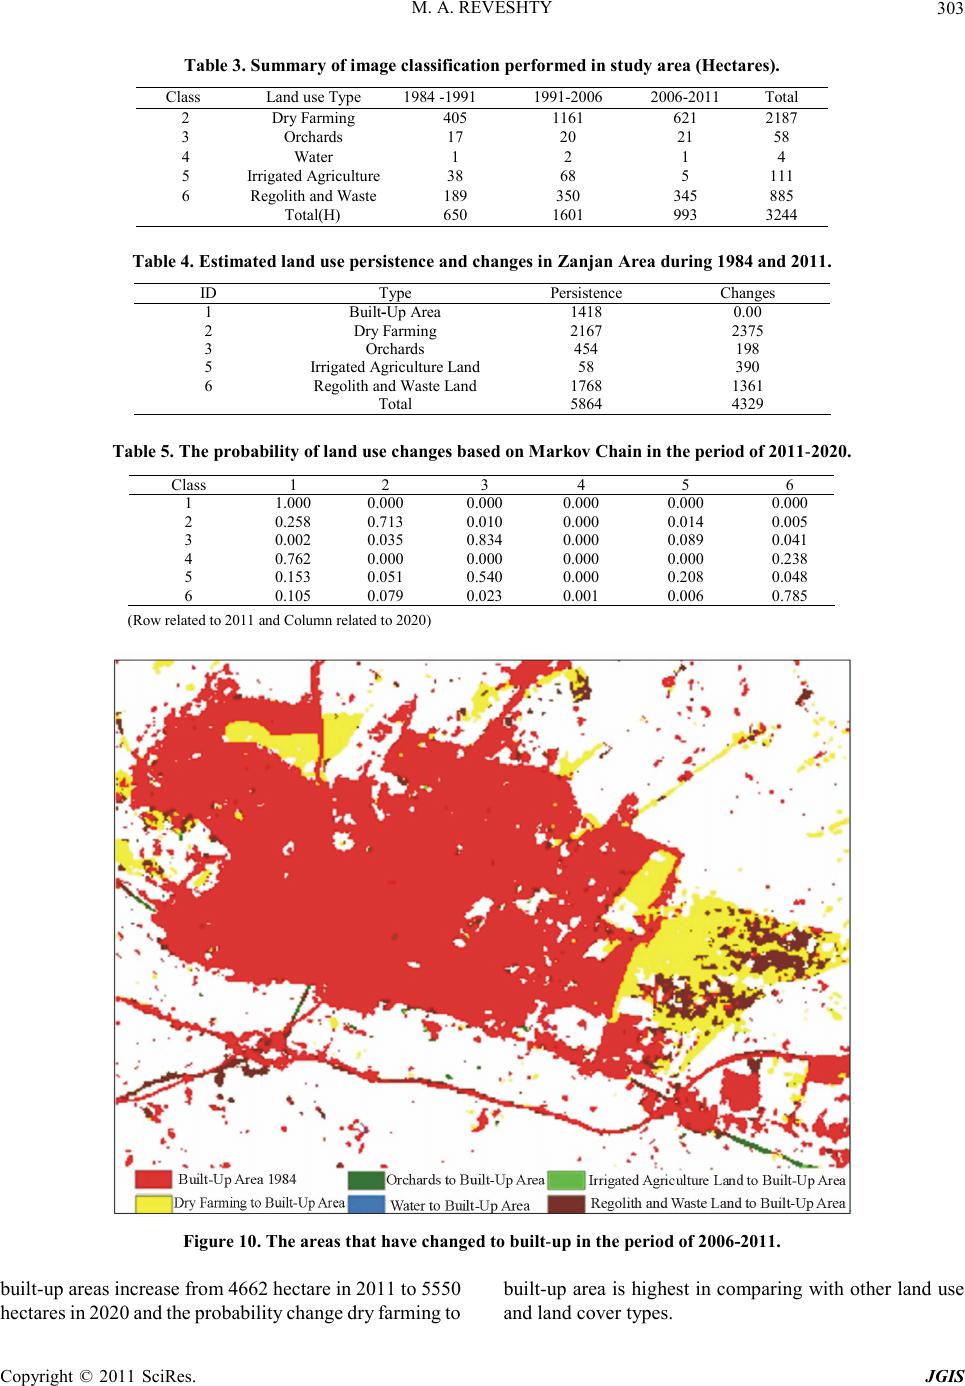
body with 0.01 percent changes. Figures 8-11 shows the
areas that have changed to built -up ones in the period of
1984-2011.
One of other analysis in this paper related to land use
persistence in the period of 1984-2011 in case study area.
It means that how much of land use and land cover and
what areas have persistence in during of study periods and
has not changes. According to analysis in this case study
area about 4329 hectares of land use and land cover have
not any changes and 5864 hectare of land use and land
cover has been changed in the study period 1984-2011.
Copyright © 2011 SciRes. JGIS