 Vol.2, No.6, 445-457 (2009) doi:10.4236/jbise.2009.26065 SciRes Copyright © 2009 Openly accessible at http://www.scirp.org/journal/JBISE/ JBiSE Contrast enhancement methods in sodium MR imaging: a new emerging technique Rakesh Sharma1, Avdhesh Sharma2, Soonjo Kwon3, Ross Booth3 1Department of Medicine, Columbia University, New York, USA; 2Image Processing Lab, Department of Electrical Engineering, Maharana Pratap A&T University, Udaipur Rajasthan, India; 3Biological Engineering, Utah State University, Logan, USA. Email: rs2010@columbia.edu; soonjo.kwon@usu.edu Received 23 August 2008; revised 20 July 2009; accepted 25 July 2009. ABSTRACT Background: In the last decade, sodium mag- netic resonance imaging was investigated for its potential as a functional cardiac imaging tool for ischemia. Later interest was developed in con- trast enhancement for intracellular sodium. Lit- tle success was reported to suppress extracel- lular sodium resulting in the intracellular so- dium MRI image acquisition using quantum fil- ters or sodium transition states as contrast properties. Now its clinical application is ex- panding as a new challenge in brain and other cancer tumors. Contrast enhancement: We highlight the physical principles of sodium MRI in three different pulse sequences using filters (single quantum, multiple quantum, and triple quantum) meant for sodium contrast enhance- ment. The optimization of scan parameters, i.e. times of echo delay (TE), inversion recovery (TI) periods, and utility of Dysprosium (DyPPP) shift contrast agents, enhances contrast in sodium MRI images. Inversion recovery pulse sequence without any shift reagent measures the intra- cellular sodium concentration to evaluate ische- mia, apoptosis and membrane integrity. Mem- brane integrity loss, apoptosis and malignancy are results of growth factor loss and poor epithelial capability related with MRI visible in- tracellular sodium concentration. Applications and limitations: The sodium MR imaging tech- nical advances reduced scan time to distinguish intracellular and extracellular sodium signals in malignant tumors by use of quantum filter tech- niques to generate 3D sodium images without shift regents. We observed the association of malignancy with increased TSC, and reduced apoptosis and epithelial growth factor in breast cancer cells. The validity is still in question. Conclusion: Different modified sodium MRI pulse sequences are research tools of sodium contrast enhancement in brain, cardiac and tumor imaging. The optimized MRI scan pa- rameters in quantum filter techniques generate contrast in intracellular sodium MR images without using invasive contrast shift agents. Still, validity and clinical utility are in question. Keywords: Sodium MRI; Double Quantum; Inver- sion Recovery; Contrast Enhancement; Cancer 1. BACKGROUND Sodium-23 (Na-23) nuclei are in abundance in the body but exhibit poor magnetic resonance sensitivity and serve as sodium MRI clinical imaging modalities. The sodium Na-23 nucleus is detectable by MRI due to its 3/2 spin existing as -3/2, -1/2, 0, ½, 3/2 (5 states). Physical nature of sodium-23 with spin = 3/2 is suitable to have a nonvanishing magnetic moment and Larmor frequency = 11.26 MHz and exhibits four transition states with five different energy levels in the static mag- netic field. MR detection sensitivity is very low (9.3 %) at in vivo concentration (approximately 0.05 %). Sodium is abundant (100 %) in living body tissue in 3/2 spin state. The sodium ion is the predominent cation in the extracellular fluid (139 mmol/L), while its intra- cellular concentration is very low (in the order of 8-10 mmol/L), mainly bound with glycosides and proteins. The role of increased intracellular sodium due to con- certed efflux through Na+/K+ ATP-ase intrinsic action, angiogenesis, and cell proliferation was described in ischemia, hypoxia, arrhythmia, myocardial edema, and tumors [1]. The sodium concentration is sensitive to disease as an indicator of cellular and metabolic integrity. Na-23 concentration in tissues is present in the order of tens of millimoles. The low sodium concentration results in low signal-to-noise ratio of 23Na MR imaging in long imaging times and/or poor spatial resolution. Therefore, it needs the use of shift reagents or pulse sequences with  R. Sharma et al. / J. Biomedical Science and Engineering 2 (2009) 445-457 SciRes Copyright © 2009 Openly accessible at http://www.scirp.org/journal/JBISE/ 446 filters such as single-, double-, triple-, and multiple quantum (SQ, DQ, TQ and MQ) filters to enhance the sodium contrast [2]. Evidence of sodium transfer rates across the blood- brain barrier dates back to its use in MRI [3] followed by the use of spin echo pulse sequence for experimental sodium imaging with first surface coil [4]. Soon after it, in vivo clinical sodium imaging at clinical 1.5 T scan- ners was first described using multislice spin echo pulse sequences [5]. Later developments were made at high magnetic field MRI scanners using ultrashort echo time sequences and hardware improvements that permitted better spatial resolution with shorter imaging times and better quantitative measurements of tissue sodium con- centration without use of shift reagents [6]. This paper describes the phases and roles of quantum filters in pulse sequence design to generate intracellu- lar/extracellular sodium contrast, high signal-to-noise ratio, and high resolution in magnetic resonance sodium images by triple-quantum filter and double inversion recovery pulse sequence without using paramagnetic shift reagents. Triple quantum filter was evaluated as a superior method for high signal-to-noise ratio but needs a long acquisition time [7]. Other available multiple- quantum, single-, and double quantum filter tomographic magnetic resonance pulse sequences generate intracellu- lar sodium images with high signal-to-noise ratio but need paramagnetic shift reagents as contrast agents. 1.1. Nature of Sodium MR Signal At high field magnetic resonance application, the applied phase-cycled radio frequency pulses at set time intervals cause an alignment of nuclei populations within the sample, resulting in a measurable signal in the transverse plane. Optimized times of echo delay (TE) in single-, double-, triple quantum filters; optimized times of inver- sion times (TI) for inversion recovery pulse sequence; and application of a multiple quantum filter after injec- tion of paramagnetic shift contrast reagents detected the distinct intracellular sodium signal to obtain a sodium weighted image. As a result, two sodium MRI signals are achieved with distinct MRI signal intensities to measure sodium intracellular and extracellular concen- trations in the tissue. The MR signal intensity is related with tissue sodium content as follows: The MR signal intensity of Na-23 is: MR sensitivity = % Na-23/H-1. C (Na-23). A.γ. S2+S, where % Na-23/H-1 is sodium abundance, C (Na-23) is tissue concentration, A is MR scanner intrinsic parameter, γ is Gyromagnetic Ratio and S is nuclear spin. Due to the Gyromagnetic Ratio of Na-23 = 11.25 MHz/T relative MR sensitivity is lesser. Moreover, sen- sitivity is further decreased due to less sodium content in the tissue: about 1/1000th MR sensitivity of proton, so it needs use of high magnetic field imaging scanner and data acquisition techniques with contrast enhancement mechanisms, such as MQ, SQ, DQ and TQ. Sodium concentration is higher in blood than that in myocardium and other tissues. This high sodium density in blood contributes to tissue contrast in sodium MR imaging. However, a very small amount of Na-23 is MR visible in free ionic extracellular form due to poor sensitivity. Other intracellular forms of invisible sodium are mainly bound to proteins and phospholipids in the tissue, so intracellular sodium MRI visualization needs quantum filters. 1.2. Quadruple Interactions and Sodium MR Signal Sodium signal is conventionally represented as quadru- ple interactions between Na-23 and its molecular envi- ronment. In sodium nuclei, magnetic resonance excita- tion and subsequent transition of electrons to different energy levels of nuclear spins produce single-, double-, triple-, and multiple quantum sodium transition MR sig- nals as said earlier. These different quantum transitions can be filtered by use of specific SQ, DQ, TQ and MQ pulse sequence techniques by use of selective phases in pulse sequence design as described later. These tech- niques also produce spectral patterns reflecting the per- centage of invisible intracellular sodium. These sodium spectra are iterated superimposed positions of different spectra and represent simulated signals from intracellular sodium in the cytoplasm including interstitium, mito- chondria, intravascular space, and so on. However, this invisible “intracellular” Na-23 results from the presence of a broad frequency peak (T2, very short component). It masks the corresponding frequency peak. Another con- tributory factor to intracellular Na-23 MR invisibility is long correlation times for short and long T2 components. For the heart, the correlation time is in the range of 10-12 to 10-9 seconds. As a result, intracellular sodium is in- visible. The double quantum pulse technique (instead of single quantum pulse technique) selects only double quantum transitions of sodium. These double quantum transitions allow sodium to be more ordered with long correlation time. These pulse sequence techniques visu- alize the intracellular sodium. 1.3. Nature of Sodium Nuclei and MRI Properties The Larmor frequencies of sodium in extracellular and intracellular sodium populations are the same because they have the same resonant frequencies. Therefore, three different approaches are used in distinguishing these two types of sodium nuclei. These include different relaxation times between intracellular and extracellular sodium, the use of paramagnetic shift reagents, and the use of special multi-quantum pulse sequences.  R. Sharma et al. / J. Biomedical Science and Engineering 2 (2009) 445-457 SciRes Copyright © 2009 Openly accessible at http://www.scirp.org/journal/JBISE/ 447 1.4. Sodium Relaxation Times Based on the observation that tissue transverse relaxa- tion time for the intracellular space is smaller than that of extracellular space, intracellular space can be imaged by shortening the spin-echo time. Intracellular sodium signal intensity proportionally increases due to intracel- lular space. Sodium transverse relaxation time (T2) is biexponential in nature, while sodium is bound with negatively charged macromolecules – mainly proteins or metabolites. Perhaps the longitudinal relaxation time (T1) also behaves as biexponential. 1.4.1. Paramagnetic Shift Reagents Paramagnetic shift reagents are chelates of paramagnetic lanthanide ions with anionic complexes. These sub- stances don’t cross the intact cell membranes. These reagents interact with extracellular sodium and introduce a frequency shift in the resonance frequency of extracel- lular sodium. This shift allows the advantage of produc- ing two separate spectral peaks arising from intracellular and extracellular sodium. Common lanthanide ions used as paramagnetic shift reagents are Dy3+ (Dysprosium), Tm3+ (Thulium), Gd3+ (Gadolinium), PPP5- (Tripoly- phosphate), and TTHA6- (Tetraethylene Triaminehexa acetic acid). These reagents bind with intracellular cal- cium and cause physiological disturbances and, in some cases, toxicity, so their use is limited. To overcome such problems, several approaches were recently developed based on the modification of pulse sequences and hard- ware improvements as described in the following sec- tion. 1.5. Quantum Filters These are MR pulse sequences that allow direct observa- tion of multiple quantum transitions. These filters usu- ally are constructed by phase cycling manipulations. The general pulse sequence scheme is 90°-t/2-180°-t/2-90° -π-90°-acquire, where t is creation time and π is evolu- tion time by use of pulsed field gradients. Characteristi- cally, these filters are sensitive to variations in phase cycles up to 5° and magnetic field inhomogeneity. The filter can be single-, double-, triple-, or multiple quan- tum and allow single, double-, triple-, and multiple quantum transitions. In the following sections, we intro- duce readers to our strategy of quantum filters used in sodium MRI pulse sequence design. 1.5.1. Single Quantum Pulse Sequence Due to its multiple spin state transitions, an alternative MR single quantum approach is used to measure intra- cellular Na content based on the interaction of Na poly- anions and their resultant effects on nuclear spin transi- tions. Spin 3/2 nuclei (such as Na-23) have a nonvan- ishing quadrupole moment, allowing interaction with electrostatic field gradients. The pulse sequence is a spin echo sequence. 1.6. Multiple Quantum Pulse Sequence for Origin of Double- and Triple Quantum For intracellular sodium, using only multiple-quantum (MQ) NMR requires paramagnetic shift reagents (SRs) that have distinct disadvantages including: toxicity, pos- sible drug interaction, expanded space, and imperme- ability to the blood brain barrier. It is known that the correlation time, tc of the time variations of the electro- static field gradients in spin 3/2 nuclei satisfies the rela- tion if wLtc >> 1, where wL is the Larmor frequency. These nuclei can display biexponential relaxation and MQ spin transitions do occur in the nuclei and these transitions are detected by specific pulse sequences called multiple- quantum filters. A phase-cycled RF pulse sequence applied over a slice-select axis selects both echo and anti-echo signals of spin undergoing multiple-quantum spin transitions at resonating Larmor frequency. The RF pulse has both a flip angle and a phase angle. The phase angles are cycled using multiple-quantum transition filter and simultane- ously produce an output signal proportional to the sum of echo and anti-echo signals of MQ coherence. It in- cludes the evolution period with a flip angle of 180° to refocus the RF pulse to avoid inhomogeneity-induced amplitude deterioration. This output signal is measured by induction current in the RF coil during the realign- ment process and is used in tomographic MQ transition 23Na MRI images. The pulse sequence comprises: a preparation period of length tP extending from time t0, an evolution period of length te and a detection period of length td. The RF pulse sequence manipulates the selected nuclei to exhibit them with single quantum coherence. During the evolu- tion period, the pulse sequence implements a MQ filter which isolates the coherence (e.g. double- or triple quantum) and simultaneously selects both echo and anti- echo signals corresponding to the coherence by; a) an evolution period first flip angle RF pulse timewise cen- tered at tP which converts the selected nuclei from sin- gle-quantum coherence to the selected multiple- quan- tum coherence; b) an evolution period of second 90° flip angle RF timewise centered at tP+te, converts the se- lected nuclei from multi-quantum to single-quantum coherence. Therefore, during the detection period, se- lected nuclei exhibit single quantum coherence to gener- ate a single quantum signal. The resultant collective phase angle of evolution pe- riod RF pulse= ΦE=Φ3-2Φ4+Φ5, wheree ΦE is collective radio frequency phase during evolution time, and Φ4 & Φ5 are phases of 90° RF pulses. A further preparation period of 90° flip angle radio frequency slice-selecting pulse, a preparation 180° flip angle refocusing pulse, and a detection period 180° flip angle radio frequency are applied – centered at t0, ½ tP and tP+te+1/2 td, respec- tively. The preparatory 90° flip angle RF pulse selects a  R. Sharma et al. / J. Biomedical Science and Engineering 2 (2009) 445-457 SciRes Copyright © 2009 Openly accessible at http://www.scirp.org/journal/JBISE/ 448 slab of sample perpendicular to a slice-selection axis as shown in Figure 1. The preparatory 90° flip angle slice-selection RF pulse has phase angle Φ1, the pre- paratory 180° Rf refocusing pulse has Φ2, and detection period 180° flip angle RF pulse has phase angle ΦP of the RF pulses during preparation time (evolution period 90° flip angle RF phase Φ3) as described earlier(8). The phase angle is ΦP= Φ1-2Φ2+Φ3 and the output signal will be Φ= ΦP-m ΦE+ Φ5+2 Φ6+ ΦR, where m is the integer of magnetization, Φ is the phase of detected signal, and ΦR is the phase of receiver. For double quantum filtered images, m=+2, and for triple quantum filtered images, m=+3. The phases will be Φ1= (n/2)π, Φ2=[n/2+int(n/4)] π, Φ3=(n/2)π, Φ4=Φ5=Φ6=0 and ΦR =nπ for double quantum filter; and phases will be Φ1= (n/3)π, Φ2=[n/3+int(n/6)] π, Φ3=(n/3+1/2)π, Φ4=0, Φ5=(1/6) π, Φ6=0 and ΦR =[n+int(n/6)]π for triple quantum filter, where n/6 is integer part of the variable n/6. The variable n is positive integer of 0…N-1. N is a multiple of 8 and 12 for dou- ble- and triple quantum filters respectively. The magnetic gradient pulse sequence is also applied along with the RF pulse sequence for positional infor- mation in the data. A slice-select gradient pulse, first and second phase encoding gradient pulse, and read-out gra- dient pulse are applied along read-axis after detection period 180° RF refocusing pulse during output signal observed as shown in Figure 1. The read-out pulse area before time tP+te+td is equal to the area of read-out gra- dient pulse. These gradient pulses exhibit simultaneous synchrony with RF pulses. 1.6.1. Inversion Recovery Pulse Sequence The inversion recovery technique can suppress the ex- tracellular sodium nuclei with specific ranges of the lon- Figure 1. The figure illustrates a series of radiofrequency pulses and a synchronized series of magnetic gradient pulses for phase cycled evolution period 180° flip angle refocusing pulse. Figure 2. A scheme of inversion recovery pulse sequence is presented. On top, one cycle of IR with two recovery curves is shown for a single slice. First, 180˚ pulse is flipping the magnetization Mz for first recovery followed by 90˚ pulse for FID and second recovery within TR period. At bottom, the application of two inversion pulses πA and πB is shown for slices A and B with simultaneous application of RF and gradi- ent pulses. gitudinal relaxation time, T1 using fast spin-echo pulse sequence. The sequence has two sets of slice selective inversion pulse trains (long recovery period TI1 for ex- tracellular sodium and short recovery period TI2 for in- tracellular sodium nuclei). The first inversion pulse is played during a long recovery period TI1, during which extracellular sodium magnetization recovers just past its null point while longitudinal magnetizations of intracel- lular sodium nuclei are almost fully restored. The second set of inversion pulse is played during short recovery period TI2, when intracellular Na nuclei magnetizations reach their null points following TI2 interval and become 180° out-of-phase. After inversion pulses, a fast spin- echo acquisition sequence is applied to achieve mag- netization in z-direction (Mz) as following: Mz=M0 [(1-2e-TIe/T1e + e-TR/T1e)(1-2e-TIi/T1i) (1) where ‘e’ represents extracellular sodium nuclei and ‘i’ represents intracellular sodium nuclei. M0 is initial lon- gitudinal magnetization, TI1 & TI2 are long and short inversion times, and T1e & T1i are longitudinal relaxation times of extracellular and intracellular sodium nuclei, respectively. The relaxation time for intracellular Na nuclei varies from 5-10 milliseconds (for Na bound to large molecules or dispersed in highly order environment) to 51 milli- seconds (for extracellular sodium nuclei in free solution). Based on 3D projection reconstruction imaging pulse sequence, echo time TE as short as 0.1 ms can be  R. Sharma et al. / J. Biomedical Science and Engineering 2 (2009) 445-457 SciRes Copyright © 2009 Openly accessible at http://www.scirp.org/journal/JBISE/ 449 achieved. This captures the more rapid decay of short T2 sodium components in the NMR signal so as to further improve the signal to noise (SNR). As shown in Figure 2, radio frequency pulse at 180˚ is followed by a 90˚ pulse for slice excitation utilizing echo-train length with any option of selective or nonse- lective, single or composite, sinc, sech or tyco pulse as needed. So, inversion pulses are played out during in- version TI1 and TI2 periods for both types of sodium nuclei. Data acquired includes projection reconstruction with slice selection or without slice selection using spin-echo or gradient echo. Thus, inversion/acquisition periods are played out for several slices per repetition of fast spin echo (FSE) sequence exhibiting two distinct null points for both sodium nuclei populations. 2. MRI PHYSICS OF CONTRAST ENHANCEMENT BY INVERSION RECOVERY AND TWO NULL POINTS After first 180° RF pulse flips the magnetization from M-z Mz’, the two different inversion times (TI1 and TI2) for two sodium populations exhibit two null points and growth of longitudinal magnetizations. In this sequence, soon after TI, a 90˚ RF pulse is applied to flip the longi- tudinal magnetization into the x-y plane for the T1 growth curve within repetition time TR. At this point, frequency induction decay (FID) is measured when the longitudinal magnetization is flipped into the x-y plane. Thereafter 180˚ RF pulses are repeatedly applied. The magnetization signal ‘S’ may be measured as: [S] α M0(1-2e-TI/T1)(1-eTR/T1), as T1 recovery curves for both 180˚ and 90˚ degree pulses applied. The intracellular and extracellular populations of nu- clei have different longitudinal relaxation times, so they generate intracellular/extracellular sodium contrast. To set the IR pulse sequence to suppress the contribution of sodium nuclei with specific ranges of T1, the inversion time TI1 or TI2 is set as (ln 2)(T1ex), where T1ex is the composite longitudinal relaxation time. This inversion time then determines the time between the 180o and 90o pulses in the IR pulse sequence. 2.1. Projection Reconstruction Methods First, projection reconstruction was proposed based upon Fourier transformation of the FID (free induction decay) signals [9]. Now, these FID signals are obtained by rotating a magnetic field gradient with back-projection to deter- mine the spin-density function or enhanced contrast. So far, this technique has been used only for animal hearts. These signals can be gated to heart rate to reduce the motion artifact. Signals are reconstructed from 12 pro- jections. Each projection is obtained from an average of 320 FID signals. For image matrix 64 x 64 total data acquisition, time is approximately 15 minutes. 2.2. Three-Dimensional Fourier Techniques In this technique, phase-encoding is made in two or- thogonal directions, and a fixed gradient is applied in a third direction of read-out gradient [10]. The pulse- en- coding steps are applied, typically 40 steps along each phase-encoding direction. As a result two echo signals with different spin-echo times are generated and added in a coherent manner to enhance contrast. This phe- nomenon also improves the signal-to-noise ratio. This technique is used for the human brain. In cardiac sodium imaging the utility of this technique is limited to animal heart experiments. Typically short TR = 100 ms is used to get data in 3 hours, including different spin echoes summation. The application of greater sodium signal in the left anterior descending artery was observed in oc- clusion, followed by re-perfusion of circumflex in the coronary artery after ischemia. 2.3. Hybrid Spin Echo Techniques The spin-spin T2 relaxation time of intracellular sodium is shorter than that of the extracellular sodium compart- ment, so it is difficult to observe it to create contrast, and it needs a hybrid spin-echo pulse sequence. In the hybrid approach, both projection-reconstruction and Fourier encoding schemes are used at the same time. Fourier analysis does slice selection in one direction while an- other projection-reconstruction is performed in two other orthogonal directions. This technique is good for clinical MR scanners with gradient refocused sequence with modified head coil to generate echo time as short as 2.8 msec [11]. 2.4. Surface Coil Techniques and Coil Sensitivity Sodium imaging at short T2 relaxation times can be per- formed by use of a customized radio-frequency coil fo- cused on the region-of-interest to improve the signal-to- noise ratio. The pulse sequence is applied with optimiz- ing the minimum saturation time of preamplifier and duration of 90-degree RF pulse. This effect minimizes the magnetic homogeneity influence over the free in- duction image and the short T2 can be imaged. This technique is relatively better than others for human cardiac sodium imaging on clinical scanners. First, using different transmitter gains optimizes the gain for 90° pulse, and different transmitter gains at increased and decreased gain values yields 23Na images at different flip angles of 45°, 90°, and 135° with matrix sizes 32 x 32 x 32 points. Nonlinear least squares fit of the pixels intensities in all three images determines the B1 field strength (for 5% maximum intensity on image) as a function of the related [Na]i image intensities in re- sponse to the local RF coils for receive and transmit sen- sitivities [13].  R. Sharma et al. / J. Biomedical Science and Engineering 2 (2009) 445-457 SciRes Copyright © 2009 Openly accessible at http://www.scirp.org/journal/JBISE/ 450 The image signal intensity depends on coil transmit and coil receive sensitivity as: |)sin(| 0kkkk MRI (2) where Ik is the signal intensity of the kth pixel, Rk is a sensitivity at the coil center, and M0k is the equilibrium magnetization. The flip angle Φk is a function of the transmitter gain setting (TG) as: 20/ )10)( TG kk CR (3) (C · Rk) and M0k were each fitted with a single parameter for each pixel. The constant ‘C’ is independent of spatial position and receives sensitivity. It is also directly pro- portional to the transmit field distribution for the coil [13]. After normalization, the product (C · Rk) yields the relative sensitivity Rk for the kth pixel. The B1 (expressed as B1/2 ) depends on reference transmit power, TGref: ))2(/(10)( 2 20/ 1 p TG k ktCR Bref (4) where tp is the pulse duration. Local field B1 and longitudinal relaxation time T1 determine the correction factors for saturation for each pixel k, SFk as follows: )] 2 cos(1[ ) 2 sin(][ 1 1/ 1 1/ k p TTR k p TTR kB te B te SF (5) where B1k is the B1 field in the respective ROI and is the gyromagnetic ratio for [Na]i using the pulse time tp=0.4 msec, and the TR=120 msec [13]. 2.5. Rotating Frame Techniques Conventionally, sodium imaging can be done using the rotating frame technique based on superimposing a magnetic field gradient on the excitation field B1. As a result, during this excitation period, spatial localization and spatial encoding may be performed very fast to gen- erate sodium contrast. In this process, loss of MR signal intensities is also minimized. In an isolated perfused rabbit heart, sodium-rotating frame imaging experiment was completed in 12 msecs in a 128 x 128-image matrix with a clinical 1.5 T scanner [12]. 2.5.1. Use of Contrast Agents Different shift agents such as dysprosium or Tm (DOTP) contrast agents increase the sensitivity and specificity of sodium MRI by shifting intracellular sodium magnetiza- tion away from extracellular sodium magnetization (ex- hibited well as shifted peaks). Dextran-magnetite in- creases the contrast between tumor and surrounding soft tissue sodium images. Normal reticulo-endothelial cells take up a greater amount of magnetic particles than tu- mor cells do, which supports the potential for tumor so- dium imaging by contrast agents. However, a major role of sodium imaging seems to distinguish myocardial ischemia. Techniques used for sodium in vivo MRI: Several approaches have been used. Despite little success, these techniques are gaining interest in physiological MR im- aging using intracellular sodium. Some landmark tech- niques have been described for image generation. 2.5.2. Spectrally Weighted Twisted Projection Imaging The 3D sodium MRI imaging can be made faster by reducing the T2 signal attenuation effects. This is im- plemented by 3D twisted projection imaging. At high spatial frequencies, the sample density is reduced, and as a result the reduced readout time is achieved. This leads to decreased T2 signal attenuation, which translates into improved signal-to-noise ratio (SNR) without a loss of resolution [14]. 2.5.3. Biexponential Relaxation Effect and Sodium Concentration Mapping Dual-frequency RF coils with identical B1 field distribu- tions at the two different observation frequencies pro- vide sodium and proton mapping. These optimize both dual frequencies in dual quadrature RF coils. Sodium and proton channels are decoupled to make dual-quad- rature birdcage configurations. The fourth harmonic of sodium frequency happens to be very close to proton frequency. This is suitable for echo-planar imaging and metabolite quantification [15]. 2.5.4. 3-D Triple Quantum-Filtered Twisted Projection Na-23 Imaging A new approach was developed based on a three pulse, six-step, coherence transfer filter (with fast twisted pro- jection imaging sequence) to generate spatial maps of the TQ signal. In principle, three pulse coherence filter leads to TQ sodium images. In these images, the image intensity depends on the spatial variation of the flip an- gle. This image intensity is lesser than the flip angle chosen in the four pulse TQ filter. This technique allows the generation of RF inhomogeneity corrected TQ so- dium images after TQ signal variation. The pulse se- quence of TQ filtering is based on spherical tensor op- erators or a density matrix. It consists of three non-se- lective RF pulses, and sometimes a fourth RF pulse be- tween the three first and the second pulses, to refocus the main magnetic field inhomogeneities [16]. In this pulse sequence, RF induces different flip angles as θ30, 2θ30, θ150, θ0…. flip angles where the phase stepped up through the values 30°, 90°, 150°, and so on. The second pulse is intended for the B inhomogeneities refocusing and is absent in the case referred to as “three pulse”. The preparation time is the period between two phases and evolution time is the period between θ150 and θ0.  R. Sharma et al. / J. Biomedical Science and Engineering 2 (2009) 445-457 SciRes Copyright © 2009 Openly accessible at http://www.scirp.org/journal/JBISE/ 451 2.6. Simultaneous Quadruple and Double Quantum Na-23 MR Imaging Na-23 is a quadruple nucleus with biexponential relaxa- tion or non-vanishing quadruple coupling. Both proper- ties contribute to generate Na-23 multiple-quantum (MQ) coherence [17]. The Multiple Quantum Filter pulse se- quence can be represented as Eq.6: (θ1,φ1)-tP/2-(θ2,φ2)-tP/2(θ3,φ3)-tE-(θ4,φ4)-Acq(T,φR), (6) where refocused preparation time, φP and non-refocused evolution time, φE may be represented as Eq.7: 43321 ;2 EP (7) where φ1-4 denote the phase of each RF pulse with flip angle θ1-4, φR is receiver phase, and T is acquisition time, each θ1=π/2 and θ2=π. This sequence is good for detecting well-defined and ordered structures in biological tissues. Both quadru- ple-order and double-quantum signals can be generated simultaneously by the same RF sequence without any loss in signal amplitude. In addition, the acquired MQ signals can be readily decomposed into their second – and third – rank components, i.e. into quadruple order and biexponential relaxation components. This allows reduction of the scan time to acquire MQ signals of dif- ferent coherence orders and ranks, which should prove useful for in vivo studies. 2.7. Double Spin-Echo Imaging and Transverse Relaxation Time This approach of imaging is good for myocardial water content analysis based upon the calculation of transverse relaxation time from dual-quantum spin-echo MRI [18]. Right and left ventricles can be assessed for quantifica- tion of myocardial edema. The transverse relaxation times (T2) of ventricles can be calculated from the signal intensities within multiple regions of interest over myo- cardium as shown in Eq.8: T2 =[(TE2-TE1)/ln(I1/I2)], (8) where TE1 is first echo time, TE2 is second echo time, and I1 & I2 are image amplitudes of first & second spin echoes. 2.8. Double-Quantum-Filtered Na-23 MR Spectroscopy The extracellular EC-Na and intracellular IC-Na con- tents are better visualized by multiple-quantum-filter spectra acquired in the absence of chemical shift or re- laxation reagents. The intracellular IC-Na sensitivity can be enhanced by double-quantum-filter (DQF) Na-23 NMR to measure the detection of Na+ motion anisotropy with the presence of residual quadruple splitting (19). However, the application of this technique is limited to the experimental heart studies using the pulse sequence: 90°-τ/2- 180° -τ/2 -θ-t1-θ-t(Acq), where τ denotes the crea- tion time and t1 is evolution time, θ is RF flip angle. The magnetization M (τ, t, θ) for the MQF Na-23 NMR signal, when the quadruple splitting factor (ωQ) is zero, is given by Eq.9: M(τ, t, θ)=αM0[exp(-τ/T2s) - exp ( -τ/T2f )] x [exp(-t/T*2s )-exp(-t/T*2f)] (9) x sin2θ(1 - 3 cos2θ) where α is a factor which depends on the degree of quantum coherence , M0 is equilibrium magnetization, T2f & T2s are fast & slow transverse relaxation times, and T*2f & T*2s are the corresponding inhomogeneity- broadened times. An important implication for this tech- nique is the possibility of measuring intracellular sodium concentration in animal hearts with the DQF spectrum in the absence of shift or relaxation reagents. Significant attenuation of the DQF spectrum derived from extracel- lular Na+ allows to differentiate the NMR spectrum from intracellular Na+. 2.9. Double Quantum Filtering and Spin-Quantum Coherence Conventionally, the double-quantum filtering method for sodium imaging is completed in a four-step phase-cy- cling scheme. In this process, the radio-frequency pulses generate single-quantum coherence. Its phase appears similar to the phase of a double-quantum coherence sig- nal in the pulse sequence. Consequently, the interse- quence stimulated echo passes through the double- quantum filtration in the phase cycling scheme and gra- dient pulses in the DQ pulse sequence, so the sin- gle-quantum coherence is an unwanted component in this pulse sequence. It is eliminated by the use of spoil- ing RF pulses followed by dephasing gradient pulses incorporated into the DQ filtering pulse sequence. These spoiling pulses disperse the pulse transition and elimi- nate the magnetization components of the intersequence stimulated echo in the DQ pulse sequence [20]. Another good way to eliminate single quantum coherence is to increase the repitition time TR. Moreover, a low signal level of DQ coherence also demands many signal aver- aging at short TR to keep short scan time and not a longer TR. 2.10. Chemical Shift Selective Acquisition of Multiple Quantum-Filtered Na-23 In cardiac imaging, MQ signals over a wide off-reso- nance bandwidth is a problem which causes interference between echo and anti-echo. It is due to a resonance off- set insensitive to the flip angle of the creation RF pulse; usually the second π/2 pulse. Off-resonance effects are applied to eliminate the MQ signal in the presence of a chemical shift. It suppresses the MQ signal over a wide range of off-resonance bandwidth [21]. Existing tech-  R. Sharma et al. / J. Biomedical Science and Engineering 2 (2009) 445-457 SciRes Copyright © 2009 Openly accessible at http://www.scirp.org/journal/JBISE/ 452 niques for chemical-shift-selective acquisition of SQ signals can be combined with MQ off-resonance effects to enhance the selectivity of chemical shift. 2.11. Double Quantum Filtering and Elimination of Intersequence Stimulated Echo In cardiac sodium imaging the ‘intersequence stimulated echo’ is an unwanted component because the phase of this echo has the same properties as that of the dou- ble-quantum (DQ) signal. Using a partition method and computer simulation can eliminate the magnetization components of the intersequence stimulated echo [22]. The DQ filter pulse sequence with non-refocused prepa- ration time (τP) and evolution time (τE) may be ex- pressed as: (θ1,φ1)-τP- (θ2, φ2)-τE-(θ3φ3)-Acq (t2 ,φR), where φn denotes the phase angle of each RF pulse with the flip angle φn; t2 is acquisition or detection time and φR is receiver phase. 2.12. Multiple Quantum Filters of Arbitrary Phases of Na-23 Nuclei These Triple Quantum filtered data acquisition, uses the pulse sequence with arbitrary phase values: 90°(θ1)- t/2 -180°(θ2) - t/2 -90°(θ3) -δ - 90°(θ4) - acq(θ5) (T), where δ is evolution time, t is the acquisition time, θ1, θ2, θ3, θ4, and θ5 are the phase values. Multiple-quantum-filtered (MQF) Na-23 NMR spectroscopy may provide increased sensitivity in detecting IC Na and thus offers the possi- bility of monitoring changes in IC Na content without SR. The amplitude of the MQF spectrum is determined by several factors such as transverse relaxation times, creation times, and the amount of Na that exhibits MQ coherence. By the behavior of relaxation and greater IC-Na MQ coherence, it is possible to have MQF spec- trum with intracellular sodium to measure IC-Na content [23]. 2.13. Spiral Cardiac Respiratory Gate Multi-Shot Functional MRI as Possibility Physiological fluctuations (possibly by sodium) are known to be a major contribution to noise in fMRI data. Cardiac noise adds noise to both the magnitude and phase of the image in regions localized near vessels and ventricles. Another factor, respiratory motion, has both global changes in the phase of image and localized variations in the image magnitude, particularly near ven- tricles. Recently, an empirical model was used to capture the observed features of physiological noise in fMRI data to reduce intracellular ionic noise in fMRI data us- ing a 3-D cylindrical-stack spiral pulse sequence [24]. Briefly, spiral waveforms of sequence were applied on the x and y gradients. The waveforms were designed get low slew rate limited except for the first few points, and their maximum amplitude was 0.75 G/cm to give a 3.8 x 3.8 mm nominal in-plane resolution. Six interleaves were measured by adjusting the spiral waveforms (mul- tiplying the x and y gradients by coefficients of a rota- tion matrix) to effectively rotate the k-space trajectory in the kx - ky plane. At the end of each TR interval, crusher gradients were used to minimize spillover of the FID signal into subsequent intervals. Their amplitudes were set to generate about 3π dephasing over each voxel di- mension of covered volume of interest. It results in a “stacked spirals” k-space acquisition scheme. With the spiral acquisition, all gradient moments, Mn(t), can be shown as Eq.10: Mn(t) = ∫G(t)tndt (10) with t = 0 at the center of the RF pulse, are zero at the center of k-space (t = tc). The zeroth [M0(t)] and first [M1(t)] order moments of the slab select null at gradient at t = tc by using two addi- tional gradient phases after the slice selection lobe. Fur- thermore, the magnetization were nulled at t =TR i.e., M0(t) for the phase encode gradient and M0(t) and M1(t) for the spiral waveforms. These spiral waveforms are made of trapezoid waveforms at amplitude with mini- mum gradient moments. In addition, a phase encoding scheme is inverted and quadratic RF phase modulation is performed to minimize stimulated echoes. Additional gradient pulses can minimize stimulated echoes after acquisition. Another good practice to decrease the scan time is inserting extra ‘dummy views’ to avoid extra acquisitions when the physiological phase corresponds to the view far away from the actual view to acquire, although these ‘dummy views’ reduce fMRI temporal resolution and lead to improper assessment of functional activity & physiological variance. Cardiac ordering shows greater utility due to shorter cardiac periods. It can reduce inter-image variance by using k-space post- processing techniques and may enhance sodium contrast. This technique is very promising but longer scan times are required. 3. CLINICAL SODIUM MRI TRIALS Sodium MRI can be used in anatomical imaging appli- cations in brain, tumors and cardiac cycle (25-29). Spe- cial attention was focused on achieving intracellular so- dium images. Triple Quantum filter in spin echo acquisi- tion mode and inversion recovery methods are consid- ered useful for it without using shift contrast agents. However, the triple-quantum filtered technique requires a very long repetition time. Inversion recovery technique suffers from poor nulling and poor suppression of ex- tracellular or intracellular sodium population (30-31). Moreover, for imaging applications with the resolutions of 64 or 128 pixels, physiological noise corrupt even better regions without variation. These are referred to as ‘ghosts’, and may be shifted away from the area of in-  R. Sharma et al. / J. Biomedical Science and Engineering 2 (2009) 445-457 SciRes Copyright © 2009 http://www.scirp.org/journal/JBISE/ 453 terest or avoided by using the ‘view ordering’ technique. It was done by sorting the views for which physiological period T = T0 (α =1) ‘low frequency sort mode’ or T = T0 x N/2 ‘high frequency sort mode’, where α =N/2, N=total number of views). For cardiac sodium MRI data acquisition in real time, the physiological phase and corresponding view are obtained again and again till all views are expended. Physiological ghosts, phase varia- tion is cause of further inter-image fluctuations in car- diac MRI time course and affect activation related changes in the acquired signal. The sodium concentration may be measured by plac- ing a phantom next to tumor or animal during MR im- aging. The mean sodium concentration per kilogram wet body weight in the region of interest will be: aD b SFR I Na kk k k ][ (13) The coefficients a and b were calculated from the so- dium concentrations C1 and C2 and signal intensities I1 and I2 of the two phantoms as Intracellular sodium concentration measurement: Sev- eral attempts to measure the intracellular sodium con- centration including sodium flame photometry and ion electrodes in serum; ratiometric, electrom beam CT, atomic force (AFM) spectroscopy in tumors; and sodium MRS in myocardium suggested the role of ATP energy and Na+/K+ pump in ischemia & tumor apoptosis. Therapies that alter tumor ion homeostasis or affect/ destroy tumor cell membrane integrity are likely to gen- erate changes that are observable with 23Na MR imaging and sodium concentration measurements [29,31]. For different methods, the concentration of intracellular so- dium can be measured based on NMR peak areas by subtraction or magnetization ratio and intracellular/ex- tracellular volumes as following: 12 11 1 2 2 CC SFR I SFR I ak (14) and 2 22 2aC SFR I b (15) where R1 and R2 are sensitivity factors. In the following section, we describe our experiments in support of increased sodium in malignancy and asso- ciation with apoptosis in breast tumors and epithelial growth factor in breast isolated cancer cells. For simplic- ity, we introduce readers to the biochemical basis of in- creased sodium in tumor cells. The low sodium-hydro- For MQ method, gen exchange kinetics by slow sodium-hydrogen trans- porter is center point. In malignant tumor cells, acidic pH enhances the intracellular sodium that impairs both the sodium-hydrogen transporter ability and Na+/K + pump resulting in reduced [Na+/K+] ATPase enzyme to release sodium (high intracellular sodium concentration inside cells) from mitochondrial oxidation which also triggers cells to slow down apoptosis or other associated epithelial growth factors [high intracellular Na with low apoptosis and EGF]. The low concentration of intracel- lular sodium is sensitive to any malignancy change and serves as a diagnostic rapid MRI imaging assay to test drugs. )(,0 )(,0 )(0 (~][/ ][ ][ 1][ xvMRinR yvM xM MQi MNaVV Mx My Na (11) where [x] and [y] denote the corresponding tissue and standard phantom intracellular sodium concentrations. K is a constant equal to MM0,v (y) /[y]. VR/Vin is the ratio of reference and intracellular volumes in tissue. For DQ method, [Nai+]DQ= {(Ain/Aref)-(intercept)}/(slope) (12) where Ain and Aref represent areas under tissue and phantom intracellular sodium peaks. 3.1. Chemosensitivity Rapid Assays Using Sodium MRI For SQ method, IC[Na] = {Ain/Aout}{Vout/Vin}{EC[Na]} (13) Very limited studies reported the value of intracellular sodium in a chemosensitivity assessment by cell prolif- eration and apoptosis in prostate and breast tumors. However, its applications are expanding to glioma, car- tilage, and liver [32,33]. A technical advance was re- ported using an inversion recovery pulse sequence and optimization of inversion times to achieve intracellular sodium images in less time. Its application was applied in texotere chemosensitivity response to PC 3-induced mouse prostate and MCF 7-induced rat breast tumors as shown in Figure 3. The enhanced contrast of increased intracellular sodium MRI signal was correlated with histopathology characterization of tumor tissues [34,35, Ain and Aout are areas of the SQ 23Na NMR peaks for IC and EC spaces; EC [Na] is extracellular Na concentration. With these measurements, changes can be observed much earlier than with the effects of anatomic remodel- ing. 1H MR imaging FLAIR sequence, use of MR con- trast agents, and T2-weighted imaging along with 23Na MR imaging may improve tumor visualization of a ne- crotic core or proliferating zones by multiparametric analysis methods. Other approaches of enhancement of 3D 23Na images signal-to noise ratio depend on receivers and coils and the twisted-projection imaging pulse se- quence [32]. Openly accessible at  R. Sharma et al. / J. Biomedical Science and Engineering 2 (2009) 445-457 SciRes Copyright © 2009 Openly accessible at http://www.scirp.org/journal/JBISE/ 454 Figure 3. Inversion recovery pulse sequence using optimized inversion time generated high resolution intracellular sodium images of tumor (right on the phantom image) in each panel. On right, a tumor image is enlarged to show regional heterogeneity of MCF 7 induced breast tumor in rat. P represents image of agarose-sodium phantom and alphabets at different points indicate different stages of tumor growing cells to correlate with histology as shown in table to highlight the accuracy of sodium MR signal intensity and tumor pathology staging [36]. Figure 4. A Comparison between normal and malignant hu- man breast epithelial cells (grown in a 2D monolayer and 3D culture matrix) shows a role of EGF in luminal structure for- mation. Normal human breast epithelial (NHBE) cells (grown in the 3D culture matrix) form a luminal structure of normal phenotype. (a) Normal human breast epithelial cells in monolayer without rBME (2D monolayer) with normal EGF, (b) NHBE cells in rBME (3D matrix) with reduced EGF, (c) NHBE cells in rBME (3D) with normal EGF, (d) Malignant human breast epithelial cells (HTB-132 obtained from ATCC) in rBME (3D) with reduced EGF. Notice the role of FGF and the rBME matrix used in association with malignant character- istic of cells. 36]. However, the exact cause of increased TSC is not known. In another set of breast cancer culture cells, we observed the reduced EGF in tissues sensitive to sodium ion homeostasis and metabolic integrity. 3.2. Correlation between Intracellular Sodium Signal and Malignancy Elevated TSC in breast lesions measured by non-inva- sive 23Na MRI appears to be an indicator at the cellular level associated with malignancy. This Na-23 MRI method may have potential to improve the specificity of breast MRI with only a modest increase in scan time per patient [37]. Several physiological and biochemical changes associated with proliferating malignant tumors may cause an increase in total tissue sodium concentra- tion (TSC) as a result of impaired sodium-hydrogen transporter and [Na/K] pump activity resulting in re- duced EGF (Figure 5). Normal and malignant epithelial ductal cells were grown on a reconstituted basement membrane extract (rBME). In the event of the correct signaling from growth factor and extra-cellular matrix proteins, isolated human breast epithelial (HBE) cells formed their origi- nal phenotype in vivo. HBE cells in the absence of re- constituted basement membrane extract (rBME) failed to assemble organized structures, and arrested growth when 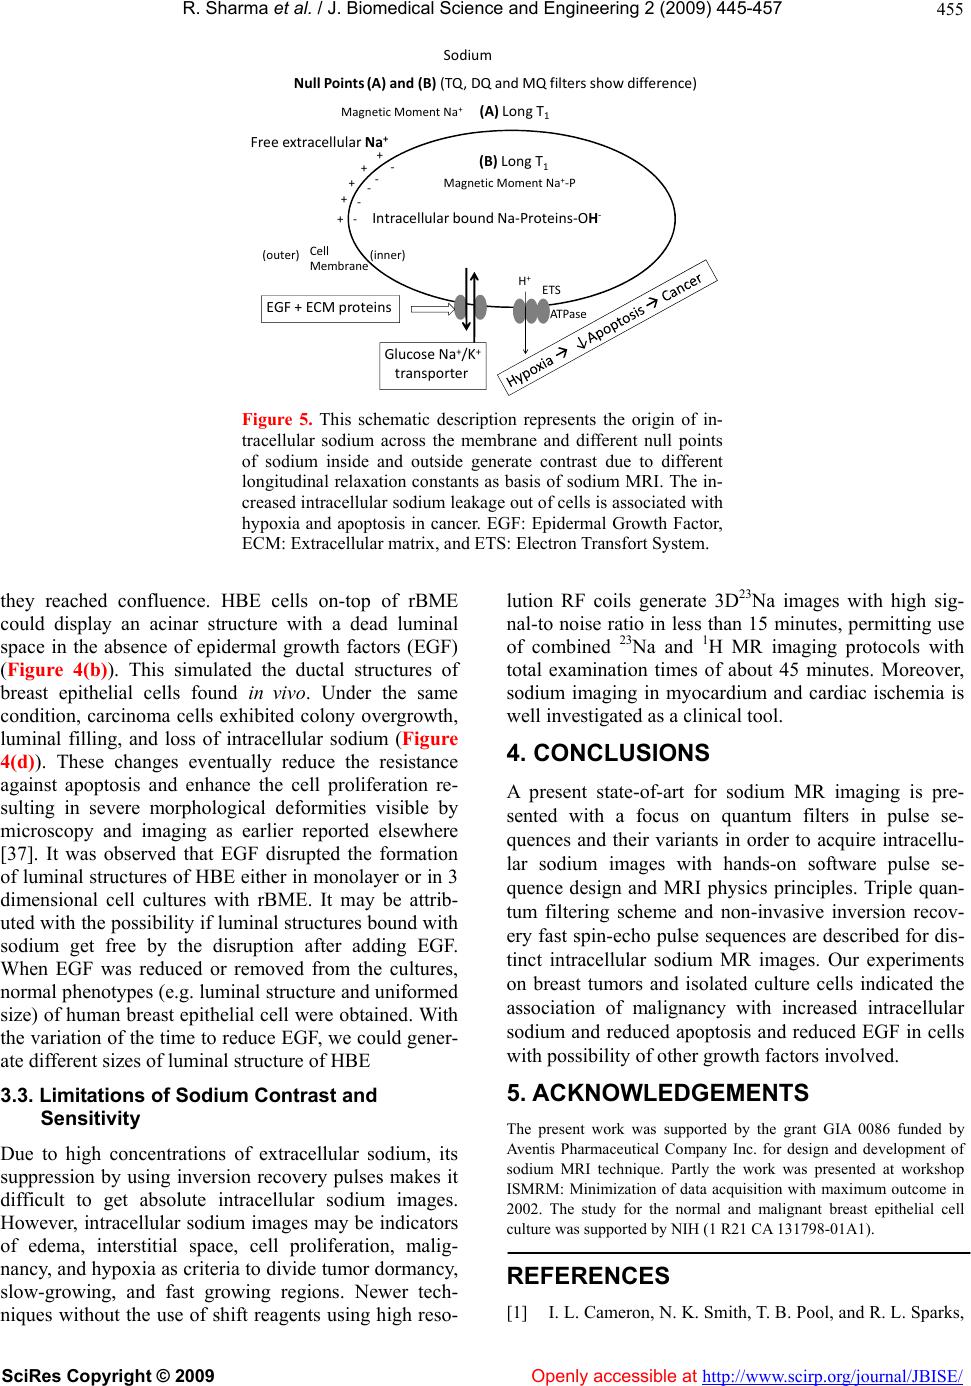 R. Sharma et al. / J. Biomedical Science and Engineering 2 (2009) 445-457 SciRes Copyright © 2009 Openly accessible at http://www.scirp.org/journal/JBISE/ 455 EGF+ECMproteins GlucoseNa + /K + transporter IntracellularboundNa‐Proteins‐OH ‐ NullPoints (A)and(B)(TQ,DQandMQfiltersshowdifference) MagneticMomentNa + MagneticMomentNa + ‐P Freeextr a ce l l u l a r Na + + + + + + ‐ ‐ ‐ ‐ ‐ (A) LongT 1 (B) LongT 1 ATPase H + Cell Membrane (outer) (inner) Sodium ETS Figure 5. This schematic description represents the origin of in- tracellular sodium across the membrane and different null points of sodium inside and outside generate contrast due to different longitudinal relaxation constants as basis of sodium MRI. The in- creased intracellular sodium leakage out of cells is associated with hypoxia and apoptosis in cancer. EGF: Epidermal Growth Factor, ECM: Extracellular matrix, and ETS: Electron Transfort System. they reached confluence. HBE cells on-top of rBME could display an acinar structure with a dead luminal space in the absence of epidermal growth factors (EGF) (Figure 4(b)). This simulated the ductal structures of breast epithelial cells found in vivo. Under the same condition, carcinoma cells exhibited colony overgrowth, luminal filling, and loss of intracellular sodium (Figure 4(d)). These changes eventually reduce the resistance against apoptosis and enhance the cell proliferation re- sulting in severe morphological deformities visible by microscopy and imaging as earlier reported elsewhere [37]. It was observed that EGF disrupted the formation of luminal structures of HBE either in monolayer or in 3 dimensional cell cultures with rBME. It may be attrib- uted with the possibility if luminal structures bound with sodium get free by the disruption after adding EGF. When EGF was reduced or removed from the cultures, normal phenotypes (e.g. luminal structure and uniformed size) of human breast epithelial cell were obtained. With the variation of the time to reduce EGF, we could gener- ate different sizes of luminal structure of HBE 3.3. Limitations of Sodium Contrast and Sensitivity Due to high concentrations of extracellular sodium, its suppression by using inversion recovery pulses makes it difficult to get absolute intracellular sodium images. However, intracellular sodium images may be indicators of edema, interstitial space, cell proliferation, malig- nancy, and hypoxia as criteria to divide tumor dormancy, slow-growing, and fast growing regions. Newer tech- niques without the use of shift reagents using high reso- lution RF coils generate 3D23Na images with high sig- nal-to noise ratio in less than 15 minutes, permitting use of combined 23Na and 1H MR imaging protocols with total examination times of about 45 minutes. Moreover, sodium imaging in myocardium and cardiac ischemia is well investigated as a clinical tool. 4. CONCLUSIONS A present state-of-art for sodium MR imaging is pre- sented with a focus on quantum filters in pulse se- quences and their variants in order to acquire intracellu- lar sodium images with hands-on software pulse se- quence design and MRI physics principles. Triple quan- tum filtering scheme and non-invasive inversion recov- ery fast spin-echo pulse sequences are described for dis- tinct intracellular sodium MR images. Our experiments on breast tumors and isolated culture cells indicated the association of malignancy with increased intracellular sodium and reduced apoptosis and reduced EGF in cells with possibility of other growth factors involved. 5. ACKNOWLEDGEMENTS The present work was supported by the grant GIA 0086 funded by Aventis Pharmaceutical Company Inc. for design and development of sodium MRI technique. Partly the work was presented at workshop ISMRM: Minimization of data acquisition with maximum outcome in 2002. The study for the normal and malignant breast epithelial cell culture was supported by NIH (1 R21 CA 131798-01A1). REFERENCES [1] I. L. Cameron, N. K. Smith, T. B. Pool, and R. L. Sparks,  R. Sharma et al. / J. Biomedical Science and Engineering 2 (2009) 445-457 SciRes Copyright © 2009 Openly accessible at http://www.scirp.org/journal/JBISE/ 456 (1980) Intracellular concentration of sodium and other elements as related to mutagenesis and oncogenesis in vivo, Cancer Res., 40(5), 1493–500. [2] A. Amidsen and M. Schou, (1968) Lithium and the trans- fer rate of sodium across the blood-brain barrier, Psy- chopharmacologia, 12(3), 236–238. [3] B. J. Carroll, L. Steven, R. A. Pope, and B. Davies, (1969) Sodium transfer from plasma to CSF in severe depressive illness, Arch. Gen. Psychiatry, 21(1), 77–81. [4] M. E. Moseley, W. M. Chew, M. C. Nishimura, T. L. Richards, J. Murphy-Boesch, G. B. Young, T. M. Mar- schner, L. H. Pitts, and T. L. James, (1985) In vivo so- dium-23 magnetic resonance surface coil imaging: Ob- serving experimental cerebral ischemia in the rat, Magn. Reson. Imaging, 3(4), 383–387. [5] W. H. Perman, P. A. Turski, L. W., Houston, G. H. Glover, and C. E. Hayes, (1986) Methodology of in vivo human sodium MR imaging at 1.5 T, Radiology, 160(3), 811–820. [6] S. S. Winkler, D. M. Thomasson, K. Sherwood, and W. H. Perman, (1989) Regional T2 and sodium concentration estimates in the normal human brain by sodium-23 MR imaging at 1.5 T, J. Comput. Assist. Tomogr., 13(4), 561– 566. [7] J. M. Dizon, J. S. Tauskela, D. Wise, D. Burkhoff, P. J. Cannon, and J. Katz, (1996) Evaluation of triplequan- tum-filtered 23Na NMR in monitoring of Intracellular Na content in the perfused rat heart: comparison of intra- and extracellular transverse relaxation and spectral ampli- tudes, Magn. Reson. Med., 35(3), 336–345. [8] K. J. Jung and J. Katz, (1996) Chemical-shift-selective acquisition of multiple-quantum-filtered 23Na signal, J. Magn. Reson. B., 112(3), 214–227. [9] P. G. Morris, (1986) Nuclear magnetic resonance imaging in medicine and biology, Clarendon Press, Oxford, Eng- land, 123. [10] S. W. Lee, S. K. Hilal, and Z. H. Cho, (1986) A multinu- clear magnetic resonance imaging technique-simultane- ous proton and sodium imaging, Magn. Reson. Imaging, 4(4), 343–350. [11] P. J. Cannon, A. A. Maudsley, S. K. Hilal, H. E. Simon, and F. Cassidy, (1986) Sodium nuclear magnetic reso- nance imaging of myocardial tissue of dogs after coro- nary artery occlusion and reperfusion, J. Am. Coll. Car- diol., 7(3), 573–579. [12] C. T. Moonen, S. E. Anderson, and S. Unger, (1987) 23Na rotating frame imaging in the perfused rabbit heart using separate transmitter and receiver coils, Magn. Reson. Med., 5(3), 296–301. [13] R. Ouwerkerk, K. B. Bleich, J. S. Gillen, M. G. Pomper, and P. A. Bottomley, (2003) Tissue sodium concentration in human brain tumors as measured with 23Na MR im- aging. Radiology, 227(2), 529–3. [14] F. E. Boada, G. X. Shen, S. Y. Chang, and K. R. Thulborn, (1997) Spectrally weighted twisted projection imaging: reducing T2 signal attenuation effects in fast three-di- mensional sodium imaging, Magn. Reson. Med., 38(6), 1022–1028. [15] I. Hancu, F. E. Boada, and G. X. Shen, (1999) Three- dimensional triple-quantum-filtered (23)Na imaging of in vivo human brain, Magn. Reson. Med., 42(6), 1146– 1154. [16] A. Borthakur, I. Hancu, F. E. Boada, G. X. Shen, E. M. Shapiro, and R. Reddy, (1999) In vivo triple quantum filtered twisted projection sodium MRI of human articu- lar cartilage, J. Magn. Reson., 141(2), 286–290. [17] K. J. Jung, P. J. Cannon, and J. Katz, (1997) Simultane- ous acquisition of quadrupolar order and doublequantum 23Na signals, J. Magn. Reson., 129(2), 130–133. [18] L. M. Boxt, D. Hsu, J. Katz, P. Detweiler, S. McLaughlin, T. J. Kolb, and H. M. Spotnitz, (1993) Estimation of myocardial water content using transverse relaxation time from dual spin-echo magnetic resonance imaging, Magn. Reson. Imaging, 11(3), 375–383. [19] G. X. Shen, J. F. Wu, F. E. Boada, and K. R. Thulborn, (1999) Experimentally verified, theoretical design of dual-tuned, low-pass birdcage radiofrequency resonators for magnetic resonance imaging and magnetic resonance spectroscopy of human brain at 3.0 Tesla, Magn. Reson. Med., 41(2), 68–275. [20] K. J. Jung, J. Katz, L. M. Box, S. K. Hilal, and Z. H. Cho, (1995) Breakthrough of single-quantum coherence and its elimination in double-quantum filtering, J. Magn. Reson. B., 107(3), 235–241. [21] K. J. Jung, J. S. Tauskela, and J. Katz, (1996) New dou- ble-quantum filtering schemes, J. Magn. Reson. B., 112(2), 103–110. [22] K. J. Jung and J. Katz, (1997) Mathematical analysis of generation and elimination of intersequence stimulated echo in double-quantum filtering, J. Magn. Reson., 124 (1), 232–236. [23] J. S. Tauskela, J. M. Dizon, J. Whang, and J. Katz, (1997) Evaluation of multiple-quantum-filtered 23Na NMR in monitoring intracellular Na content in the isolated per- fused rat heart in the absence of a hemical-shift reagent, J. Magn. Reson., 127(1), 115–127. [24] V. A. Stenger, S. Peltier, F. E. Boada, and D. C. Noll, (1999) 3D spiral cardiac/respiratory ordered fMRI data acquisition at 3 Tesla, Magn. Reson. Med., 41(5), 983– 991. [25] H. Serrai, A. Borthakur, L. Senhadji, and R. Reddy, (2000) Bansal, N. Time-domain quantification of multi- ple-quantum-filtered (23)Na signal using continuous wavelet transform analysis, J. Magn. Reson. 142(2), 341–347. [26] J. B. Ra, S. K. Hilal, C. H. Oh, and I. K. Mun, (1988) In vivo magnetic resonance imaging of sodium in the hu- man body. Magn Reson Med., 7(1), 11–22. [27] S. K. Hilal, A. A. Maudsley, J. B. Ra, H. E. Simon, P. Roschmann, S. Wittekoek, Z. H. Cho, and S. K. Mun, (1985) In vivo NMR imaging of sodium-23 in the human head, J Comput Assist Tomogr, 9 (1), 1–7. [28] T. Hashimoto, H. Ikehira, H. Fukuda, A. Yamaura, O. Watanabe, Y. Tateno, R. Tanaka, and H. E. Simon, (1991) In vivo sodium-23 MRI in brain tumors: Evaluation of preliminary clinical experience, Am J Physiol Imaging, 6(2), 74–80. [29] K. L. Allen, A. L. Busza, S. R. Williams, and S. C. Wil- liams (1994) Early changes in cerebral sodium distribu- tion following ischaemia monitored by 23Na magnetic resonance imaging, Magn Reson Imaging, 12(6), 895– 900. [30] R. Sharma and R. P. Kline, (2004) Chemosensitivity assay in mice prostate tumor: Preliminary report of flow  R. Sharma et al. / J. Biomedical Science and Engineering 2 (2009) 445-457 SciRes Copyright © 2009 http://www.scirp.org/journal/JBISE/Openly accessible at 457 cytometry, DNA fragmentation, ion ratiometric methods of anti-neoplastic drug monitoring. Cancer Cell Interna- tional Cancer Cell International, 4(3). [31] R. P. Kline, E. X. Wu, D. P. Petrylak, M. Szabolcs, P. O. Alderson, M. L. Weisfeldt, P. Cannon, and J. Katz, (2000) Rapid in vivo monitoring of chemotherapeutic response using weighted sodium magnetic resonance imaging, Clin Cancer Res., 6(6), 2146–56. [32] P. M. Winter, V. Seshan, J. D. Makos, A. D. Sherry, C. R. Malloy, and N. Bansal, (1998) Quantitation of intracellu- lar [Na+] in vivo by using TmDOTP5-as an NMR shift reagent and extracellular marker, J Appl Physiol. 85(5), 1806–12. [33] P. M. Winter, H. Poptani, and N. Bansal, (2001) Effects of chemotherapy by 1,3-bis(2-chloroethyl)-1-nitrosourea on single-quantum- and triple-quantum-filtered 23Na and 31P nuclear magnetic resonance of the subcutaneously implanted 9L glioma, Cancer Res., 61(5). [34] J. M. Colet, N. Bansal, C. R. Malloy, and A. D. Sherry, (1999) Multiple quantum filtered 23Na NMR spectros- copy of the isolated, perfused rat liver, Magn Reson Med. 41(6), 1127–35. [35] R. Sharma, R. P. Kline, E. X. Wu, and J. K. Katz, (2005) Rapid in vivo Taxotere quantitative chemosensitivity re- sponse by 4.23 Tesla sodium MRI and histo-immu- nostaining features in N-Methyl-N-Nitrosourea induced breast tumors in rats, Cancer Cell International, 5, 26. [36] R. Sharma, (2008) Extended expression for transverse magnetization using four pulse sequence to construct double quantum filter of arbitrary phases for spin 3/2 so- dium nuclei, International J. Computer Research, 16(4), 371–388. [37] R. Ouwerkerk, M. A. Jacobs, K. J. Macura, A. C. Wolff, V. Stearns, and S. D. Mezban, N. F. Khouri, D. A. Bluemke, and P. A. Bottomley, (2007) Elevated tissue sodium concentration in malignant breast lesions de- tected with non-invasive 23Na MRI, Breast Cancer Re- search and Treatment, 106(2), 151–60.
|