Journal of Water Resource and Protection
Vol.3 No.2(2011), Article ID:4062,7 pages DOI:10.4236/jwarp.2011.32017
Optimization on Water Resource System Operation Policy during Drought
1Hydraulic Science and Engineering College, Yangzhou University, Yangzhou, China
2Shaw Environmental & Infrastructure, Inc., Baton Rouge, Louisiana, USA
E-mail: hyfang4936@yahoo.com.cn, song-kai.yan@shawgrp.com
Received January 9, 2011; revised January 29, 2011; accepted February 18, 2011
Keywords: Water supply system, Drought period, Multi-objective mixed integer linear programming, Decomposition-Adjustment algorithm, Operation policy optimization
ABSTRACT
The mixed linear programming model is commonly recognized to be an effective means for searching optimal reservoir operation policy in water resources system. In this paper a multi-objective mixed integer linear programming model is set up to obtain the optimal operation policy of multi-reservoir water supply system during drought, which is able to consider the operation rule of reservoir-group system within longer-term successive drought periods, according to the basic connotation of indexes expressing the water-supply risk of reservoir during drought, that is, reliability, resilience and vulnerability of reservoir water supply, and mathematical programming principles. The model-solving procedures, particularly, the decomposition-adjustment algorithm, are proposed based on characteristics of the model structure. The principle of modelsolving technique is to decompose the complex system into several smaller sub-systems on which some ease-solving mathematical models may be established. The objective of this optimization model aims at maximizing the reliability of water supply and minimizing the maximum water-shortage of single time-period within water-supply system during drought. The multi-objective mixed integer linear programming model and proposed solving procedures are applied to a case study of reservoir-group water-supply system in Huanghe-Huaihe River Basin, China. The desired water-shortage distribution within the system operation term and the maximum shortage of single time-period are achieved. The results of case study verifies that the lighter water-shortage distributed evenly among several time-periods can avoid the calamities resulted from severe water shortage concentrated on a few time-periods during drought.
1. Introduction
The operation management of water-supply system during drought is one of important affairs in water resources planning and management. The effective operation of water-supply projects is a key point for mitigating regional drought disasters resulted from water-deficiency [1-8]. Hashimoto et al. [8] and Shih et al. [9] proposed the indexes of reliability, resilience and vulnerability which expressed reservoir operation performance during drought, and recognized that these indexes should form the risk assessment system for reservoir water-supply. The three indexes have been applied extensively into the researches on water resources planning and management since they were put forward, and the application of the performance index into planning design and operation simulation of reservoirs has gone through a process from simple description to complicated employment.
Many researches results and practical experience about operation management of water resources system indicated that severe shortages among a small number of time-periods in water-supply system may result in tremendous destroy of social, economical and eco-environmental system; while light shortage among a lot successive time-periods shall mitigate disaster degree of water-deficiency to a great extent, even if the maximum water shortage of single time-period is controlled within a proper range, the disaster will be lighten obviously, provided there were the careful meet-emergency program for water supply and effective management measures for social and economical consumption during drought. It is not enough profound so far to study the perfect operation policy, performance and water-supply risk assessment for reservoir-group system in arid periods. Although there had been some researches for single reservoir operation within shorter drought duration, the explorations on multi-reservoir operation properties within longer drought duration have not emerged. The researches on reservoir-group operation performance for longer drought duration have the practical value and universality significance, because the longer drought duration cause the relative severe destructiveness for society, economy and environment; and modern integrated water resources system pressingly need a long-term operation program which is able to concern various water-supply projects and many kinds of water sources usage [10,11]. Therefore, the present work is to study the mathematical model to obtain the operation policy of reservoir-group water-supply system within successive drought periods, and propose the model-solving method.
2. Methodology
The mixed integer optimization model for single reservoir operation during drought periods can be set up by bringing the operation performance index, namely reliability, resilience and vulnerability, into a regular linear programming model, which is multi-objective decision-making model to maximize the reliability and resilience of reservoir water supply and minimize the water-shortage of single timeperiod [2,12,13]. The 0-1 type integer variables have to be introduced into the model because of considering the reliability and resilience of reservoir water supply. Generally speaking, there are only two kinds of basic connection types, called as series connection and parallel connection, among reservoirs position relationship, although reservoirs position relationship patterns are various in real water resources systems. In order to make present research work have a typical sense and fit the water-supply system characteristics in application example, the mathematical model of reservoir-group system operation optimization for drought is set up based on the reservoirs connection structure shown in Figure 1, where Reservoir 1 and 2 are connected parallel which both themselves have independent water-supply zone each other, and Reservoir 3 is located at lower reaches which water-supply zone is supplied with release from Reservoir 1 and 2, besides Reservoir 3.
2.1. Constraints
Water Quantity Balance Constraints
For reservoir 1 and 2,
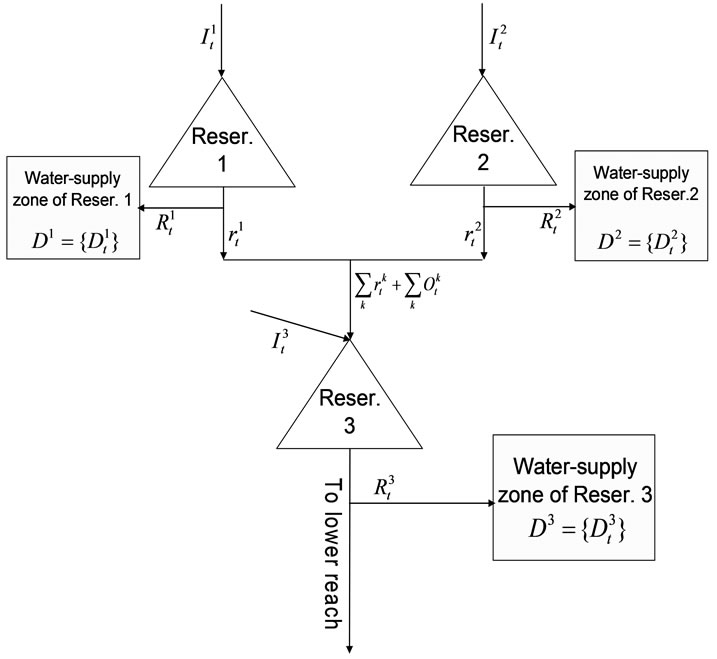
Figure 1. The reservoir-group water-supply system scheme.
 ,
,  (1)
(1)
 ,
,  (2)
(2)
For reservoir 3,
 ,
,
 (3)
(3)
In equations (1)-(3),  ,
,  is the beginning storage and ending storage of Reservoir k at time-period t (k=1,2,3); Itk is the inflow into reservoir k at time-period t;
  is the release from Reservoir k to the independent water-supply zone of Reservoir k during time-period t; rtk is the release from Reservoir k into the water-supply zone at lower reaches(that is the third zone); Otk is the overflow of Reservoir k during time-period t; Etk is the evaporation and seepage loss of reservoir k during timeperiod t, which is calculated in term of the linear function of average storage of Reservoir k during timeperiod t. t is the time-period variable, n is the term length of reservoirs operation analysis.
Reservoir Capacity Constraints
 (4)
(4)
The Ck is the effective capacity of Reservoir k. In order to care for reservoirs operation performance in next possible drought and eco-environment protection aim of arid period, it is suitable that the starting storage of Reservoir k,  is requested not to be less than the ending storage of operation term
 , that is
 (5)
(5)
Constraints on Relationship between Release and Water Demand
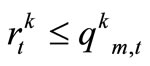
 ,
, (6)
(6)
 ,
, (7)
(7)
 ,
,  (8)
(8)
 ,
, (9)
(9)
 ,
, (10)
(10)
 ,
,  (11)
(11)
where:  is the sum of water-demand target of Reservoir k water-supply zone at the time-period t, which is composed of urban water-demand(including domestic and industrial demand)
 , and agricultural water-demand
 , and urban water-supply is prior to agricultural water-supply.
  is the shortage of urban watersupply of Reservoir k water-supply zone at the time-period t, which is the difference between urban water-demand and water-supply;
  is the shortage of agricultural water-supply at the time-period t.
  is the maximum shortage of single time-period of Reservoir k water-supply zone.
  is the indicating variable to describe urban water supply state, which takes 0 or 1, and 0 indicates that there is some water shortage during time-period t while 1 indicates that urban water-supply is completely met.
  is the indicating variable to describe the Reservoir k water-supply condition, also 0-1 type variable; 0 indicates that the demand of Reservoir k water-supply zone is satisfied and 1 expresses the existence of some water shortage. Constraints (7)-(10) imply that if the release from Reservoir k at the time-period t is less than
 , let
, let , that is there is the shortage of urban water-supply; and constraints (9)-(10) can force the shortage of agriculture water-supply to exist. Otherwise, if the release from Reservoir k at the time-period t is greater than
 , let
, let , which implicates there is not any shortage in urban water-supply, but there will be or not be some shortage in agriculture water-supply. Under such situation, if some shortage exists at the timeperiod t, certainly, it is the lack of agriculture water-supply, that is
  and
and . Constraint (11) restricts the maximum shortage for Reservoir k water-supply zone to
 , among all of time-periods.
Reservoir Overflow Constraints
 ,
, (12)
(12)
 ,
, (13)
(13)
The btk is the indicator for describing the overflow condition of Reservoir k at the time-period t, which takes 0 or 1, 1 for overflow from reservoir occurring and 0 for not occurring. If the available storage of reservoir k at the end of time-period t exceeds Ck, then ; otherwise, the condition of
  will cause
 , the overflow from Reservoir k does not happen at time-period t.
Constraints for Avoiding Occurring of Shortage and Overflow at the Same Time-Period
 ,
, (14)
(14)
Satisfying this equation can avoid the occurrence of shortage and overflow at the same time-period t.
Constraints on Distribution of Shortage Time-Periods
 (15)
(15)
 ,
, (16)
(16)
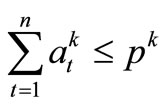
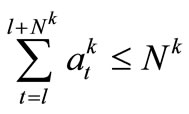
Equation (15) is the constraints on the sum of watershortage time-periods within reservoir operation term, which is the alternative constraint for assurance rate of water-supply reliability. Equation (16) is the constraints on the successive time-periods number when water demand can not be satisfied. In which l is the starting time of successive time-periods, Nk is the permitted maximum number of successive time-periods, pk is the target of water-supply reliability. Generally, Nk and pk should be determined according to the real situation of each reservoir water-supply zone, but in the present work, the identical N and p were used for each zone in the water-supply system.
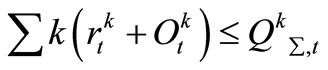
Constraints on Cannel Discharge Capacity
 ,
,  (17)
(17)
 ,
, (18)
(18)
 ,
,  (19)
(19)
The Qkm,t,qkm,t and Qk∑,t are the discharge capacity of cannels.
2.2. Model Variables
The non-integer variables include ,
,  ,
,  ,
,  ,
,  , and
, and , and the integer variables are
 ,
,  ,
,  , and
, and . All of variables must be positive.
2.3. Objective Function
A multi-objective decision-making model can be set up, based on the principle that maximizes the reliability and resilience and minimizes the vulnerability of water-supply system [14]. According to the available experience of reservoir regulation, the resilience implies that how the water-supply restores the normal condition as quickly as possible, once the water shortage occurs. The resilience index is able to be achieved through limiting the lasting length of successive time-periods of shortage, and constraint (16) had reflected the restriction of the index.
Therefore, the objective of mixed-integer programming model can be considered as maximizing the reliability of water supply and minimizing the maximum water-shortage of single time-period. Because the water supply system was divided into several reservoir watersupply zones, and there may be the maximum shortage of single time-period every zone, the multi-objective function should be expressed as
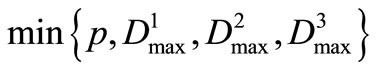 (20)
(20)
Through using linear weight method, the equipollence of above objective function is
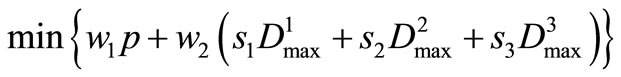 (21)
(21)
where w1, w2 are the weights for the reliability and the maximum water shortage of single time-period, respectively. The weights s1, s2 and s3 stress the relative importance of each reservoir water-supply zone, which theoretically should be computed in term of the constituent of water-demand types and the water-demand sum in each reservoir water-supply zone, the preferential order of every water-demand type and reliability requirement. But in present study, weights s1, s2 and s3 were determined by evaluating the ratio of water-demand of each reservoir water-supply zone into the total water demand of the system.
In order to eliminate the impacts of distinction of dimension and quantity between p and Dmax on decision-making, it is suggested that the reliability of water-supply is represented as the ratio pk/n, while the maximum shortage of single time-period is replaced by the ratio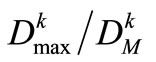 , in which
  is the maximum water-demand of single time-period in Reservoir k water-supply zone.
2.4. Model Solving Procedures
The multi-objective mixed-integer programming model composed of Equations (1)-(21) can be solved using the branch-bound method [13,15,16]. But obviously, the model will possess numerous variables and constraints, and be a large-scale mathematical problem to be solved difficultly, if a large number of time-periods is requested for water-supply system operation analysis.
In the multi-objective mixed-integer programming model based upon the scheme of reservoir-group water-supply system shown by Figure 1, the relationship among Reservoir 1, 2 and 3 are characterized by the connected variable rtk as well . It implies that during drought periods of the water-supply system, under the condition that the demands of Reservoir 1 and 2 water-supply zones are satisfied, the surplus water in Reservoir 1 and 2 should be released into Reservoir 3 water-supply zone to meet the requirement of the zone. Therefore, operational rules of Reservoir 3 are affected by the release from Reservoir 1 and 2.
The system decomposition algorithm was widely applied into integrated simulation for water quality and quantity of watershed [17,18]. The principle of algorithm is to decompose the complex system into several smaller sub-systems which may be treated with. Based on the system decomposition algorithm, following is the proposed solving model procedures.
Step 1. The mixed-integer programming model for single reservoir operation is solved, under the objective of maximizing ∑trtk, to obtain the maximum releases from Reservoir 1 and 2,  , according to the given time-periods number of water shortage p and various maximum shortage of single time-period
 . The maximum shortage of single time-period is not certainly greater than the maximum water-demand of time-period,
 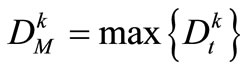 , therefore, the value of
  may be designed within range [0,
 ]. The reliability index p is given based on the water-supply assurance rate of the system.
Step 2. The maximum releases from reservoirs at upper reaches will be considered as a part of inflow into the reservoir at lower reaches, then under the objective of minimizing , the operation policy of Reservoir 3 for drought period is found.
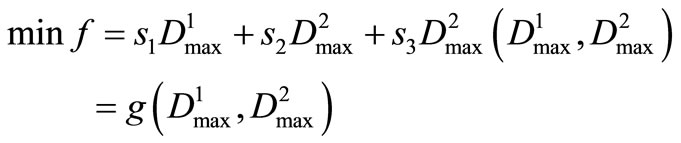
Step 3. Obviously, any optimal operation policy of reservoir 3 is relevant to some programs of releases from reservoirs at upper reaches. The optimal operation policy of reservoir-group must be searched for under the given permitted time-period number of water-shortage and following objective
 (22)
(22)
where f is the comprehensive value of objective. The operation policy for Reservoir 3 correlates highly with operation for Reservoir 1 and Reservoir 2, therefore,  is a nonlinear function g(.) with variables
  and
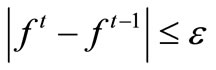
and . In step 3, the optimal operation policy of reservoir-group is obtained by using the coordinates alternating search method. That is one variable is searched for the optimal value, at the same time, other variables are fixed to some values. Through iteration progress, the converge criterion to stop searching for the optimal solution is expressed as
 (23)
(23)
In equation (23),  ,
,  is the minimum comprehensive value of objective at the i-th and (i-1)-th iteration computation, ε is a given allowance precision. For single variable
  of Reservoir 1 or
  of Reservoir 2, a field for searching for the optimal policy is formed through dividing evenly the range [0,
 ] or [0,
 ] to a lot of smaller ranges. The dividing rates are depended on computation precision.
Because it is possible that the best local solutions exist at several parts within the initial field, the searching work of step 3 should be done at all parts where the best solution exist probably, in order to get the true global optimal solution. The system decomposition algorithm was described as Figure 2.
3. Case Study
The area of a water-supply system in the southeast part of Huanghe-Huaihe River Basin, China, is 2 × 10⁴ km2, and there are three key reservoir-projects. The distribution pattern of projects within this water-supply system is showed in Figure 1. The total capacity of Reservoir 1 is 4.02 × 10⁸ m3, the effective capacity is 2.15 × 10⁸ m3, the limited storage during flood season is 1.58 × 10⁸ m3; the total capacity of Reservoir 2 is 1.613 × 10⁸ m3, the effective capacity is 0.738 × 10⁸ m3, the limited storage during flood season is 0.659 × 10⁸ m3; the total capacity of Reservoir 3 is 1.425 × 10⁹ m3, the effective capacity is 5.03 × 10⁸ m3, the limited storage during flood season is 4.38 × 10⁸ m3. The droughts often happen during dry spring and autumn seasons, and the rainfalls within a year are not well-distributed in the system. Because 70% of annual rainfall concentrates in the flood season, June-September, the situation that autumn droughts often occur on schedule after the lasting spring drought impacts severely on the development of regional society and economy. Reservoir 1 and 2 undertake mainly the missions for supplying agriculture with water. In addition, also both reservoirs supply urban domestic and industry with a little amount water. Reservoir 3 is a big tank with the
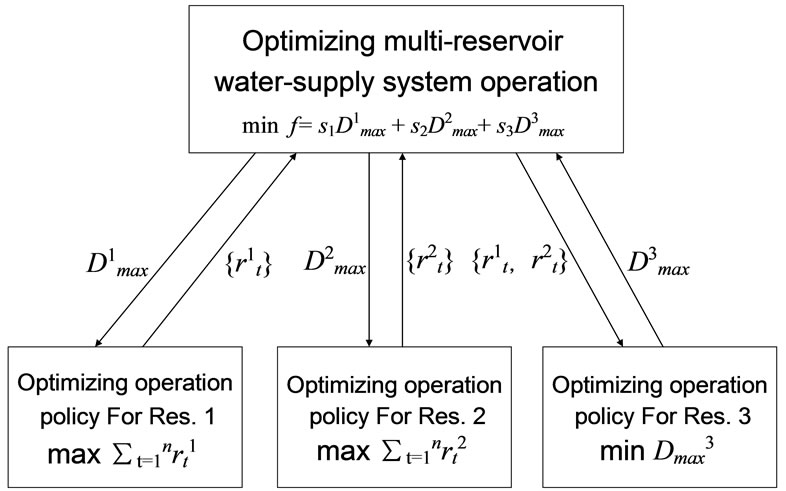
Figure 2. The structure of system decomposition algorithm.
synthetic functions for agriculture and urban water-supply, flood control, hydro-power generation and aquatic production. During droughts, the operation rules of Reservoir 1 and 2 have to conform to the water-supply target of Reservoir 3.
4. Results and Discussion
4.1. Model Computing Conditions
The historical series of runoff from 1964 to 1999 are available for the operation analysis of three reservoirs. The climatic conditions in the parts of the system are similar, the change patterns of dry and wet seasons of three reservoirs water-supply zones showed no difference among months or years. In order to evaluate quite well impacts of the longer drought period on the society and economy in each water-supply zone and the operation performance of reservoirs, a runoff process of dry period with 22-month length was selected for the hydrologic input data. The runoff data of three reservoirs with similar frequency were able to reveal the most disadvantageous results for the system operation analysis.
The urban water-demands of each reservoir water-supply zone among time-periods are even, but the best part of agriculture water-demand occurred in the planting and growing periods of crop, May-October, the other periods had a small amount of water-demand for the agricultural diversified economy. The water-demand process corresponding to the exceeding probability 75% was chosen as the target water demand of the system. The month was taken as computing time-period, so n = 22. The permitted maximum number of successive water-shortage time-periods 3 and the sum of water-shortage time-periods 6 were chosen in term of water requirement for plant types of crop, irrigation institution and the practical measures of water saving. The evaporation and seepage loss in a time-period was computed by the reservoir average effective water-surface area during a time-period multiplying evaporation rate. Let Sk0 = 0 for emphasizing the disadvantageous aspects of reservoirs operation.
The target water-demands of Reservoir 1 and 2 water-supply zone are 1.551 × 10⁸ m3 and 0.434 × 10⁸ m3, respectively. The maximum demands of single timeperiod are 0.122 × 10⁸ m3 and 0. 34 × 107 m3 for both reservoirs. The target water-demand of Reservoir 3 water-supply zone is 8.14 × 10⁸ m3. Therefore, the weights s1, s2 and s3 take 0.153, 0.043 and 0.804, respectively.
4.2. Results and Discussion
According to the system decomposition algorithm, the optimal solution is obtained, on which the best values of ,
,  and
and  is 0.366 × 10⁷ m3, 0.102 × 10⁷ m3 and 0.971 × 10⁷ m3 respectively; the comprehensive value of objective is 0.08413. The optimal releases of reservoirs and the water-shortage distribution of reservoir water-supply zones from the optimal solution are shown in Figure 3 and Figure 4. From Figure 4, it is made out that in Reservoir 1 and 2 water-supply zones, there are 6 shortage time-periods, and the maximum number of successive shortage time-periods is 3, the maximum shortage of single time-period are 0.366 × 10⁷ m3 and 0.102 × 10⁷ m3; in Reservoir 3 water-supply zone, there are 4 shortage time-periods, and the maximum number of successive shortage time-periods is 3, the maximum shortage of single time-period is 0.971 × 10⁷ m3. Undoubtedly, such water-shortage distribution within the system operation term and the maximum shortage of single time-period are the desired solutions. The lighter water-shortage distributed evenly among several timeperiods can avoid the calamities resulted from severe water shortage concentrated on a few time-periods.
In order to analyze the impacts of different total water-shortage time-period number p on operation policy and computation results, the model were solved according to several probable situations, p = 3, 4, 5, 6, 7 and 8, which water supply probabilities approximately are the range of 86~64%. Figure 5 showed above computation results. From Figure 5, each water-shortage of single time-period,  ,
,  and
and  and comprehensive objective f decreased with increasing p. It indicated the fact that the more minimum number of water-shortage time-period during drought, which means higher reliability
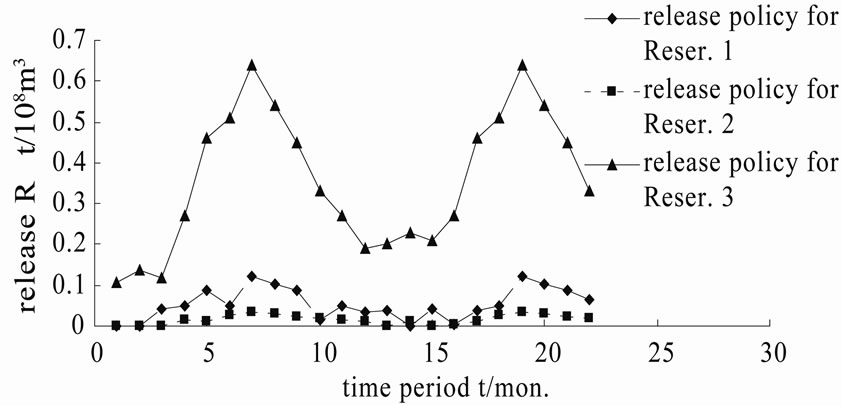
Figure 3. The optimal release policy of reservoirs.
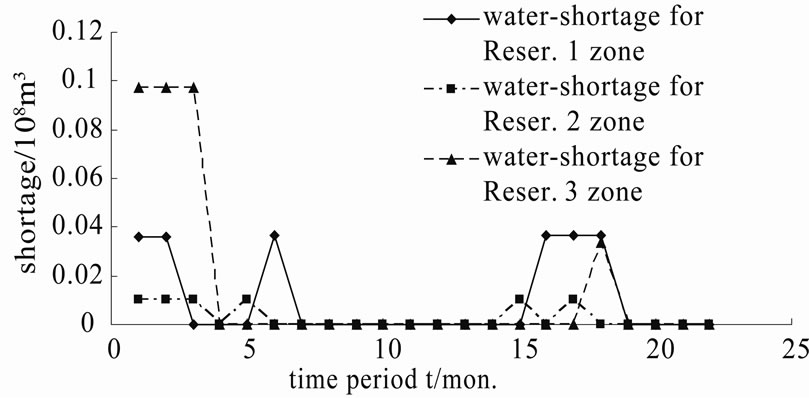
Figure 4. The best distribution of water-shortage.
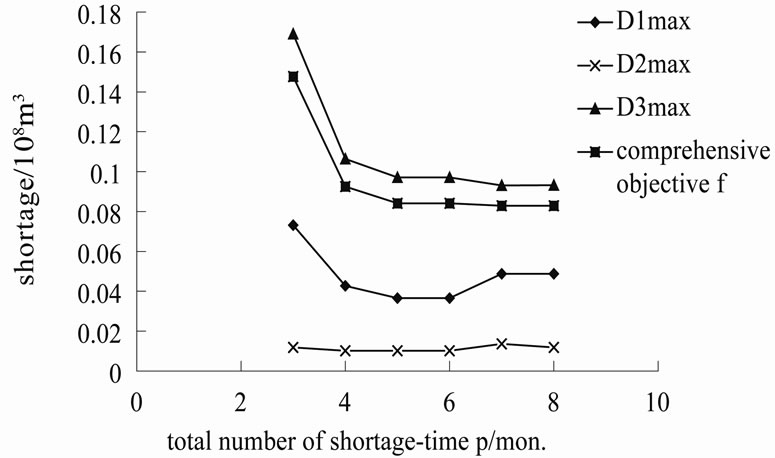
Figure 5. The change process of maximum shortage of single time-period and comprehensive objective with p.
of reservoir water supply, the more deep water shortage of single time-period. But this operation policy was not rational from the views of reducing the risk of reservoir water-supply and the social and economic impacts from water shortage. Therefore, it is noticeable that relaxed restriction on water-shortage time-period number may result in the smoother water-shortage of single time-period.
5. Conclusions
In term of basic connotation of the index for expressing reservoir water-supply risk during drought, that is reliability, resilience and vulnerability of reservoir water supply, and mathematical programming principle, the multi-objective mixed integer programming model was set up, which was able to consider the priorities of urban water-supply and agricultural water-supply, and operation rules of reservoir-group system for successive drought periods. The model-solving procedures and the system decomposition algorithm were proposed based on characteristics of the model structure. The concept of proposed technique is clear to understand and convenient to write the computer program, therefore, the large-scale and complicated mixed programming model become easy to solve. The application example verifies rationality of the model technique and it has practical value for multi-reservoir water-supply system operation policy analysis during drought.
6. Acknowledgements
The authors acknowledge the financial support of the Key Water Resources Science and Technology Projects of Jiangsu Province (2010010).
REFERENCES
- J. R. Stedinger, “The Performance of LDR Models for Preliminary Design and Reservoir Operation,” Water Resources Research, Vol. 20, No. 2, 1984, pp. 215-224. doi:10.1029/WR020i002p00215
- W. S. Moy, J. L. Cohon and C. S. ReVelle, “A Programming Model for Analysis of the Reliability, Resilience and Vulnerability of a Water Supply Reservoir,” Water Resources Research, Vol. 22, No. 4, 1986, pp. 489-498. doi:10.1029/WR022i004p00489
- J. S. Shih and C. S. ReVelle, “Water Supply Operations during Drought: Continuous Hedging Rule,” Journal of Water Resources Planning and Management, Vol. 120, No. 5, 1995, pp. 613-629. doi:10.1061/(ASCE)0733-9496(1994)120:5(613)
- K. Srinivasan and M. C. Philipose, “Effect of Hedging on over-Year Reservoir Performance,” Water Resources Management, Vol. 120, 1998, pp. 95-120. doi:10.1023/A:1007936115706
- K. M. Hyde, H. R. Maier and C. B. Colby, “Reliability-Based Approach to Multicriteria Decision Analysis for Water Resources,” Journal of Water Resources Planning and Management, Vol. 130, No. 6, 2004, pp. 429- 438. doi:10.1061/(ASCE)0733-9496(2004)130:6(429)
- M. W. Jenkins, J. R. Lund and R. E. Howitt, et al., “Optimization of California’s Water Supply System: Results and Insights,” Journal of Water Resources Planning and Management, Vol. 130, No. 4, 2004, pp. 271-280. doi:10.1061/(ASCE)0733-9496(2004)130:4(271)
- K. Kheireldin and H. Fahmy, “Multi-Criteria Approach for Evaluatinglong Term Water Strategies,” Water International, Vol. 26, No. 4, 2001, pp. 527-535. doi:10.1080/02508060108686953
- T. Hashimoto, J. R. Stedinger and D. P. Loucks, “Reliability, Resilience and Vulnerability Criteria for Water Resources System Performance Evaluation,” Water Resources Research, Vol. 18, No. 3, 1982, pp. 489-498.
- J. S. Shih and C. S. ReVelle, “Water Supply Operations during Drought: Continuous Hedging Rule,” Journal of Water Resources Planning and Management, Vol. 120, No. 5, 1994, pp. 613-629. doi:10.1061/(ASCE)0733-9496(1994)120:5(613)
- Z. Y. Qian and G. D. Zhang, “Integrative Research Report on Sustained Development Strategy of China Water Resources,” China Water Power Press, Beijing, 2001.
- Nanjing Institute of Hydrology and Water Resources (NIHR), and China Institute of Hydraulic and Water Resources (IWHR) (1999), China Water Supply and Demand in 21 Century, China Water Power Press, Beijing.
- S. Q. Hua, “Guide to Water Resources System Analysis,” China Water Power Press, Beijing, 1998.
- D. P. Loucks, J. R. Stedinger and D. A. Haith, “Water Resources Systems Planning and Analysis,” Prentice-Hall, Englewood Cliffs, New Jersey, 1981.
- M. S. Mondal and S. A. Wasimi, “Evaluation of RiskRelated Performance in Water Management for the Ganges Delta of Bangladesh,” Journal of Water Resources Planning and Management, Vol. 133, No. 2, 2007, pp. 179-187. doi:10.1061/(ASCE)0733-9496(2007)133:2(179)
- S. D. Qian, “Operation Research,” Tsinghua University Press, Beijing, 1990; Y. Y. Haimes, “Hierarchical Analysis of Water Resources Systems,” McGraw Inc, 1977.
- J. W. Labadie, “Optimal Operation of Multireservoir Systems: State-of-the-Art Review,” Journal of Water Resources Planning and Management, Vol. 130, No. 2, 2004, pp. 93-113. doi:10.1061/(ASCE)0733-9496(2004)130:2(93)
- X. M. Cai, D. C. McKinney and L. S. Lasdon, “Pieceby-Piece Approach to Solving Large Nonlinar Water Resources Management Models,” Journal of Water Resources Planning and Management, Vol. 127, No. 6, 2001, pp. 363-368. doi:10.1061/(ASCE)0733-9496(2001)127:6(363)
- M. Rosegrant, C. Ringler, D. C. McKinney, X. Cai, A. Keller and G. Donoso, “Integrated Economic-Hydrologic Water Modeling at the Basin Scale: The Maipo River Basin,” Journal of Agricultural Economics, Vol. 24, No. 1, 2000, pp. 33-46.