Technology and Investment
Vol.1 No.3(2010), Article ID:2498,6 pages DOI:10.4236/ti.2010.13026
Do Leveraged ETFs Increase Volatility
East Tennessee State University, Johnson City, USA
E-mail: trainor@etsu.edu
Received May 5, 2010; revised June 30, 2010; accepted July 3, 2010
Keywords: Leveraged ETFs, Volatility, Momentum
Abstract
The 2008 financial crisis has produced volatility levels not seen since the 1987 stock market crash more than 20 years ago. During that time, the culprit was thought to be index futures and program trading. This time, leveraged ETFs and their rebalancing trades have been singled out by some to explain both the spike in volatility and the appearance of large price swings at the end of the trading day. This study examines the merit of these accusations and whether the increase in volatility and end of the day price momentum is indeed linked to leveraged ETFs and their rebalancing trades. For the S&P 500, the relationship appears to be a spurious coincidence.
1. Introduction
“Whenever high market volatility occurs, the tendency seems to be to blame it on whatever new is going on at the time,” [1]. This is the first line of Franklin Edward’s piece, “Does Futures Trading Increase Stock Market Volatility” in the Financial Analyst Journal over 20 years ago. As the old French proverb goes, “The more things change, the more they stay the same.” Then, much as now, the market was in a turbulent period. The stock market crash on Oct. 20, 1987 is still the biggest one day percentage loss in U.S. history and many were looking for a scapegoat to place the blame. Index futures seemed to fit the bill as they had become increasingly popular among sophisticated investors, while at the same time were not completely understandable to many. They were further demonized by their use in program trading and were thought to be the sole province of greedy “speculators”.
However, the overriding conclusion from most of the research suggests that index futures had little or nothing to do with the increased volatility being experienced at that time [1-3]. The accuracy of this conclusion has been further evidenced by the historically low volatility the market experienced in the 1990’s and through most of this 21st century despite the tremendous growth in the use of index futures.
Jumping forward, the volatility associated with the 2008 financial crisis has not been seen since the 1987 stock market crash, and some of the blame is being placed on the latest investment vehicle that has become popular with the more sophisticated investors, leveraged ETFs. Much like index futures in the late 80’s, leveraged ETFs have also been somewhat demonized by their critics since they are supposedly used primarily by those greedy day traders and speculators. This study takes a more rigorous examination of leveraged ETF’s impact in the market place and whether critic’s assertions that leveraged ETFs cause increased volatility and big moves in prices at the end of the day actually hold up to scrutiny [4,5]. The answer to this question is becoming increasingly relevant as there are now more than 150 levered and inverse ETFs with total assets of $ 30 billion [6].
2. Research Past and Present
2.1. The Past
A great deal of research was done on volatility after index futures were initially espoused as the cause of the last great leap in volatility in the late 80’s. Not surprisingly, even without “something” to blame for the market volatility during the financial crisis of 2008-09, past research would predict that high volatility should be expected. Schwert [7] found that stock market volatility increases during recessions and after a large drop in stock prices. Even more enlightening is that Schwert found the higher the financial leverage of the market, the greater the volatility. This is clearly seen today in the financial sector where many firms use unprecedented levels of financial leverage, some to their own demise, e.g. Lehman Brothers. Thus, the increased volatility at the height of the financial crisis should be expected while firms continue to unwind some of their financial leverage exposure. The market environment during the financial crisis has all the critical factors identified more than 20 years ago as working towards increased volatility: a recession, a significant drop in stock prices, and high levels of firm leverage.
Additional research more directly related to leveraged ETFs deals with changing margin requirements. The expectation is that reducing margin requirements allows investors to create greater leverage which in turn causes increasing levels of volatility. Hardouvelis [8] concluded that increasing margin requirements would indeed stifle volatility. However, Hsieh and Miller [9], Kupiec [10,11], and Salinger [12] found a weak relationship at best while Schwert [7] found only a spurious relationship in that the Fed reacts after the fact, i.e. volatility changes, then the Fed changes margin requirements. Thus, results suggest that the use of leveraged funds by investors which in effect is similar to buying on margin, likely has little or no effect on market volatility.
2.2. The Present
Moving forward, some efforts have been made to quantify what role, if any, leveraged ETFs have on the increased volatility being experienced since the financial market meltdown. Deshpande, Devapriya, and Bhatia [13] suggest the impact is likely very small based on volume analysis, especially on the S&P 500 where the percentage of market capital traded daily by leveraged ETFs is only 0.0079% of the total volume. For smaller indexes, there may be more of an effect such as on the DJ US Real Estate Index. However, even the percentage traded by leveraged ETFs on this index is only 0.254% of the total.
A report from Credit Suisse [14] has similar conclusions finding that leveraged ETFs account for only 2% of end-of-day trading and thus, are unlikely to have any significant effect. Finally, a report by Direxion [15] also found similar results and suggests that leveraged ETFs do not exacerbate market volatility or compound directional moves from 3:00 p.m. to market close. In fact, they found creation unit activity is actually negatively correlated with market movements. This means that if the market is falling, more units are being created/purchased which goes against the flow, not with.
However, Cheng and Madhavan [16] find that leveraged ETFs may indeed have a large impact based on market-on-close (MOC) volume. MOC volume is the amount of trades that are specified to be filled at the market close price. In fact, orders for this to occur can begin with 20 minutes until close. Based on a theoretical model developed in their paper, they find that if stock indexes have moved 1% in a particular direction during the day, leveraged ETF trading could account for 16.8% of the MOC volume. If the market moves 5%, 50% of the MOC volume could be accounted for by leveraged ETF trading. Thus, broad moves could be exacerbated by the rebalancing that leveraged ETFs undertake towards the end of the day.
3. The Rebalancing Argument
One of the theoretical arguments that suggests leveraged ETFs can exacerbate market moves and increase volatility is due to the fact that current leveraged ETFs are set up to only provide a daily multiple of the underlying index. For example, a 3x fund is set up to provide three times the daily index return while a –3x fund is set up to provide three times the opposite return of the index. Because of this, daily rebalancing is required for any market move to maintain a constant leverage ratio. The rebalancing, for both long and short leveraged ETFs will create additional demand or selling pressure in the same direction as the market move.
The example depicted in Table 1 will best illustrate the point above. Assume the underlying index and levered fund’s NAVs start at 100. For the 3x fund, $ 300 in market exposure is needed. This exposure is usually created by holding some of the underlying index securities, and some combination of swaps and futures with swaps usually being primary. For the –3x fund, –$ 300 in market exposure is required. In period 1, assume the underlying index increases to 105 for a 5% gain. The 3x fund will gain 15% while the –3x fund will lose 15%. For the 3x fund to maintain its exposure at 3, it will need $ 345 in exposure since its underlying asset value increased to $ 315. Thus, at the end of the day, $ 45 in additional exposure will be needed.
For the –3x fund, the NAV falls to $ 85 so it will need –$ 255 (–3*85) in exposure. Thus, at the end of the day, it will also be a net buyer, in this case $ 45 of swaps or some combination of instruments to attain less negative exposure to the market. This creates an interesting market dynamic. When the market increases, both levered long and short funds will be net buyers and add to any existing buying pressure already being felt in the market.
Conversely, when the market decreases, both long and short funds will be net sellers in the market. For example, Table 1 shows that as the index falls from 105 back to 100 in period 2, the 3x fund will need to reduce its exposure by –$ 49.3 while the –3x fund will also need to change exposure by –$ 36.4. Depending on the magnitudes of these values relative to all trading in the last hour, the rebalancing issue can theoretically increase pressure on the market to continue whatever direction it may be moving during the last hour of trading.
As a point of exercise, assume this is the case. That is, leveraged ETFs cause the market to overshoot at the end of each day. If this is indeed the case, two types of investors could step in. Both types would know that leveraged ETFs would be net buyers or sellers at the end of
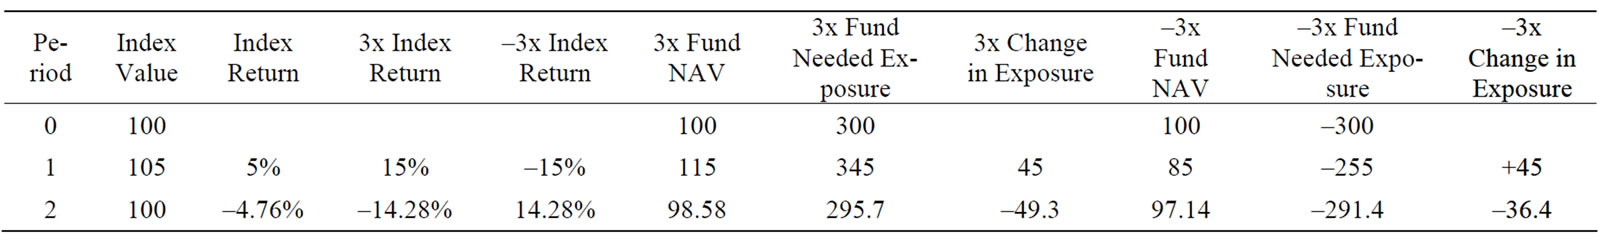
Table 1. Rebalancing to maintain daily leverage ratio for a 3x and –3x fund
each day based on what the market had done up until that point of time. The first type of investor would take the same actions as the leveraged ETFs knowing that the additional buying or selling pressure from the ETFs would continue to move the market in the same direction. They would of course be forced to sell right at the close or after hours to reverse their positions and profit from the likely market move.
However, a second type of investor would likely be more successful. This investor would take the opposite direction knowing that the market would reverse itself the next morning, assuming of course even moderate market efficiency in which market prices do indeed revert to their fundamental values, or at least what investors perceive them to be. This investor would reduce and most likely eliminate any arbitrage profits from front running, and eliminate any preponderance for the market to trend. Thus, any short-term abnormal price pressure causing the market to overshoot at the end of the day should theoretically be arbitraged away. This should occur as more and more investors take opposite positions of the leveraged ETFs on the expectation that the market open price the next day would be in the opposite direction that the market closed the previous day. Only if the leveraged ETF trading was so large that it could not be arbitraged away in this fashion, would extended volatility and price effects remain. Fortunately, this hypothesis is easily testable.
4. Volatility and Price Effects
4.1. Volatility Effects from Rebalancing
To attain a historical perspective on volatility, Figure 1 shows the moving 60 day annualized standard deviation of the daily S&P 500 returns. As one can see, volatility in the early 80’s was fairly subdued. With the stock market crash of 1987, volatility sky rocketed and stock index futures were blamed by some even though they were actually introduced on February 24, 1982 with no discernable increased in volatility. However, as volatility quickly fell back to “normal” levels, even the casual observer must admit that blaming stock index futures for the increased volatility in 1987 appears to be a stretch as volatility was very low with them in existence before 1987, and very low with them after 1987.
Volatility didn’t increase to any substantial level until the 2001 tech crash and 9/11. However, by 2003, volatility again fell to very low levels, sometimes below 10%. Only with the financial meltdown has volatility spiked, but as the financial crisis has mitigated, volatility levels have again returned to more reasonable levels. Thus, the critics who blame leveraged ETFs for the increased market volatility during the financial crisis, similarly to the critics of index futures in 1987/88, may be hard pressed to explain why volatility levels have since fallen, and so far continue to remain at more “normal” levels. In fact, the evidence appears to be almost identical to the 1980s since leveraged funds have actually been around since 1993. ETFs have made them more popular and recognized, but their initial introduction and growth did not lead to any perceptible increase in volatility.
Figure 2 shows why there has been a minor furor of increased volatility at the end of the day. The 60 day moving average of 30 minute volatility measured by the standard deviation of beginning and ending values of the S&P 500 between 9:30 a.m. and 10 a.m. and 3:30 p.m. and 4:00 p.m. EST is depicted. The first thing to note is that the opening 30 minutes is more volatile than the closing 30 minutes. This holds for the entire 12 year sample and on average, the opening 30 minutes has a standard deviation of 0.52% while the final 30 minutes has a standard deviation of 0.33%. It is also quite clear that both morning and afternoon volatility increased dramatically with the financial market crises.
However, afternoon volatility only exceeds morning volatility for approximately 3 months, November 2008 through January 2009. Since then, the afternoon volatility fell dramatically and is again, significantly less than morning volatility. Thus, at least to casual observation, it

Figure 1. S&P 500 annualized standard deviation, *60 day annualized daily standard deviation.
does not appear leveraged ETF’s rebalancing trades are creating increased volatility in the last 30 minutes of trading in the S&P 500. Despite continual flows to these funds, afternoon volatility has fallen dramatically, even relative to morning volatility.
To further investigate whether the increase in afternoon volatility from December 2008 to January 2009 may have been caused by rebalancing efforts of leveraged ETFs, the 10:00 a.m. to 10:30 a.m. period was compared to the 3:00 p.m. to 3:30 p.m. time period. This is done to see if the spike in afternoon volatility occurs during a time period when rebalancing should not be a significant force.
Figure 3 shows the results. On average, the two 30 minute time period’s standard deviations are virtually the same, 0.33% and 0.30% respectively. However, much like Figure 2, the November 2008 to January 2009 time period dealing with the 10:00-10:30 a.m. and 3:00-3:30 p.m. show the same relationship. By March, the volatility for both time periods returns to being virtually equal. Thus, even though leveraged ETF’s rebalancing doesn’t begin in earnest until the last 30 minutes of the trading day, the same relationship appears from 3:00 to 3:30 p.m. giving at least some initial evidence that rebalancing is not the major issue. Although not shown, the 2:30 to 3:00 p.m. time period also had the same spike in volatility (from an average of 0.26% to 0.90%) and virtually no rebalancing occurs this early.
4.2. Price Effects from Rebalancing
Although it appears rebalancing is not the root cause of the increase in volatility, at least in the S&P 500, rebalancing still may cause price effects. To address this issue, a rolling 60 day average of price changes is calculated. Figure 4" target="_self"> Figure 4 shows the probability of a positive move in the market from the opening to 3:30 p.m. being followed by a positive move from 3:30 p.m. to close. Evidence suggests that positive momentum did increase substantially during the financial market crisis. Starting in August of 2008, the probability of a continuation of a positive market move increased to over 70% and remained there until November 2008.
However, it soon fell quite dramatically. For the entire 1998 to 2010 time period, this probability has actually averaged 58% although with quite a bit of volatility. A statistical test does find the August through November 2008 positive price momentum to be statistically significant relative to the average of the previous 10 years. Examining the average from August 2008 through April 2010, there is no discernable difference as the average momentum before August 2008 is 58% and after is 61%.
Figure 5 shows the results for a negative market move throughout the day being reinforced by a negative move the last 30 minutes. For the entire time period, a negative move has reinforced the daily move 52% of the time. Similar to Figure 4, the probability a negative move would continue through the last 30 minutes of the day also increased to above 70% from August to November 2008. Thus, Figures 4 and 5 do suggest there is some momentum in stock returns and leveraged ETFs are theorized to cause or exacerbate this exact price momentum.
However, these extreme values have been seen before and neither the positive or negative price momentum has remained a systematic phenomena. In fact, before 2006, every year saw positive momentum greater than 70% at least once during the year. In addition, the probability of a move continuing has also seen probabilities at the opposite spectrum. For example, in early 2001, the probability of positive momentum fell to less than 20% and in 2009, the probability of negative momentum fell to less than 30%. With the extreme moves in these values and the fact that this price momentum has not remained even as levered ETFs have continued to grow in size suggests the relationship between leveraged ETFs and price momentum to be a spurious coincidence.
On the other hand, if rebalancing does cause the price to overshoot as suggested earlier in this paper, then the increased price momentum should be associated with a next day opening that is negatively related to the previous day’s close. Figure 6 shows the probability of the opening being greater than the previous day’s close if the market

Figure 2. S&P 500 30 minute volatility from January 1998 to April 2010.
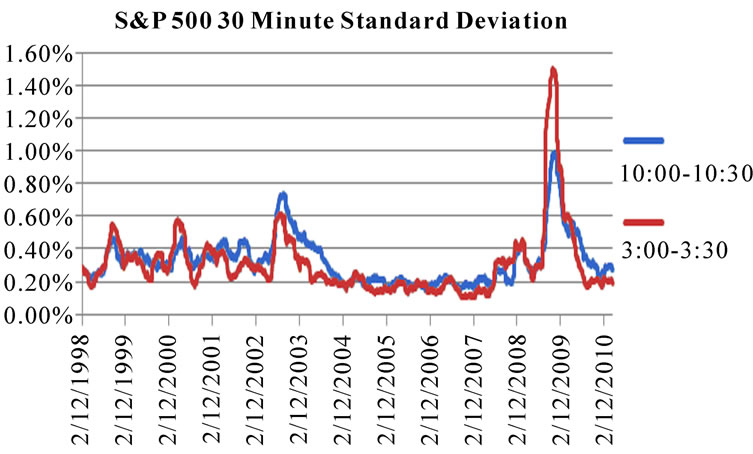
Figure 3. S&P 500 30 minute volatility from January 1998 to April 2010.

Figure 4. Probability a positive market move will be reinforced in the last 30 minutes of trading.
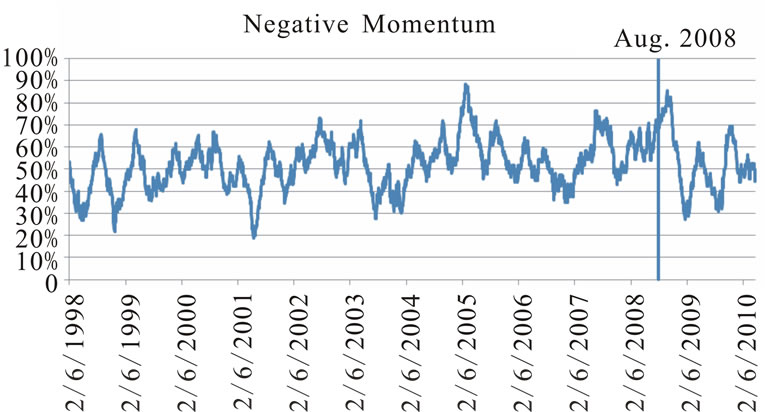
Figure 5. Probability a positive market move will be reinforced in the last 30 minutes of trading.
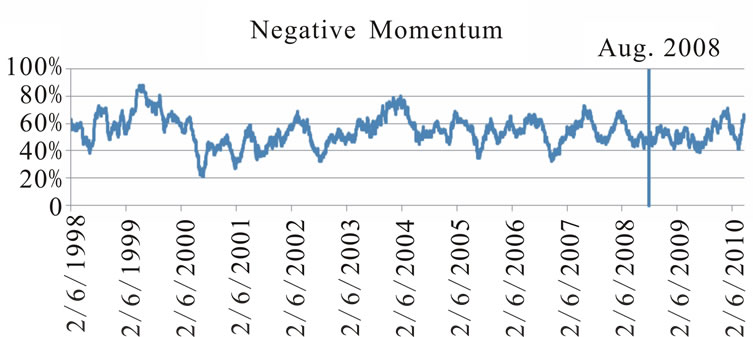
Figure 6. Probability market will increase the next day if market falls last 30 minutes the day before.
fell over the last 30 minutes of the previous day. For the entire time period studied, there was a 54% chance that this would occur.
During the financial market meltdown, the probability the next day’s opening would be higher if the market fell the last 30 minutes of the previous day did not deviate from historical norms as can easily be discerned in Figure 6 which a statistical test confirms.
To test whether the magnitude of the previous day’s final 30 minute decline is related to a positive reversal, the previous day’s percentage decline is regressed on the next day’s opening reversal percentage return. Specifically,
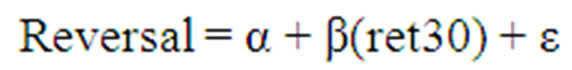 (1)
(1)
where:
reversal = percentage return of day t; and ret30 = percentage return of last 30 minutes of previous day if last 30 minute return is negative.
The results are shown below for the August to November 2008 time period:
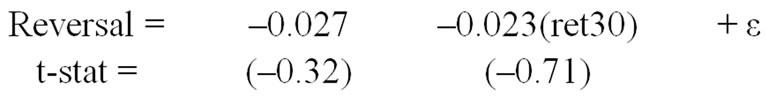
This indicates that for each one percent additional decline during the previous day’s final 30 minutes, the opening is expected to be 0.023% higher the next day relative to the previous day’s close. Economically, this is not overly significant and based on the t-stat, certainly not statistically significant. Thus, there is no confirming evidence that leverage fund rebalancing is causing additional price momentum that leads to overshooting.
To be complete, Figure 7 shows the probability that the market will decrease the next day if the market increases the last 30 minutes the day before. For the entire time period, the average probability that this would occur is 49%. The August through November 2008 time period did see this increase to 61% which is statistically significant. However, this value has fallen to the 40% level twice since then. Regardless, there is some minor evidence here that suggests a negative reversal is more likely after an increase over the last 30 minutes from the day before.
Similarly to above, the magnitude of the reversal is also tested using Equation (1) with the only difference being that ret30 = percentage return of last 30 minutes of previous day if last 30 minute return is positive instead of negative. The results are shown below:
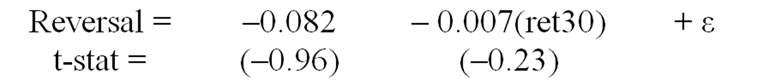
In this case, the economic reversal is a trivial 0.007% and statistically insignificant based on the 0.23 t-stat. Although the probability of reversal appears to be greater, the magnitude is even smaller relative to the positive reversal case.
To further test the robustness of this negative reversal, the reversal probability is also calculated based on the previous day’s move, not just the last 30 minutes. Interestingly, the same basic result found above is also attained based on whether the market is up or down for the entire day the day before, not just the last 30 minutes. In fact, the negative reversal based on the previous day’s move was 67% during August to November 2008 as opposed to only 61% based on the last 30 minutes. Thus, the supposed market overreaction as evidence by higher than a 50% probability of reversal is not based just on the 30 minute price change of the index from the day before, but more on a general buy into the declines and sell into the increases irrespective of what leveraged ETFs are doing.
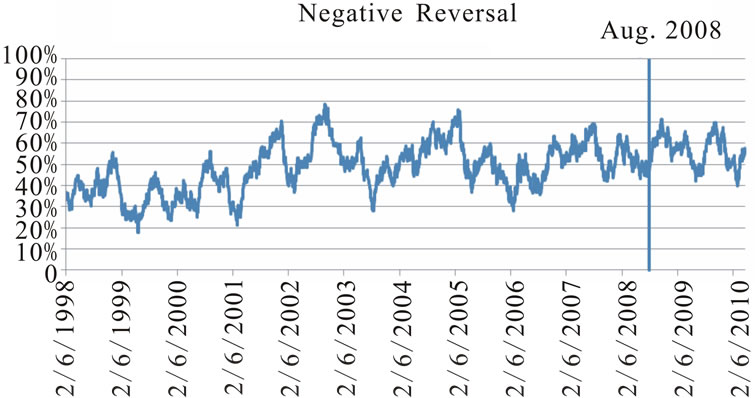
Figure 7. Probability market will decrease the next day if market increases last 30 minutes the previous day.
5. Conclusions
Leveraged ETFs are a growing market segment and have received a great deal of scrutiny. It has been suggested by some that they have played a role in increasing market volatility. The fact they were becoming increasingly popular when the financial market crisis hit made them an obvious scapegoat for explaining the tremendous increase in volatility at the time. Two major points refute this idea: 1) the abnormally high market volatility has now mostly subsided despite the continued growth in levered ETFs, and 2) historical evidence suggests the volatility that accompanied the financial crisis should have been expected irrespective of levered ETFs existence based on the economic recession, the tremendous leverage held by financial firms, and the large drop in stock prices.
This study has not found evidence that volatility has systematically increased due to the rebalancing issue associated with leveraged ETFs. Intra-daily volatility in time periods not associated with rebalancing saw the same spikes in volatility as the last 30 minutes did. Furthermore, price momentum and reversal during the height of the financial crisis also does not appear to be related to leveraged ETF rebalancing for the following four reasons: 1) these effects have not continued even though leveraged ETFs continue to grow, 2) the magnitudes during the financial crisis have been seen before, 3) the magnitude of the previous day’s 30 minute move is not related to higher percentage reversal returns the next day, and 4) the significant next day reversal associated only when the market was up during the financial crisis is more related to a move during the previous day, not just to the last 30 minutes.
Thus, the trading associated with leveraged ETFs does not appear to have any substantial effect on the market. However, the S&P 500 is a large market. If leveraged ETFs make up a greater percentage of the trading in some smaller markets, it is possible they could have an effect, although it seems likely any systematic pricing bias would be quickly arbitraged away.
6. References
[1] F. Edwards, “Does Futures Trading Increase Stock Market Volatility?” Financial Analysts Journal, Vol. 44, No. 2, 1988, pp. 63-69.
[2] G. W. Schwert, “Why does Stock Market Volatility Change over Time?” Journal of Finance, Vol. 19, No. 5, December 1987, pp. 3-29.
[3] G. W. Schwert, “Stock Market Volatility,” Financial Analysts Journal, Vol. 46, No. 3, May/June 1990, pp. 23-34.
[4] T. Lauricella, S. Pulliam and D. Gullapalli, “Are ETFs Driving Late-Day Turns? Leveraged Vehicles Seen Magnifying Other Bets; Last-Hour Volume Surge,” Wall Street Journal, 15 December 2008.
[5] J. Zweig, “How Managing Risk with ETFs can Backfire,” Wall Street Journal, 27 February 2009.
[6] J. Spence, “Leveraged ETFs are under SEC Scrutiny,” Wall Street Journal, 13 April 2010.
[7] G. W. Schwert, “Stock Volatility and the Crash of 87,” The Review of Financial Studies, Vol. 3, No. 1, 1990, pp. 77-102.
[8] G. Hardouvelis, “Margin Requirements and Stock Market Volatility,” Federal Reserve Bank of New York Quarterly Review, 1988, pp. 80-89.
[9] D. Hsieh and M. Miller, “Margin Regulation and Stock Market Volatility,” Journal of Finance, Vol. 45, No. 1, 1990, pp. 3-29.
[10] P. Kupiec, “Initial Margin Requirements and Stock Returns Volatility: Another Look,” Journal of Financial Services Research, Vol. 3, No. 2-3, December 1989, pp. 287-301.
[11] P. Kupiec, “Margin Requirements, Volatility, and Market Integrity: What have We Learned Since the Crash?” Journal of Financial Services Research, Vol. 13, No. 3, 1998, pp. 231-255.
[12] M. Salinger, “Stock Market Margin Requirements and Volatility: Implications for Regulation of Stock Index Futures,” Journal of Financial Services Research, Vol. 3, No. 2-3, December 1989, pp. 121-138.
[13] M. Deshpande, D. Mallick and R. Bhatia, “Understanding Ultrashort ETFs,” Barclays Capital Special Report, 5 January 2009.
[14] “What is the Real Impact of Leveraged ETFs?” Credit Suisse Portfolio Strategy, 2009.
[15] Direxion Report, Meeting with SEC Staff, 16 April 2009.
[16] M. Cheng and A. Madhavan, “The Dynamics of Leveraged and Inverse Exchange-Traded Funds,” Journal of Investment Management, Vol. 7, No. 4, 2009, pp. 43-62.