Journal of Electromagnetic Analysis and Applications
Vol. 1 No. 1 (2009) , Article ID: 195 , 6 pages DOI:10.4236/jemaa.2009.11008
The Online Assessment of Electric Distribution Network Load Capability
1College of Electrical Engineering, Hohai University, Nanjing, P. R. China
Email: liuhaom@hhu.edu.cn
Received January 27th, 2009; revised February 20th, 2009; accepted March 2nd, 2009.
Keywords: Distribution Network, Online Security Assessment, Loading Capability, Variable Step-Size Repetitive Power Flow, Load Transfer
ABSTRACT
To improve the security and reliability of a distribution network, several issues, such as influences of operation constrains, real-time load margin calculation, and online security level evaluation, are with great significance. In this paper, a mathematical model for load capability online assessment of a distribution network is established, and a repetitive power flow calculation algorithm is proposed to solve the problem as well. With assessment on three levels: the entire distribution network, a sub-area of the network and a load bus, the security level of current operation mode and load transfer capability during outage are thus obtained. The results can provide guidelines for prevention control, as well as restoration control. Simulation results show that the method is simple, fast and can be applied to distribution networks belonged to any voltage level while taking into account all of the operation constraints.
1. Introduction
The distribution network transmits the electricity from load centers to the customers. The accurate real-time assessment of its load capability and the allowable load margin is of great significance. Because the sufficient power supply capability is a prerequisite to ensure the distribution network operate securely and reliably. Especially with the development of distribution management system (DMS) and distribution automation system (DAS), the selection of an economic operation mode of the distribution network with the variation of the load is possible [1], which makes it more necessary to evaluate the load capability of the current operation, and to change the operation mode immediately in order to avoid violation and faults. Only in this way it is possible to ensure the security and reliability while pursuing the economic object. When there are faults have taken place in the distribution network, the load of the non-fault section should be transferred to its adjacent feeder immediately in order to reduce the range and time of outage. Thus it is needed to evaluate the load acceptability of its adjacent feeder to determine the load quantity that can be transferred. For these reasons, it is of great significance to investigate the load capability of a power distribution network.
With the in-depth going of the electricity market, the research of the load capability of transmission networks is paid more attention and certain achievements are obtained [2,3,4]. But the research of load capability of distribution network is little. The few studies were only through the statistical indexes [5,6,7,8], such as the capacity to load ratio of substations and the average of line load ratio, which can be just used for the qualitative assessment in general terms. The results may be helpful to the distribution network planning and upgrading, but can’t provide any information used for the real-time control of the distribution network. Furthermore, these methods can not take into account the constraint of bus voltage limits. So it is necessary to propose a feasible load capability assessment method and an effective algorithm to meet the problem while considering various operation constraints.
In this paper, the mathematical model of the load capability online assessment of distribution network is established, and the improved variable step-size repetitive power flow is proposed to solve the problem. The evaluation is carried out in three perspectives: the entire distribution network, a sub-area of the network and a load bus. According to the assessment results of the whole network, the security of the current operation condition is divided into three levels: high, medium and low, which determines weather or not to take the prevention control. During outage the load transfer capability is obtained through the load capability assessment of a load bus. Simulation is carried out on two distribution networks, and the results show that the proposed method is simple and fast, and can be applied to distribution networks belonged to any voltage level while taking account into all the operation constraints.
2. The Real-Time Assessment of Distribution Network Load Capability
2.1 The Mathematical Model of the Load Capability Assessment
The load capability of a distribution network refers to how much load the network can sustain before any operation constraint violated when given a load variation pattern, such as the constraints of bus voltage or branch power. It is determined by the operation mode of the distribution network and the load variation pattern. The restructuring of distribution network, the changes of transformer taps or the switching of reactive power compensation equipments would have impacts on the load capability. So it is time-varying and must be assessed online based on the practical operation condition.
In the power transmission system the main factors that limit the power transmission capability are thermal limitation, line-voltage-drop limitation and stability limitation [2]. In the process of assessment of distribution network, the former two factors are taken into account and the stability limitation is ignored here. In this paper, the maximum power that is determined by the thermal limit of lines and the rated power of transformers are used as their upper load limits. And assuming that the higher voltage level power network can provide sufficient electricity, and the load growth pattern is that the load growth is proportional to the actual load.
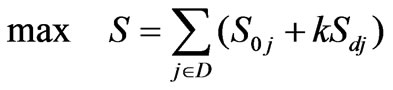
According to the above, the objective function of load capability of distribution network can be formed as
 (1)
(1)
where,  is the area to be assessed, the total number of the bus in
  is
is ,
,  is the maximum load that can be supplied in area
 ,
,  and
and  are the actual load and the base quantity of the load variation of bus
  respectively, here we take
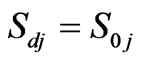 ,
,  is the multiples of load growth. So the first item of the objective function is the sum of all the actual loads. In this paper,
  is considered as three instances, they are the whole network, a sub-area of the distribution network, and just one node.
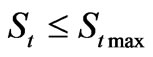
The constraints include power flow constraint, the capacity limits of lines and transformers, and voltage magnitude limits. The formulas are as follows:
 (2)
(2)
 (3)
(3)
 (4)
(4)
 (5)
(5)
where  is the bus-branch conjunction matrix,
  is the branch current vector, I is the nodal injection current vector, Vk, VLk and VUk are the voltage magnitude, lower and upper limits of the bus k respectively, il and ilmax are the current and its upper limit of line l, St and Stmax are the power flow and its upper limit of transformer t.
2.2 The Classification of Load Capability Assessment
According to the area to be assessed, the load capability assessment can be divided into three categories.
1) The assessment for the whole network In this type of assessment, the loads power of all the buses in the whole distribution network will increase proportionally and continuously until any constraint works. Based on the maximum total power, the load capability and how much more load the network can sustain will be known under the certain operation condition. So it can be used to judge whether the current operation condition could bear a certain load fluctuations, also provide a signal to determine whether the prevention control should be started up.
Assuming if the loads increase to be K times of the original loads when reaching a constraint, that is, if the loads increase more there will be a violation occurrence. Thus, K could be used to indicate the load capability. In Equation (1), when S reaches maximum, the value of variable k is expressed as kmax, then K=1+kmax. It is obvious that the value of K is greater than or equal to 1. The larger its value is, the better the load ability is and the higher the security level is. So K can be used as a security index of the distribution network. In this paper, the security level is defined as three grades: high, medium and low. If K>2, the security level is high, which means if all the loads is doubled the distribution network can still run normally, and no prevention control is needed. If 1.5<K<2, the allowable load margin is acceptable and the security level is medium. Although the prevention control is not needed yet, the operation condition should be paid more attention. If 1<K<1.5, the security level is considered as low, prevention control should be taken immediately to change the current operation condition. Otherwise there would be violation occurrence if the load has any fluctuation.
2) The assessment for a sub-area The loads in the sub-area to be assessed increase proportionally and other loads remain unchanged until a constraint works. The load capability acquired could be used to judge whether new load can be connected into the sub-area and how much loads can be connected.
3) The assessment for a load bus Except the load of the bus that is assessed, all the other loads remain unchanged. So the maximum load that the bus can supply is obtained. The result is very useful for restoration control, because generally the adjacent feeders are connected together by tie switches which are open in normal operation, once there is a fault in a feeder, the loads of which should be translated to its adjacent feeders from tie switches as more as possible in order to reduce the range and time of outage. In the process of translation, the load capability of the bus, that will accept new load, should be assessed in order to know how much load can be transferred. Many literatures on service restoration neglected the translation capability, and made the assumption that the adjacent feeders can accept all the loads that need to be translated [9]. This is inconsistent with the fact.
3. The Repeated Power Flow and its Application in Load Capability Assessment
3.1 The Introduction of Repeated Power Flow
The essence of load capability assessment for the distribution network is to acquire a critical point under a given load increase pattern. At the critical point, even if there is a little load incensement, there will be a violation occurrence. So the critical point means the maximum load that a network or a bus can supply, and then the load capability will be determined. Repeated power flow (RPF) is one of the effective methods to calculate the critical point. The core idea is while varying a parameter continuously, the power flow calculation is done repeatedly until there is a violation occurrence. RPF has been used in the calculation of the available translation capability (ATC) in the transmission network [10,11].
The realization process of the assessment based on RPF is as follows, based on the actual operation condition and the load variation pattern Sd, increasing the loads according an appropriate step h, calculating the power flow, judging if there is a violation, if not increasing the load continuously, otherwise decreasing step size. Iteration is done until the tolerance meets the requirement. The operation point that just one constraint action is the critical point and the load at the operation point is the maximum load the network can supply.
3.2 The Strategy of Step Size Adjustment
In the process of assessment the selection of an appropriate step size h is very important. If the step size is large the accuracy would be inadequate, or if the step size is too small the algorithm would converge slowly. In this paper, automatic step size variation method is introduced to search the critical point. If in one iteration there is no violation the step size will remain unchanged and search forward continuously. Otherwise, if one violation occurs, the step size will be reduced by half. The iteration is repeated continuously until the step size h is reduced to satisfy the accuracy requirement. The detailed steps are as follows:
1) Fix the initial step size h0>0 and convergence tolerance ε>0;
2) Define the load variation pattern Sd, let S be the actual load S0, h=h0, K=1;
3) If h>ε, go to next step; else if h<ε, the calculation is ended and return S and K. S means the maximum load capability. So S-S0 is the allowable load margin. K is the ratio of the maximum load that the network can supply and the actual load;
4) Calculate S′=S+hSd;

Figure 1. Flow chart of distribution network load capability assessment based on improved variable step-size RPF
5) Run power flow calculation based on the load S′ to check if there is any violation, if not continue next step, otherwise jump to step 7);
6) Let S= S′, jump to step 4);
7) Reduce the step size by half, h= , go to step 3).
The flow chart of distribution network load capability assessment based on RPF is as shown in Figure 1.
3.3 The Advantages of Variable Step-Size RPF
The algorithm for load capability assessment used in this paper has following advantages:
The application range is wide and all the constraints that the distribution network has can be taken into account; The algorithm is simple and the results are accurate; The burden of the variable step-size RPF calculation is low. Generally the maximum load capability is not far away from the actual operation point. So in the computation process if the initial step size h0=2, along with the load increment there will be violation occurrence within about 4 times iteration. If the convergence tolerance  =2-10, the power flow calculation times is not more than 14 in the whole assessment process. So the burden of calculation is lower absolutely compared with the intelligence algorithms, and it is suitable to solve load capability assessment problem online.
4. Simulation Analysis
In order to verify the feasibility of the proposed algorithm, two examples are simulated. One is a radial distribution network with long feeders of 10kV. The other is a multi voltage level distribution network.
4.1 Case 1
Figure 2 shows the network configuration of the test system that is from an actual city distribution network. The voltage level is 10 kV. It consists of 42 buses, 41 branches and 24 distribution transformers, all the branches are buried or aerial cables. Bus 20 is connected with an adjacent feeder through a tie switch. The sum of current load is 1610+j700 kVA. The upper limits of transformers and cables are their rated power and thermal limits respectively. The allowable fluctuation range of voltage magnitude is .
.
MATLAB® 6.5 is adopted here to program. Running the power flow calculation, it can be known that the lowest voltage in the distribution network is 0.972 and the power flow in every branch is allowable. Assuming the initial step size  and the convergence tolerance
 , load capability assessment is carried out in three aspects.
1) The assessment for the whole network The assessment for the whole network is convergent after 11 iterations with the CPU time for about 0.437 seconds. From the assessment results, it can be known that the network can sustain  kVA loads, which is 1.77 times of the base instance. So the security meets requirement and the current operation condition needn’t to be changed.
2) The assessment for a sub-area Assuming the sub-area consists of 6 buses, they are bus 15-20. The assessment is convergent after 12 iterations, and the maximum loads in the sub-area can reach  kVA under the current operation condition while other loads remain unchanged, which is 3.3848 times of the base instance, and the voltage magnitude of bus 20 reaches its lower limit.
3) The assessment for a load bus In the network, bus 20 is connected to another feeder. If there is a fault in the feeder, the loads can be transferred to bus 20 via closing the tie switch. The load capability assessment of bus 20 is  kVA, and the load transferred to bus 20 should be less than the amount. Otherwise, the power flow in the branch between bus 2 and 3 would exceed its upper limit.
In the simulation process it is found that the voltage magnitude constraint often effects and limits the load capability, so it is not reasonable to assess the load capability without voltage magnitude constraint.
4.2 Case 2
The second simulation example, which is shown in Figure 3, is part of a multi voltage level actual network, including three 220kV substations, four 110kV substations and six 35kV substations. There are 51 buses, 7 three-winding transformers, 10 double winding transformers and 25 lines. There are tie lines between the 3 220kV substations. However, in the normal operation state they are running separately in order to avoid electromagnetic loop. So the whole distribution network can be divided into three independent areas by the dash and dot line as shown in Figure 3. The load in all of the whole distribution network is 121.88MW +68.36MVar. The allowable fluctuation range of voltage magnitude of 35kV and 110kV is  and that of 10kV is
 .
.

Figure 2. A 10 kV distribution network consists of 42 buses

Figure 3. A multi-voltage level distribution system containing 51 buses
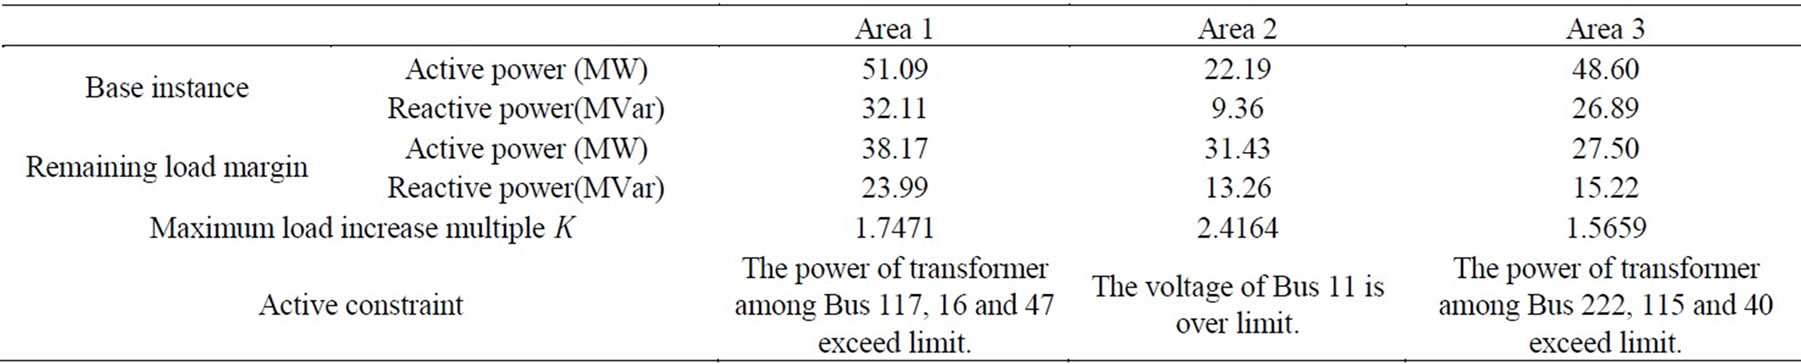
Table 1. The loading capability evaluation results of the three areas
1) The load capability assessment of 3 areas is all carried out and the results are shown in Table 1. The load increase multiple K of Area 2 is maximal among the 3 areas, which is up to 2.4164. So the load fluctuate enduring ability is best in the area. The remaining load increase allowance of Area 1 is maximal, which is 38.1693MW + 23.9894MVar. The security of the 3 areas all meets requirements.
2) If there is a short circuit fault in line 52, the switches on the two ends of the line should be opened in order to isolate the fault. And the load supplied by Bus 42 should be transferred to Bus 41 of Area 1. Thus the load capability of Bus 41 should be evaluated real timely to decide whether the lost load can be restored, that is, whether or not some load should be cut.
The maximum load that can be supplied by Bus 41 can be obtained by the method proposed in the paper, and the value is 19.12MW+12.70MVar, otherwise the current of Line 51 will exceed limit. So the remaining load margin is 13.52MW+8.98MVar, which can supply the entire lost load. Therefore no load needs to be cut; just close the tie switch 80 then the entire load will be restored.
As discussed above, the load capability assessment results, such as the maximum load that the network can supply and the allowable load margin, can provide a scientific signal to determine whether the prevent control or restoration should be started.
5. Conclusions
Many research works on the distribution network reconfiguration have been done in order to minimize the power loss by adjusting the operation mode with the load variation. Although the total loss decreases, it brings forward new challenges to the distribution network’s security and reliability. This paper proposed an online load capability assessment strategy, which could figure the security level timely. The allowable load margin acquired can be used to determine whether to take the prevention control. The maximum load that can be transferred after outage is of great significance in the restoration control. The variable step-size RPF algorithm has a low calculation burden and is suitable to solve load capability assessment problem online.
REFERENCES
- S. Koizumi, M. Okumura, and T. Yanase, “Application and development of distribution automation system in TEPCO,” Proceedings of IEEE Power Engineering Society General meeting, Vol. 3, pp. 2429-2435, 2005.
- R. D. Dunlop, R. Gutman and P. P. Marchenko, “Analytical development of loadability characteristics for EHV and UHV transmission line,” IEEE Transactions on Power Apparatus and System, 98, pp. 606-613, 1979.
- H. D. Chiang, A. J. Flueck, K. S. Shah, and N. Balu,
- “CPFLOW: A practical tool for tracing power system steady-state stationary behavior due to load and generation variations,” IEEE Transactions on Power Systems, 10, pp. 623-634, 1995.
- S. Greene, I. Dobson and F. L. Alvarado, “Sensitivity of transfer capability margins with a fast formula,” IEEE Transactions on Power Systems, 17, pp. 34-40, 2002.
- Energy and Electric [1993] No. 228. (1999), “The planning and designing rule of urban power network,” 1st edition, China Electric Power Press, Beijing.
- X. Li, P. Li, X. Zhu, G. Peng, and Y. Ou, “Evaluation construction size of district high voltage distribution networks,” Automation of electric power systems, 31, pp. 46-50, 2007.
- R. E. Brown, A. P. Hanson, H. L. Willis, F. A. Luedtke, M. F. Born, and N. C. Raleigh, “Assessing the reliability of distribution systems,” IEEE Computer Applications in Power, 14, pp. 44-49, 2001.
- J. Zhang, D. Luo, J. Yao, and W. Li, “Research on value of capacity-load ratio in urban power network planning based on the economical analysis,” Relay, 35, pp. 39-43, 2007.
- S. Curcic, C. S. Ozveren, and K. L. Lo, “Computer-based strategy for the restoration problem in electric power distribution systems,” IEEE Proceedings-Generation, Transmission and Distribution, 144, pp. 389-398, 1997.
- O. Yan and C. Singh, “Assessment of available transfer capability and margins,” IEEE Transactions on Power Systems, 17, pp. 463-468, 2002.
- M. H. Gravener, and C. Nwankpa, “Available transfer capability and first order sensitivity,” IEEE Transactions on Power Systems, 14, pp. 512-518, 1999.