Int'l J. of Communications, Network and System Sciences
Vol.3 No.2(2010), Article ID:1270,6 pages DOI:10.4236/ijcns.2010.32023
An Approach to Dynamic Asymptotic Estimation for Hurst Index of Network Traffic
School of Information Science and Technology, Beijing University of Chemical Technology, Beijing, China
Email: maxy@mail.buct.edu.cn, lihg@mail.buct.edu.cn
Received November 14, 2009; revised December 27, 2009; accepted January 5, 2010
Keywords: Network Traffic, Hurst Index, Dynamic Asymptotic Estimation, Long-Range Dependence
Abstract
As an important parameter to describe the sudden nature of network traffic, Hurst index typically conducts behaviors of both self-similarity and long-range dependence. With the evolution of network traffic over time, more and more data are generated. Hurst index estimation value changes with it, which is strictly consistent with the asymptotic property of long-range dependence. This paper presents an approach towards dynamic asymptotic estimation for Hurst index. Based on the calculations in terms of the incremental part of time series, the algorithm enjoys a considerable reduction in computational complexity. Moreover, the local sudden nature of network traffic can be readily captured by a series of real-time Hurst index estimation values dynamically. The effectiveness and tractability of the proposed approach are demonstrated through the traffic data from OPNET simulations as well as real network, respectively.
1. Introduction
A large number of studies have shown that the real network traffic has self-similarity and long-range dependence, the characteristic exists in the traffic streaming and video streaming of LAN, MAN, WAN, ISDN, CDPN, CDMA, GPRS, wireless networks and Adhoc networks [1–6]. Hurst index is a primary parameter to describe the sudden nature of network traffic. Hurst index estimation methods are mainly two types [7]: one is time-domain methods, including the absolute value estimation, variance, R/S and the IDC method. The other is the frequency domain or wavelet domain methods, including Whittle's maximum likelihood estimation, periodgram method and wavelet domain estimation method. Time-domain methods calculate the law of power function between data statistics value and the aggregated order. Similarly, the frequency domain or the wavelet domain methods find the law of power function between frequency domain spectrum or energy and time scale.
Contrary to the methods using limited data series, this paper presents an approach to dynamic asymptotic method for Hurst index estimation using infinite time series, which is strictly consistent with the asymptotic property of long-range dependence. With the evolution of network traffic over time, more and more data are generated. Based on the calculations in terms of the incremental part of time series, the algorithm enjoys a considerable reduction in computational complexity. The algorithm can also capture the local sudden information of network traffic at the same time by a series of Hurst index values. Wei Jinwu [8] proposed a longrange dependence sliding window time-varying estimation algorithm to capture local sudden information. But its Hurst index estimation is still based on the limited time series. Hurst index estimation without previous network traffic information is not accurate.
The second part of this paper introduces the network traffic self-similarity and long-range dependence theory, uses ON/OFF model in OPNET simulation software to generate the self-similar traffic, and applies the traditional R/S algorithm to estimate Hurst index. The third part presents an approach to dynamic asymptotic estimation for Hurst index of Network Traffic. The fourth part shows the effectiveness and tractability of algorithm using simulated data and real network traffic. The last part concludes the paper.
2. Self-Similarity, Long-Range Dependence and Traditional Hurst Index Estimation
 is a broad stationary stochastic process, with a constant mean μ=E[Xi], finite variance
 . Its auto-correlation function
 is only with the k-related, (k = 0,1,2, ...).
 ,
, 
 express an m-order aggregation of broad stationary random process. The autocorrelation function of
  is
is .
.
Definition 1 [9]: For stochastic process X, if  and
and , m= 1,2,3,…,then X is called second-order accurate self-similar process. Its self-similarity parameter (Hurst parameter) is H = 1-β/2, in which 0 < β <1.
Definition 2[9]: For stochastic process X, if k is big enough,  and
and ,
,  , then X is called a asymptotic second-order self-similar process. Its self-similarity parameter is H = 1-β/2, in which 0 < β <1.
Theory 1[9]: For a stationary process X, if ,
,  , r=2H-1, 1/2< H<1, the process X has long-range dependence. The spectral density is attenuated according to the hyperbolic form,
  ,
, .
.
Definition 2[9]: For random process X, if the tail distribution function approximates in power law,  , 0<
, 0< <2, c>0, then X is called heavy-tailed distribution.
A significant feature of heavy-tailed distribution is that it has infinite variance. One of the most commonly used heavy-tailed distributions is the Pareto distribution. The distribution function is , 0< α<2, α for the shape parameter determining the severity of trailing of tail distribution function and b for the location parameter.
The transmission of network business includes the application layer, transport layer, network layer and data link layer. The application layer is the data source of network transmission, presents the self-similarity in wide time range, for example the heavy-tailed distribution of the file size and packet arrival time interval. The heavytailed distribution in application-layer is considered the main physical characteristic of network traffic self-similarity. The self-similarity in application layer is thus mapped and introduces the self-similarity to the underlying network layer.
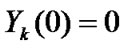
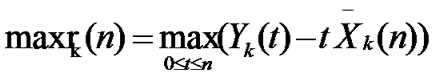
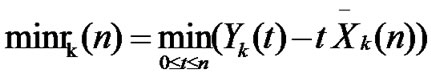
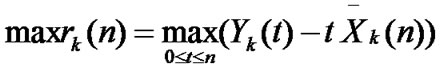
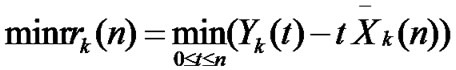
Theory 2[9]: For a given time series 
 , partial summation is
 , the sample variance is
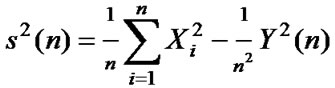 , and then the R/S statistic is as follows:
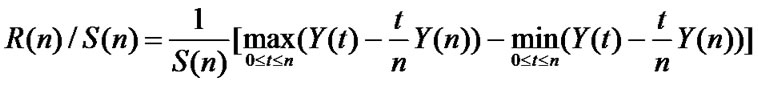 If
If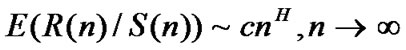 , 1/2< H<1, c is the normal number which is independent with n, then the time series has long-dependence.
The R/S estimation method for Hurst index is as follows:
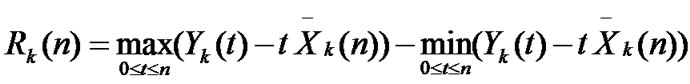
• Divide the time series  into K groups. The length of each group is n=N/K,
 ;
;
• Calculate the mean and variance of each group, ,
,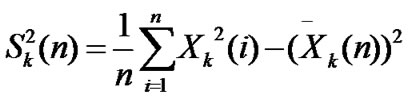
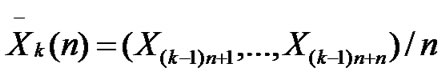 ;
;
• Calculate  of each group,
 ,
, 
 ,
, ;
;
• Calculate the mean of ,
, ;
;
• Repeat the above steps to get several  for different n and K;
• Draw all the points ( ,
, ) in the coordinate diagram; fit a straight line through these points according to the least mean square criteria, and then the slope of this line is the Hurst index.
Superposition of a large number of independent ON/OFF sources can generate self-similar volume of business. In the ON period, the packets enter the network, in the OFF period, no packet generated. ON/OFF duration is Pareto distribution. When 1< α<2, the infinite number of such ON/OFF sources will generate self-similar volume of business, of which Hurst parameter is H = (3-α)/2. When a sufficient not infinite number of superposition of independent ON/OFF sources, we will get a very high degree of self-similar volume of business. In this section, simulation software OPNET is used. The packet arrival time interval is the 0.2s in each ON cycle, so the send rate is 5packet/s. The superposetion of 50 such ON/OFF source will generate network similar traffic, of which the average packet arrival rate is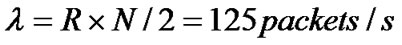 , R for the sending rate of each ON/OFF sources and N for the superposition number of ON/OFF sources. In OPNET, each ON/OFF source packet inter-arrival interval is the Pareto distribution. When the value of α is set to 1.8, 1.6, 1.4 and 1.2 respectively, the corresponding Hurst index of the selfsimilar traffic is 0.6, 0.7, 0.8 and 0.9 accordingly. In the above modeling, simulation time was 24576 seconds and the data time series length is 8192, as shown in Figure 1.
Figure 2 shows the Hurst index estimation results of ON/OFF simulated flows using the R/S estimation method. Not any Hurst index estimation algorithm is generally applicable to any situation; there is always the estimate error in the different circumstances. Each estimation algorithm uses the different statistics; different factors have an impact on the corresponding statistics, and therefore cause the algorithms the different degrees of estimation error. The main factors are non-stationary nature and periodic component, and the white noise when sampling the data series. In addition, the various types of algorithms are based on the global domain summation and average, so the variability of data series will be smoothed out. The stronger variability the data series have, the bigger estimation error the algorithm will cause.
In addition, Hurst index estimation based on limited time series will also cause some degree of estimation
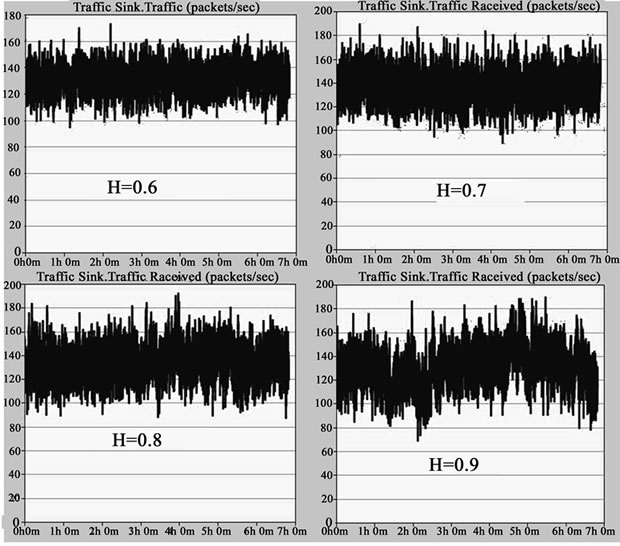
Figure 1. The simulation of time series.
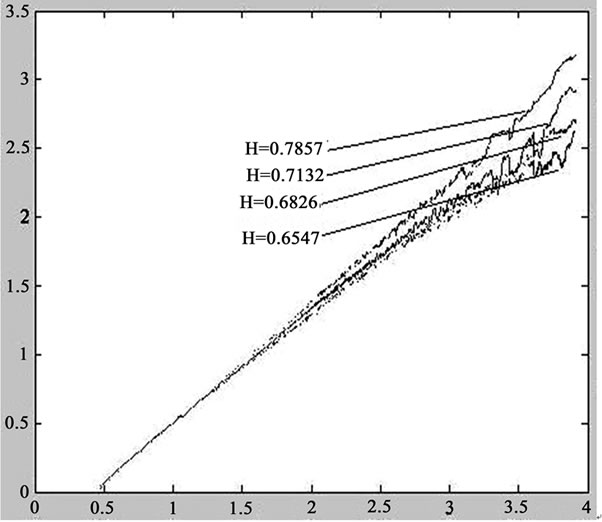
Figure 2. The hurst index estimation using the R/S method.
error. According to the definition of long-range dependence, we need to estimate the Hurst index with infinite time series. We know that with the evolution of network traffic over time, more and more data are generated. Based on the gradually increased data set, we can get a series of Hurst index estimation values which asymptotically tend to theory value. Moreover, a single Hurst index estimation based on limited time series is difficult to reflect the sudden nature of network traffic, but a series of Hurst index estimation values can capture the sudden information in local network traffic dynamically.
3. The Dynamic and Asymptotic Algorithm of Hurst Index Estimation
The length of network traffic time series will increase limitless in real-time sampling process. Strictly speaking, Hurst index estimation should not use the time series with limited length, because the mathematical definitions of self-similarity and long-range dependence are asymptotic. According to the inference method of mathematical statistics [10–11], this paper presents the dynamic and asymptotic algorithm using infinite time series.
The length of time series increase gradually, though the algorithm only computes the incremental part of time series to improve the execution speed and reduce the computational complexity. The algorithm estimates the Hurst index with the current computation values and the previous results in order not to lose previous network traffic information. The algorithm is introduced below using R/S method as an example.
The original data series is , the initial data series is
  with the length of n0, the following data series are
 ,
, , . . . ,
  with the growing length n0 < n1 < · · · < nm, the value of nm is equal to or close to the length of the data series
 .
.
• STEP1: For time series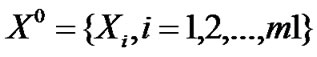 , divide it into K1 groups, the length of each group is n,
  , K1=m1/n;
• STEP2: Calculate the mean and variance of ,
, ,
, ;
;
• STEP3: Calculate  of each group,
 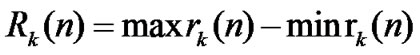 ,
,  ,
, ,
,  ,
, ;
;
• STEP4: Calculate the mean of , k=1
, k=1
,…,K1, ,
, ;
;
• STEP5: Repeat above steps to get more value of  for different n;
• STEP6: Draw all the points ( ,
, ) in the coordinate diagram, fit a straight line through these points according to the least mean square criteria, and then the slope of this line is the Hurst index of time series which length is m1;
• STEP7: When the length of time series is gradually increased to m2, . The partial data,
  , hasn’t been used for Hurst index estimation. Divide these data into (K2-K1) groups. The length of each group is n,
  K2=m2;
• STEP8: Calculate the mean and variance of , ,
, ,
 ;
;
• STEP9: Calculate  of each group,
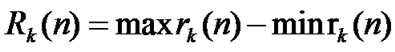 ,
,  ,
,  ,
,  ,
, ;
;
• STEP10:Calculate the mean of ,
, 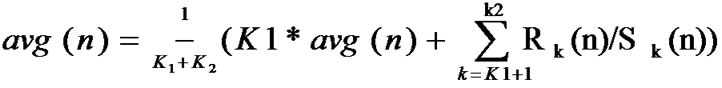 ,
, , so the old value is revised in this step based on the incremental data.
• STEP11:For different n, repeat above steps to get all the new revised value of .
.
• STEP12:Draw all the points ( ,
,
•  ) in the coordinate diagram, fit a straight line through these points according to the least mean square criteria, and then the slope of this line is the Hurst index value of time series which length is m2.
• STEP13:m1=m2,K1=K2;
• STEP14:If the length of time series increases continually, repeat the steps from 7 to 13 to revise all the values of ,
, based on the incremental data accordingly, or the loop is finished.
From above steps we can see that, by calculating the incremental part of data series, we get a series of Hurst index values which asymptotically tend to theory value. These Hurst index are continually revised based on a new period of data series, so the new revised Hurst index value can reflect the degree of sudden nature of current local network traffic dynamically. At the same time, when the length of time series increases to infinite, the obtained Hurst index value will reflect the long-range dependence of the overall network traffic.
4. Algorithm Validations
4.1. The Simulation Data Validation
In OPNET, the ON/OFF source packet inter-arrival interval is the Pareto distribution. The value of α is set to 1.6. According to H=(3-α)/2, the corresponding Hurst index of the self-similar traffic is 0.7. The simulation time is extended to 904.8 hours, and the length of time series D is extended to 524288.
We apply the proposed algorithm to estimate the Hurst index of the data series D. The value of variable i is increased to 9, and the length of the data series is increased as follows,  = 512, 1024, 2048, 4096, 8192, 16384, 32768, 65536, 131072, 262144 and 524288 respectively. As shown in Figure 3, the time-scales are from 9 to 19. A series of Hurst index fluctuate in form of the asymptotic trend around the theory value of 0.7, proving that data series D has long-range dependence. The Hurst index is not static and will change with the evolution of network traffic. Any estimation of Hurst index based on the limited data series will draw the wrong conclusion.
Secondly, we use the data series E with the Hurst index of 0.5 to verify the algorithm presented in this paper. Same as the data series D, the simulation time is 904.8 hours, and the length is 524288. The ON/OFF source packet inter-arrival interval is the exponential distribution.
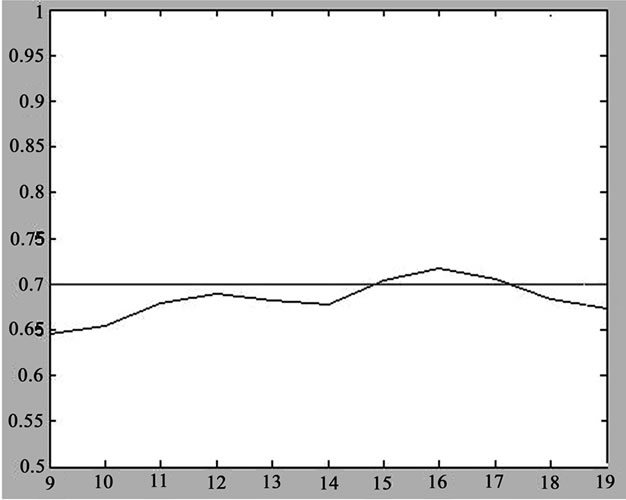
Figure 3. Hurst index estimation for data series D.
As can be seen in Figure 4, a series of Hurst index values also fluctuate slowly. The difference from Figure 3 is that Figure 4 is in form of the asymptotic trend around 0.5. The reason is due to the exponential distribution in the ON/OFF source packet inter-arrival interval. So the time series E has not characteristics of self-similar and long-range dependence. But if the Hurst index estimation is based on the limited length of time series of time scale 9, 10, or 11, then Hurst index will be greater than 0.5 and
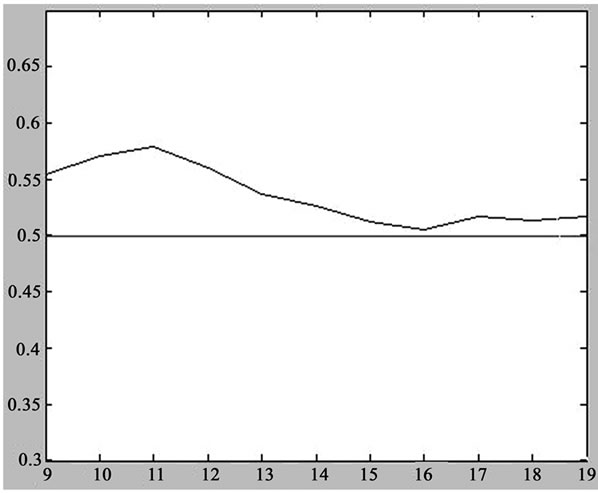
Figure 4. Hurst index estimation for data series E.
 (a) (b)
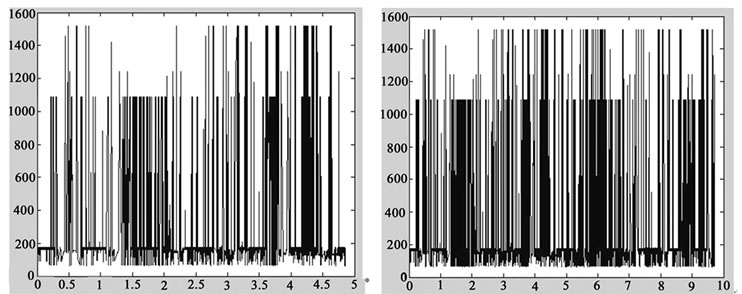 (c)(d)
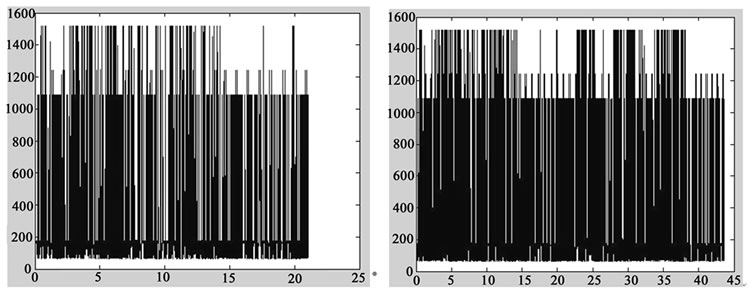 (e) (f)
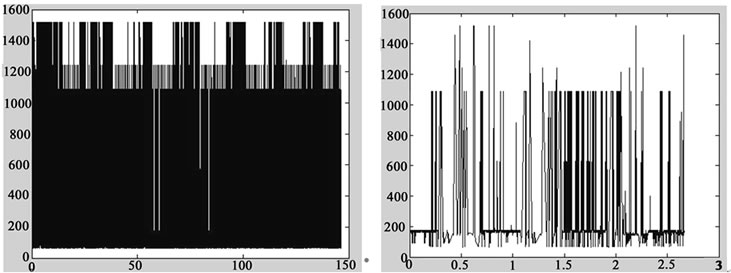
Figure 5. BC-pAu989 data series. (a)BC-pAu989 data series; (b)Length of 1024; (c) Length of 2048; (d) Length of 4096; (e) Length of 8192; (f) Length of 16384.
the wrong conclusions may be drawn. The algorithm presented in this paper considers the asymptotic trend of a series of Hurst index, and comes to the conclusion that the busty traffic of time series E becomes weaker and weaker to zero, and do not have the characteristics of long-range dependence.
4.2. The Actual Network Traffic Data Validation
Finally, the proposed algorithm is applied to the BC-pAu989 data series. BC-pAu989 data series is a real network traffic data series collected in Bellcore [12].
The real data series has a clear evidence of self-similarity, shown in Figure 5(a). The sudden nature of data series with length of 1024 shown in Figure 5(b) is week. The sudden nature is enhanced significantly in Figure 5(c) decreased slightly in Figure 5(d), decreased significantly in Figure 5(e), and enhanced significantly again in Figure5(f).
The algorithm is applied to all these data series, a series of Hurst index estimation values are shown in Table 1. We can see that the Hurst index values change with the degree of sudden network traffic accordingly. The time-varying Hurst index estimation values dynamically track the local sudden degree of BC-pAu989 network traffic analyzed above.
Certainly, Figure 6 shows that this series of Hurst index fluctuate in form of the asymptotic trend around the theory value of 0.72, proving that the BC-pAu989 time
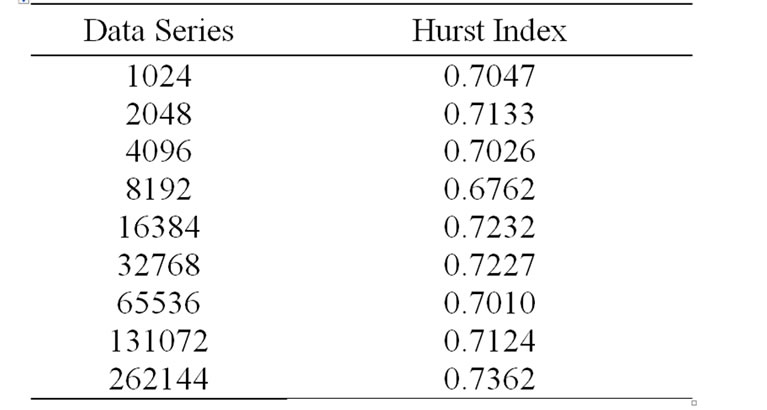
Table 1. Hurst index estimation on BC-pAu989 data series.
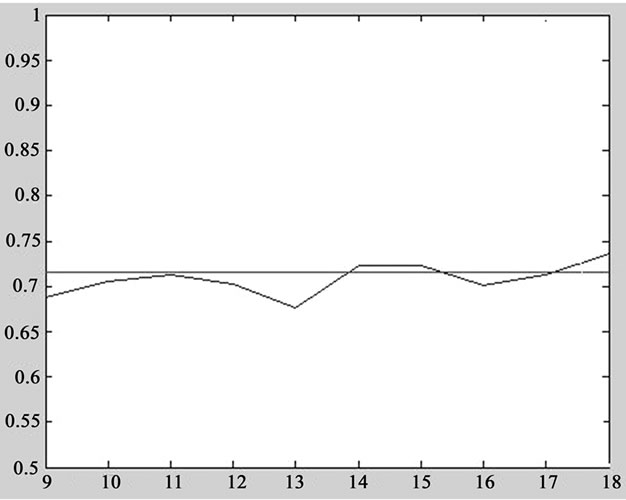
Figure 6. Tracking the local sudden traffic dynamically.
series has long-range dependence, which is consistent with the results of the literature [13].
5. Conclusions
Hurst index is an important parameter to describe the sudden nature of network traffic. To avoid the estimation error, the dynamic and asymptotic algorithm of Hurst index estimation is proposed in this paper. As the length of data series is gradually increased, the algorithm only calculates the incremental part of data series to reduce the computational complexity. A series of Hurst index values will be getting quickly in real-time. This series of Hurst index will change asymptotically from near to far infinite time scales, which is strictly in line with the mathematical definition of long-range dependence. At the same, the time-varying Hurst index values also track the local sudden information of network traffic dynamically. The effectiveness and tractability of the algorithm are validated by the simulated data series generated in OPENNET software and the real network traffic respectively. The algorithm can truly reflect the local sudden nature and the long-range dependence of network traffic.
6. References
[1] K. Park and W. Willinger, “Self-similar network traffic and performance evaluation,” Wiley-Interscience, New York, 2000.
[2] S. Y. Yin and X. K. Lin, “Traffic self-similarity in mobile ad hoc networks,” in Proceedings of Second IFIP International Conference Wireless and Optical Communications Networks, pp. 285–289, 2005.
[3] A. Athanasopoulos, E. ToPalis, C. D. Antonopoulos et al., “Evaluation analysis of the permance of IEEE802.1lb and IEEE802.llg standards,” in Proceedings of International Conference Networking, International Conference on Systems and International Conference on Mobile Communications and Leaning Technologies, available at: http://doi.ieeecomputersociety.org/l0.ll09/ICNICONSMCL, 2006.
[4] M. Jiang, M. Nikolic, S. Hardy et al. “Impact of self-similarity on wireless data network Performance,” ICC 2001, IEEE International Conference Communications, Vol. 2, No. 11–14, pp. 477–481, 2001.
[5] J. S. Zh., H. Ming, and N. B. Shroff, “Sudden data over CDMA: MAI self-similarity, rate control and admission control and admission control,” in proceedings of IEEE INFOCOM 2002, Vol. 1, No. 23–27, pp. 391–399, 2002.
[6] R. Kalden and S. Ibrahim, “Searching for self-similarity in GPRS[C],” The 5th Annual Passive & Active Measurement Workshop, PAM 2004, France, April 2004.
[7] Muradtaqqu. Methods. http://math.bu.edu/people /murad/ methods/index.html, September 2005.
[8] J. W. Wei, J. Zhang, and J. X. Wu, “A long-range dependence sliding window time-varying estimation algorithm for network traffic,” Journal of Computer Research and Development, Vol. 45, No. 3, pp. 436–442, 2008.
[9] O. Cappe, E. Moulines, A. PetroPulu et al., “Long-range dependence and heavy-tail modeling for teletraffic data,” IEEE Signal Processing Magazine, Special Issue on Analysis and Modeling of High-Speed Data Network Traffic,” Vol. 19, No. 5, pp. 14–27, May 2002.
[10] D. R. Figueiredo, B. Liu, V. Misra, and D. Towsley, “On the autocorrelation structure of TCP traffic, Computer Networks, Vol. 40, No. 3, pp. 339–361, 2002.
[11] D. R. Figueiredo, B. Y. Liu, A. Feldmann, V. Misra, D. Towsley, and W. Willinger, “On TCP and self-similar traffic,” Performance Evaluation, 2005.
[12] P. Danzig, J. Mogul, and V. Paxaon, “Traces available in the interact traffic archive,” http://ira.ee.1b1.gov/html /tmces.html. September 2005.
[13] W. E. Leland, M. S. Taqqu, and W. Willinger, et a1. “On the self-similar nature of ethernet traffic,” IEEE/ACM Transactions on Networking, Vol. 2, No. 1, pp. l–15. 1994.