Journal of Water Resource and Protection
Vol.6 No.1(2014), Article ID:42353,6 pages DOI:10.4236/jwarp.2014.61008
Chemical Evaluation of Groundwater from Supply Wells in the State of Coahuila, México
1Centro de Investigaciones Químicas, Universidad Autónoma del Estado de Morelos, Cuernavaca, México
2Facultad de Ciencias Químicas, Universidad Autónoma de Coahuila, Saltillo, México
3Instituto de Medicina Forense, Universidad Veracruzana, Veracruz, México
4Centro de Ciencias de la Atmósfera, Universidad Nacional Autónoma de México, Ciudad de México, México
Email: *hsaldarriaga@uaem.mx
Received November 29, 2013; revised December 31, 2013; accepted January 28, 2014
ABSTRACT
The present study is conducted with the purpose of determining the chemical characteristics of groundwater that supplies 16 wells in the state of Coahuila, which are used for different human activities. Sampling was conducted in January 2011. For 56% of the fifteen wells tested, analysis did not detect the presence of aluminum; however, wells 2, 3, 6, 8 and 13 had concentrations above the permissible limit established by the Mexican standard NOM-127-SSA1-1994. For cadmium, only the well 3 was above the Norm. Meanwhile, iron was above the permissible limit in eight wells (2, 4, 5, 6, 9, 12, 13 and 15). Lead exceeded the limit in wells 6, 7, 9, 10, 11 and 12. In general, for the rest of the parameters listed in the Norm, values were below allowable limits. By using Piper diagrams, it was observed that in general, the waters tested showed characteristic calcium bicarbonate. By establishing a matrix of correlations between chemical parameters, it was observed that the highest significant correlations occurred among carbonate hardness, calcium, lead and total alkalinity, with r2 values greater than 0.82. Also, high correlations were found between some metal species, suggesting a common origin. The allowed Principal Component Analysis and Cluster Analysis establish the associations between all analyzed physicochemical parameters, and they also determine the wells with similar characteristics.
Keywords:Groundwater; Coahuila; Physicochemical Parameters; Piper’s Diagram; PCA
1. Introduction
The main source of water supply for agricultural and industrial activities, as well as for human consumption in arid and semiarid regions of the republic, is groundwater. One of the most arid regions of the country is the Northeast region, in which the state of Coahuila is located. This state has the third lowest precipitation, with an annual average of around 350 mm, with values ranging between 150 and 550 mm annually. The highest rainfall occurs in the northern part of the state. The rainy season runs from June to September, when 75 percent of the average annual rainfall occurs. As for temperature, June and July are the hottest months with temperatures up to 47˚C in the city of Monclova. The winters are cold, with minimum temperatures of 0 to −16˚C, the latter in the Sierra of Arteaga. The months of transition between wet and dry period are May and October and the dry season is the period from November to April, with the minimum values in February and March.
Coahuila has two of the hydrologic regions considered the largest in the North Country: The Bravo-Conchos and the Nazas river. It has five large dams: Venustiano Carranza, also known as Don Martin, la Amistad, la Fragua, Piedritas, and Nochebuena. Although Centenario and San Miguel dams do not have large capacities, they are an important source of supply for the irrigation of district 006 [1]. Nevertheless, the state does not have sufficient surface water. For this reason, groundwater constitutes the main source of supply for various activities.
This situation is further complicated if one takes into account the many instances of urban runoff; for example in Torreón, Gómez Palacio and Ciudad Lerdo, the waters are contaminated with arsenic, with the concentration tending to increase by over exploitation of the aquifer. It is worth mentioning that if the groundwater quality is not optimal, there will be immediate concerns for both the system water-crop-soil and human health. Water quality depends on the geochemical characteristics, as well as human activities that take place in the region, such as industrialization, mining and urbanization [2]. While some of the physicochemical parameters evaluated in the water, such as acidity, hardness, alkalinity and total solids, among others, do not represent a health risk, they are important in establishing treatment processes. However, there are other constituents in the groundwater that have the greatest risk to human health. In this regard, several studies conducted in the Republic have shown significant levels of certain metals and metalloids in groundwater. For example, Alarcón-Herrera et al. [3] found in their research that in the region of Valle del Guadiana (Durango), concentration levels of arsenic (As) in some drinking water wells exceeded the limits recommended by the World Health Organization (WHO) and the maximum limit set by Mexican law. For his part, Del Razo et al. [4], found that in the Laguna area concentration levels of arsenic obtained for 128 water samples ranged between 0.008 and 0.624 mg∙L−1 and also highlighted that 50% of the samples had concentrations greater than 0.05 mg∙L−1. In a recent study conducted by the Munici- pal Water System and Sanitation Torreón, National Water Commission, Ministry of Health in Coahuila and the Faculty of Medicine, University of Coahuila, Torreón Unit [5], levels of arsenic were found that ranged between 0.026 and 0.065 mg∙L−1, which attracted the attention of the authorities, since these concentrations were above the values set in the Mexican Standard [6]. But arsenic is not the only species occurring in groundwater. It is found along with many other coexisting metalloids and metals, such as fluorine, boron, lithium, lead, copper, mercury, nickel, aluminum, cadmium and manganese. Although they all occur in different proportions, they represent risks to human health since these elements, once in groundwater, are incorporated into the food chain in different ways, e.g. they can be found in treated water, grass, vegetables, milk and beef, among others [7,8]. For example, arsenic is associated with peripheral vascular disease, gastrointestinal disturbances, skin lesions, cancer of the pancreas and liver [9-11]. For its part, cadmium was linked with kidney disease and decreased bone density, while lead was allocated memory effects, neurological damage and damage to the kidney [10,12,13]. Aluminum impacts the central nervous system and bone and blood systems [13]. For all the above, the purpose of this study was to evaluate the quality of groundwater in 16 wells in the region, by determining the content of inorganic ions, metals and some physicochemical parameters, in order to establish if these sources of water could be used for diverse human activities, especially for human consumption.
2. Materials and Methods
2.1. Study Area
All wells are located in the southwestern region of the state of Coahuila. This area concentrates a large number of people, so that the consumption of good quality water is needed for diverse human activities (Figure 1).
2.2. Sampling
Sampling was conducted during January 2011 for evaluation of physical and chemical parameters. About 3.0 liters were taken at each of the sites using previously conditioned polypropylene containers. Following collection the samples were refrigerated at 4˚C until analysis. Also, for the determination of metals an additional sample of 1.0 liter was taken, which was acidified with sul-

Figure 1. Location of 16 wells sampled in the southwestern of the state of Coahuila.
furic acid immediately after the sample was taken and later transferred to the laboratory for evaluation.
2.3. Analysis
The conductivity was determined directly with a conductivity meter, (Orion, model 130) previously calibrated with standard solution 1413 µS∙cm−1. The pH was determined with a potentiometer, (Corning, model 220) with an accuracy of 0.01 pH units, equipped with a combined glass electrode and calibrated at two points with buffer solutions of 4.00 and 7.00 pH units. Acidity was analyzed by titrating of sample with sodium hydroxide to a pH of 8.3. Alkalinity was determined by titration with sulfuric acid to a pH of 4.5. Hardness was determined by titration with a chelating agent, ethylenediaminetetraacetic acid (EDTA) and Eriochrome Black T as indicator.
For Sulfates and chlorides analysis each sample was diluted by pipetting 5 mL into a 50-mL volumetric flask and filling to volume with deionized water, a Metrohm ion chromatography system was used in conjunction with a conductivity detector. The column used for separation was a Metrosep A Supp 5-100 column, at 4.0 × 100 mm with particle size 5.0 μm. Analysis was carried out with a flow rate of 0.70 mL per min at 35.0˚C. The injection loop volume was 25.0 μL. For the determination of total metals, 45 ml of water sample were taken and were added 5 ml of nitric acid and digested in a microwave oven, digested samples were analyzed by atomic absorption spectrometry.
All parameters were evaluated according to the Mexican Official Standard, EPA 901/3-88-001 and Standard Methods for the Examination of Water and Wastewater.
2.4. Quality Control
The detection limits (3s) for analyzed metals were 0.003, 0.0001, 0.001, 0.002, 0.002, 0.008, 0.0006, 0.008, 0.004, 0.0002 mg∙L−1 for Al, Ba, Cd, Cu, Mn, Pb, Zn, Na, Fe, and Mg, respectively. Meanwhile for anions the detection limits were 0.255 and 0.137 mg∙L−1 for  and Cl−1, respectively. In the spike recovery test a water sample was spiked with target analytes of interest. The percentages of recoveries for different analytes were found in the range of 93% - 104%.
2.5. Statistical Analysis
Spearman correlations were determined for to know the common parameters that are influencing the composition in the 16 wells. The Principal Component Analysis (PCA) was carried out with varimax normalized rotation and was applied to the concentrations of all analyzed parameters. Also a cluster analysis by the Ward method of correlation was used to establish associations between the wells.
3. Results and Discussion
3.1. Physicochemical Properties of Water
The assessment of water quality is to identify the possibility that a body or source of water can be treated, among others, either for human consumption or for other activities such as agriculture or industry. Undoubtedly this quality will depend on water-soil interactions and various anthropogenic activities that are located around the well head.
The results obtained for the physicochemical parameters evaluated in the 16 wells are shown in Table1 These data showed that all wells possess neutral pH values ranging between 7.05 and 7.61, so that parameter could be considered within safe limits (6.5 - 8.5) proposed by the World Health Organization(WHO, 1984) and the NOM-127-SSA1-1994 for drinking water. In the case of total dissolved solids (TDS) wells 9, 12 and 14 showed higher concentrations; 750, 689 and 780 mg∙L−1, respectively. This is consistent with their respective content of anions and cations in each sample; which is to say, the higher content of ionic species, the higher concentrations of TDS. It should be noted that although these wells have high values of TDS with respect to the others, they remain below the limit (1000 mg∙L−1) established by the Mexican Official Norm (NOM-127-SSA1-1994).
The type of water can be evaluated by the content of anions and cations. In general, for all wells tested, except for wells 1 and 2, the order of abundance for anions was  >
>  > Cl−, while for the cations the order was Ca2 + > Na+ > Mg2+, except for wells 2, 3, 6 and 9.
3.2. Hydrochemical Characteristics
From the point of view of hydrochemical analysis of groundwaters, these waters can mainly qualify as calcicbicarbonated, followed by calcic-sulfated, due to the fact that the sulfates concentration was lower in the majority of the samples. Meanwhile, calcium was higher than magnesium and sodium, as can be observed in Table 2 and in the Piper’s graph (Figure 2), which is widely used in evaluations of underground waters. The previous indicates that waters infiltrate into calcic rocks which leach bicarbonate ions back to the waters from which the leachate originated.
3.3. Metals Concentration in the Groundwater
As mentioned above, the metals play an important role in water quality. Metals such as chromium, cobalt, cadmium, lead and manganese, among others, allow diverse biologic activities to occur. However, if they are present in excess they could be associated with toxicological processes in living organisms. The most abundant metals present were iron and aluminum, with levels one and two

Table 1 . Values of physical-chemical parameters obtained for the 16 wells tested in the state of Coahuila, in January 2011.
TDS: Total Dissolve Solids; TS: Total Solids; Cond: Conductivity.
Table 2. Values of ionic species and metals in mg∙L−1, determined in 16 wells in the state of Coahuila, in January 2011.
n.d.: not determined.

Figure 2. Piper’s diagram for the 16 wells tested in the State of Coahuila.
orders of magnitude over the other elements. The results revealed that 56% of the wells tested (9) did not detect the presence of aluminum; however, wells 2, 3, 6, 8, and 13 had concentrations above of the permissible limit established in NOM-127-SSA1-1994.
In the case of cadmium, only sample 3 was above the allowed limit. Meanwhile, iron was above allowable levels in 8 wells (2, 4, 5, 6, 9, 12, 13 and 15). Lead exceeded the allowed limit established in the same norm in wells 6, 7, 9, 10, 11 and 12 (Table 2), which indicates that some anthropogenic activities are developing around these areas. It is significant to mention, within four metals that exceeded the norm in some of the wells, aluminum and iron are not considered within the most toxic group, but the danger cannot be totally discounted, as some studies have shown that high concentrations can cause internal organ damage [7,8]. It is important to indicate that more comprehensive studies should be developed, where different seasons are considered, as well as the number of samples, in order to obtain more representative data for the study area.
3.4. Correlations between Physicochemical Parameters In order to better explain the behavior of all parameters examined in the 16 wells, a Spearman correlation matrix was established (Table 3). The results showed high associations (p < 0.05) between total hardness, calcium, bicarbonate and alkalinity. Also, other significant correlations were presented to a lesser extent with lead, chlorides and sulfates, among others. This information is relevant for the supply systems’ operators, which can control the supply of such wells, allowing modification of the original composition of the water and establishment of appropriate treatment processes. It would also allow identification of some common sources.
3.5. Principal Component Analysis and Cluster Analysis
The results of the Principal Component Analysis (PCA) indicate that the dimensionality of the array is reduced to six components with eigenvalues that ranged from 1.18 to 7.78, explaining the 85.34% of the variance (Figure 3).
The Principal Component (PC1) explains 38.92% of the variance, the variables with greater loading were alkalinity, bicarbonates, calcium, hardness, acidity, lead and sulfates. PC2, which represented the 15.03% of the variance, showed significant loadings for copper, iron, sodium, magnesium, pH and hardness. PC3 explained the 9.02% and basically related to conductivity, magnesium, cadmium and total solids. PC4 explained the 8.56% and was associated with chlorides, sulfates and sodium. PC5 represented the 7.86% of the variance, was mainly formed by aluminium and zinc, while PC6 explained the 5.92% of the remaining variance and was basically constituted by cadmium.
To complement the PCA, a cluster analysis by the Ward method of correlation, was used to establish associations between the sampled wells. The dendrogram shows the correlation between wells 1 and 4, 5, 8 and 15, 7 and 11, and 9 and 10 (Figure 4). The above information may provide support for operators of the aqueduct in this area, in order to control the composition of the water supplied and determine whether or not required the suspension of some of the wells.
4. Conclusions
In general, the results obtained for the physicochemical parameters indicate that the 16 wells are within the limits allowed by the Mexican Official Standard; however, it must be considered in terms of metal content, some of
Table 3 . Matrix of correlations between physical-chemical parameters and ionic species and metals evaluated in 16 wells in the state of Coahuila, in January 2011.
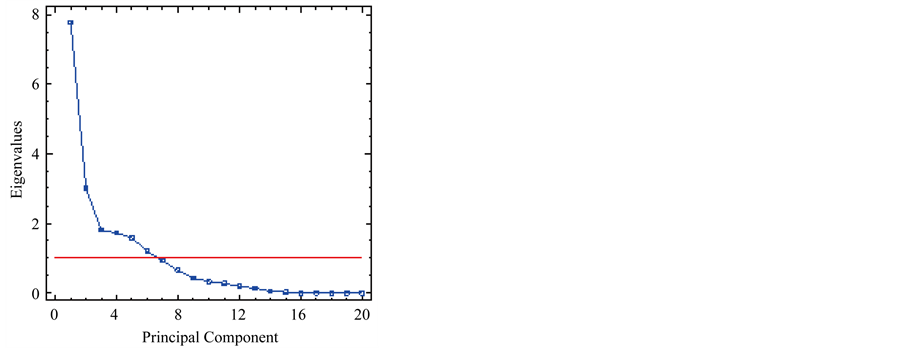
Figure 3. Number of principal components with eigenvalues greater than 1.0.

Figure 4. Ward’s method for cluster analysis.
which are above the limit set by the same standard. It must be careful with the wells that had these values, for the purpose of giving detailed and continuous follow-up.
The correlations observed between chemical parameters in the different wells can enable us to control the composition of water in the zone depending on the pumping of wells, the analysis time of the filtrated and flow allowed for each of them.
The allowed Principal Component Analysis and Cluster analysis identify main common variables with the major loading in the composition of the wells, and those wells with similar physicochemical characteristics as well.
Acknowledgements
The authors express their appreciation to Winston Smith of the Peace Corps Mexico for his help in editing this article and to Comisión Estatal de Aguas y Saneamiento (CEAS), for carried out the samplings.
Conflicts of Interest
The author declares no conflict of interest.
REFERENCES
- Comisión Nacional del Agua, 2011.
- http://www.conagua.gob.mx/DLCoah/Espaniol/TmpContenido.aspx?Id=4ea72325-526a-4211-bf9a-6549b9c3f53 c%7CCon%C3%B3cenos%7C1%7C0%7C0%7C0%7C0
- Y. R. Srinivasa, T. V. K. Reddy and P. T. Nayudu, “Groundwater Quality in the Niva River Basin, Chittoor District, Andhra Pradesh, India,” Environmental Geology, Vol. 32, No. 1, 1997, pp. 56-63. http://dx.doi.org/10.1007/s002540050193
- M. T. Alarcón-Herrera, I. Flores-Montenegro, P. RomeroNavar, I. R. Martín-Domínguez and R. Trejo-Vázquez, “Contenido de Arsénico en el Agua Potable del Valle del Guadiana, México,” Ingeniería Hidráulica en México, Vol. 16, 2001, pp. 63-70.
- L. M. Del Razo, M. A. Arellano and M. E. Cebrián, “The Oxidation States of Arsenic in Well-Water from a Chronic Arsenicism Area of Northern Mexico,” Environmental Pollution, Vol. 64, 1990, pp. 143-153. http://dx.doi.org/10.1016/0269-7491(90)90111-O
- C. Rodríguez, “Calidad del Agua en el Estado de Coahuila,” Milenio Newspaper, Monterrey, 2013. http://www.milenio.com/node/576734
- Mexican Official Standard, “NOM-127-SSA1-1994,” 2013. http://www.mexicanlaws.com/salud/NOM-127-SSA1-1994.htm
- N. E. Akbulut and A. M. Tuncer, “Accumulation of Heavy Metals with Water Quality Parameters in Kızılırmak River Basin (Delice River) in Turkey,” Environmental Monitoring and Assessment, Vol. 173, No. 1-4, 2011, pp. 387- 395. http://dx.doi.org/10.1007/s10661-010-1394-7
- S. Chatterjee, B. Chattopadhyay and S. K. Mukhopadhyay, “Trace Metal Distribution in Tissues of Cıchlıds (Orechromısniloticus and O. mossambicus) Collected from Wastewater Fed Fishponds in East Calcutta Wetlands a Ramsar Site,” Acta Ichthyologica et Piscatoria, Vol. 36, 2006, pp. 119-125.
- M. A. Armienta, R. Rodriguez and O. Cruz, “Arsenic Content in Hair of People Exposed to Natural Arsenic Polluted Groundwater at Zimapan, Mexico,” Bulletin of Environmental Contamination and Toxicology, Vol. 59, No. 4, 1997, pp. 583-589. http://dx.doi.org/10.1007/s001289900519
- L. Jarup, “Hazards of Heavy Metal Contamination,” British Medical Bulletin, Vol. 68, No. 1, 2003, pp. 167-182. http://dx.doi.org/10.1093/bmb/ldg032
- M. N. Rahman, U. K. Chowdhury and S. C. Mukherjee, “Chronic Arsenic Toxicity in Bangladesh and West Bengal India: A Review and Commentary,” Journal of Clinical Toxicology, Vol. 39, No. 7, 2001, pp. 683-700.
- A. Akesson, P. Bjellerup, T. Lundh, et al., “Cadmium Induced Effects on Bone in a Population Based Study of Women,” Environmental Health and Perspectives, Vol. 114, No. 6, 2006, pp. 830-834. http://dx.doi.org/10.1289/ehp.8763
NOTES
*Corresponding author.