Journal of Water Resource and Protection
Vol.5 No.6(2013), Article ID:33456,9 pages DOI:10.4236/jwarp.2013.56064
Groundwater Investigation Using Geoelectrical Method: A Case Study of the Western Region of Cameroon
1Faculty of Science, University of Yaounde I, Yaounde, Cameroon
2National Institute of Cartography—Cameroon, Yaounde, Cameroon
3Faculty of Science, University of Bamenda, Bamenda, Cameroon
Email: *jtadjou1@yahoo.fr
Copyright © 2013 Thomas Dupont Ananfack Keleko et al. This is an open access article distributed under the Creative Commons Attribution License, which permits unrestricted use, distribution, and reproduction in any medium, provided the original work is properly cited.
Received April 5, 2013; revised May 7, 2013; accepted May 30, 2013
Keywords: Vertical Electrical Sounding; Groundwater; Geoelectric Section; Aquifer; Resistivity
ABSTRACT
A geoelectrical survey using the electrical resistivity method was carried out in some villages in the western region of Cameroon to investigate the sub-surface layers and evaluate the characteristics of aquifers. The direct current electrical resistivity method was utilized for the present study. Applying the Schlumberger array, a total of twenty four (24) Vertical Electrical Soundings (VES) were conducted. Quantitative and qualitative interpretations of data were carried out to determine the nature and thickness of the aquifer zone combined with existing litho-logs aided correlation of geoelectric sections to litho-logs. Four to five geoelectric layers were delineated from the survey area. The first layer which is the topsoil has resistivity values ranging from 6 - 949 Ωm and the thickness is between 0.2 - 4.2 m. The second layer which is made up of clay and laterite has resistivity values ranging between 9 - 1862 Ωm and thickness range from 1.0 - 16.4 m. The third and fourth geoelectric layers are made up of clay and granite/basalts with thickness varying from 2.2 - 39.5 m which corresponds to an aquifer horizon. Resistivity values of the aquifer ranges from 10 to 70,506 Ωm. The resistivity map drawn from these measurements shows the presence of a low resistivity zone which indicates the reflection in the direction of ground water from northeast to southwest with the recharge concentrated to the south of the study area. This study has revealed for this area, an average depth of the aquifer of 32 m with the average thickness of the aquifer being 22 m. The geoelectric sections of some VES stations demarcated corroborate very well with the geological description of the area.
1. Introduction
Within the past decades, the quest for viable potable water sources has been an important issue to the villages and towns of Western Region of Cameroon. However, an exploitation of such sources must be carried out with utmost care in order to avoid depleting them and to ensure a long-lasting use of potable water. The progressive population growth has led to severe shortage of potable water for the area. This poses as a great challenge to both the citizens and the Government [1]. Thus, the inadequate supply of potable water in the area has been a chronic problem. Surface water provides the major sources for all purposes in the area and it has grossly become inadequate due to urbanization and an increasing demand for water. This area will be rescued from chronic shortage of water if prospection for a steady and reliable water supply from subsurface or groundwater is carried out. The integration of aquifer parameters calculated from existing borehole locations and surface resistivity parameters extracted from surface electrical measurements was used effectively.
This research work, which is an application of electrical resistivity survey method, is an attempt to bring a solution to the problem. The method is regularly used to solve a wide variety of groundwater problems, such as: in the determination of depth, thickness and boundary of an aquifer [2-5]; the identification of zone with high yield potential in an aquifer [6] and the estimation of aquifer specific yield [7]. The present investigation is aimed at producing a database which could be used for detailed groundwater exploration activities in the area of study.
2. Hydrogeology and Geology
The study area is located between latitude 5˚00'N to 5˚24'N and longitude 10˚00'E to 10˚30'E (Figure 1). The climate of the study area usually alternates with the dry and rainy season. The study area which is found within the southern and western parts of Cameroon has a total annual rainfall of over 1600 mm spread over the month from March to October. The highest amount of rainfall is observed in the month of August. The dry season spans from November to February. Also, the temperature is moderately high throughout the year, with an annual range from 19˚C to 24˚C, with the hottest period of the year during the dry season. The vegetation of the area is that of the rainforest which comprises various species of shrubs and high forest plants all over the area, both at the hilly and depressed parts. Its hydrographic system is constituted by permanent rivers, creeks and lakes. Its hydrogeology is characterized by continuous alterites aquifers, approximately exploitable overlying water bearing fissures or fractured aquifers in the bedrock. These types of aquifers are either superimposed or isolated.
The geology of the study area is made up of precambrian and tertiary formations [8], (Figure 1). The precambrian formations was shown by the works of [9-12] which identified a magmatic unit made up of granitic
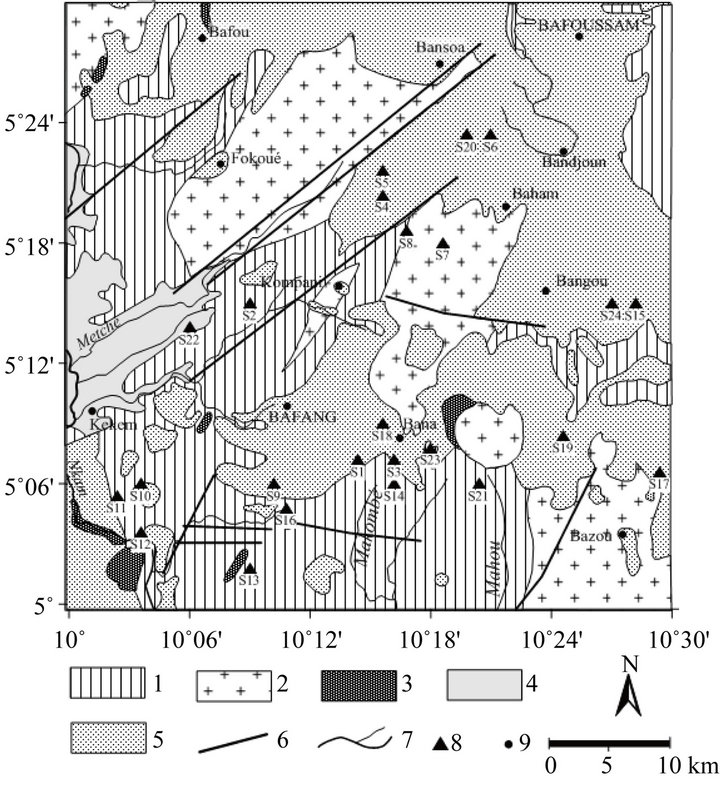
Figure 1. Synthetic geological map of the study area showing VES stations, modified from [8]. 1. gneiss; 2. granite; 3. rhyolite; 4. alluvium; 5. basalt; 6. fault; 7. rivers; 8. VES station; 9. locality.
rocks more or less ortho-gneissified essentially neoproterozoic and a metamorphic unit made up of gneiss and amphibolites essentially paleoproterozoic intruded by granitoids which form an interdependent unit.
The tertiary formations are made up of volcanic and plutonic formations. The volcanic formations [13-15] are dominated by basalts of varied nature associated with rhyolites, ignimbrites linked to a fissural dynamism, central or strombolian, in contact with the reopening to the tertiary. The Major structural lines of the Cameroon Volcanic Line are established in discordance on the granite-gneissic precambrian base. The plutonic formations are essentially ultimate granites of Bana-Batcha which constitute an anorogenic complex.
3. Resistivity Theory and Method
Electrical resistivity (ρ) is an intrinsic property of all earth materials. Resistivity is the reciprocal of electrical conductivity and thus is a measurement of a material’s resistance to the flow of an electrical current. In most porous rock systems, ionic conduction by interstitial fluids and surface conduction at the interface between solid rock matrices and electrolytic solutions are responsible for a major part of the electric current flowing through a formation [16]. Due to high cation exchange properties, clayey minerals are capable of conducting current both electronically and electrolytically at interfaces. The quality of water in a system can be evaluated using resistivity measurement obtained at land surface, assuming that the geology of the area is known. These measurements are obtained by introducing a direct current into the ground through a pair of electric current electrodes and measuring the electric potential difference between the electrodes.
In this study, the variation of electrical conductivity was investigated with the help of electrical resistivity soundings. To do this, the Terrameter model SAS 300B was used to acquire twenty four (24) Vertical Electrical Soundings (VES). They were implanted using a maximum current electrode separation of AB/2 of 100 m. Data were collected in all station using the Schlumberger electrode configuration. Figure 1 shows stations of measurement in the study area. The expression for the apparent resistivity is given by Equation (1). The apparent resistivity was plotted against half current electrode spacing on a double logarithmic paper.
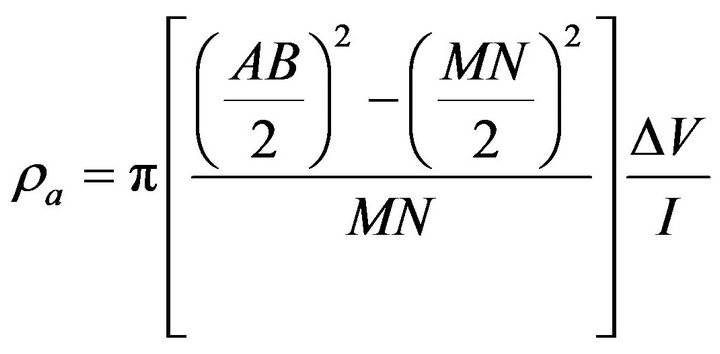 (1)
(1)
AB = Current electrode spacing in meterΔ(V) = Potential differences in voltsMN =Potential electrodes spacing in meterI = Electric current in Amperes, 
4. Results and Discussion
The computer model curves for some selected stations shows the correlation and subsequent interpretation of geoelectric logs and lithology logs are presented in Figures 2-5. Tables 1 and 2 show the following information about the various VES stations related to: the field name of the VES station; the apparent resistivity; the thickness, total thickness and number of geological layers present at the subsurface of each station.
4.1. Geoelectric Soundings Interpretation
The shapes of a VES curve depend on the number of layers in the subsurface, the apparent resistivity value and the thickness of each layer. The geoelectrical section in the study area (Figure 6) shows five distinct layers namely top soil, clay, laterite, basalts and granite.

Figure 2. Comparison of drill hole log of BAMEKA and the computer interpretation curve of VES S6.
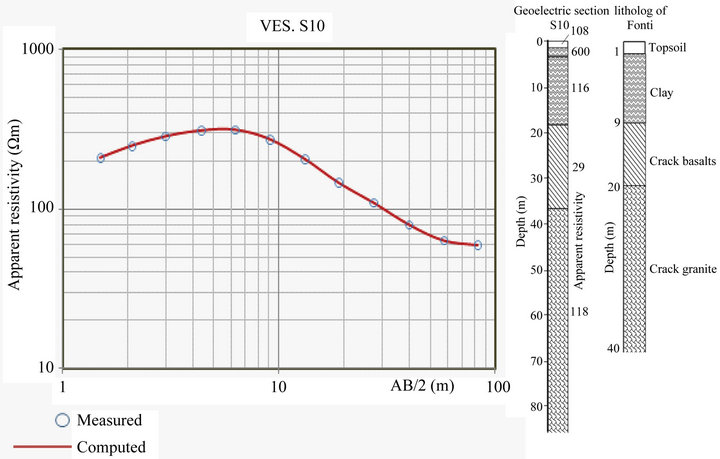
Figure 3. Comparison of drill hole log of FONTI and the computer interpretation curve of VES S10.

Figure 4. Comparison of drill hole log of BAKOU and the computer interpretation curve of VES S16.
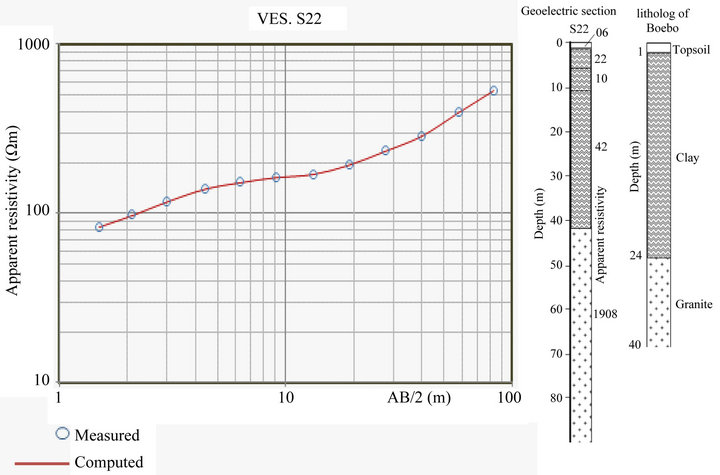
Figure 5. Comparison of drill hole log of BOEBO and the computer interpretation curve of VES S22.
The first geoelectric layer corresponds to the topsoil with apparent resistivity value ranging from 6 to 949 Ωm, while its thickness varies between 0.1 and 4.2 m. It reflects the variable composition and moisture content of the topsoil.
The second layer is made up of clay and laterite. The resistivity of clay overburden range from 9 to 880 Ωm with thickness range of 1.0 - 4.7 m while the laterite material has resistivity varying from 93 - 1862 Ωm and thickness ranging from 1.1 - 16.4 m.
The third and fourth geoelectrical layers represent an aquifer unit. The resistivity of the third layers which is weathered range from 23 to 351 Ωm indicative of clay with thickness ranging from 2.2 to 39.5 m, except beneath S4, S7, S8, S11, S13, S14 and S17. The inferred lithology of VES S4 and S13 is laterite with resistivity varying from 124 to 223 Ωm while thickness varies from 7.0 to 17.9 m. Stations S7, S8 and S11 indicates cracked granite with resistivity varying from 52 to 113 Ωm while thickness varies from 16.6 to 23.1 m. Inferred lithology of stations S14 and S17 is cracked Basalts with resistivity varying from 398 to 495 Ωm while thickness varies from
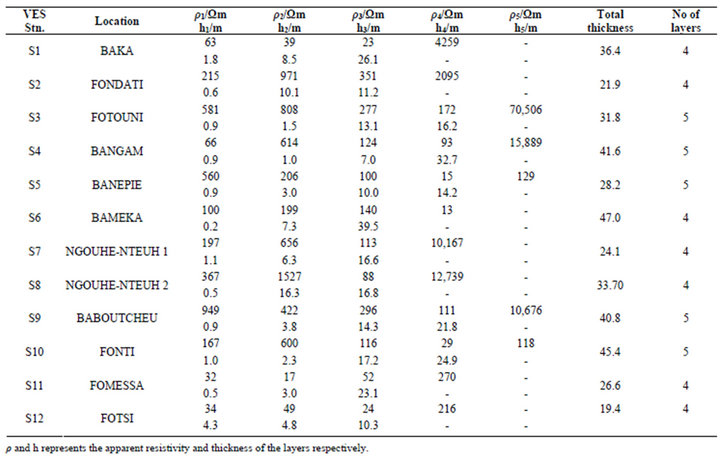
Table 1. Vertical electrical sounding data for stations S1 to S12.
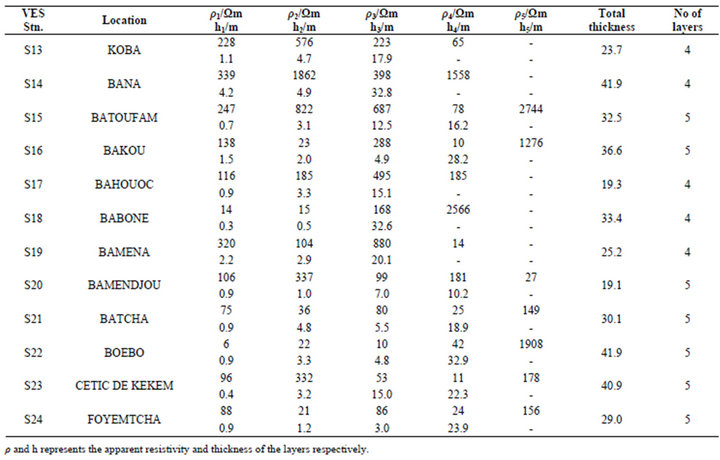
Table 2. Vertical electrical sounding data for stations S13 to S24.

Figure 6. Geoelectric section of the area, the numbers along the geoelectric section represent the resistivity in ohm-meter of each layer. (a) VES S1 to S12; (b) VES S13 to S24.
15.1 to 32.3 m.
The resistivity of the fourth layers which is weathered range from 11 to 42 Ωm indicative of clay with thickness ranging from 18.9 to 32.9 m except beneath S3 and S4 where the inferred lithology is cracked granite with resistivity varying from 93 to 172 Ωm and thickness from 16.2 to 32.7 m and S5, S9 and S10 and the inferred lithology is cracked basalts with resistivity varying from 15 to 111 Ωm while thickness varies from 14.2 to 19.2 m.
The fourth and fifth layers are made up of granite/basalts with resistivity values ranging from 10 to 70,506 Ωm. These layers were interpreted as bedrock. The resistivity values of stations S6, S13, S17, S19 and S20 ranging from 13 to 185 Ωm, with infinite thicknesses, because they form the last layer and could constitute a good confined aquifer.
Resistivity measurements separate the subsurface into different layers based on their resistivity values. Litholog data was obtained from borehole data from the study area. These litho-logs were compared with the geoelectric sections for areas close to borehole points. The correlation was based on the fact that a lithologic log differs from a geoelectric log when the boundaries of the litholog do not coincide with the boundaries of different resistivity.
4.2. Isoresistivity and Isopach Maps of the Aquifer
The isoresistivity map of the aquifers (Figure 7) in the study area indicates the presence of a low resistivity zone reflecting the direction of groundwater flow which is from northeast to southwest with the recharge area concentrated in the south. The results of the study show that the average depth of the aquifer is 32 m in the study area. The thickness of the overburden is an important hydrogeologic consideration in groundwater development in the basement terrain, because water gets into the saturated zone through the overburden [17].
The isopach map (Figure 8) produced from the VES results shows a variation in aquifer thickness from 10 to 34 m. The mean value of the aquifer's thickness is about 22 m. The maximum aquifer thickness is found beneath stations S4, S14, S18 and S22 and the minimum aquifer thickness is located for S2, S3, S4, S7, S8, S12, S15 and S21.
The weathered layer for the study area is thick enough to enable ground water accumulation. Stations S1, S4, S9, S10, S11, S14, S16, S18, S22, S23 and S24 show that, the area is suitable for groundwater exploitation because they exhibit weathered and fractured formations with high thickness. Station S2, S12, S17 and S20 are marked by a low groundwater yield due to the dip and the thickness of the weathered zone.
This area may have high expectations for prospecting bore-holes for potable water. An interpretation of VES curves corroborates the lithology of boreholes already drilled in the area.
5. Conclusions
This work has provided reliable information on the depth to the groundwater and thickness of the aquifer unit, which is going to be relevant for the development of an effective water supply scheme for the area under study.
The isoresistivity map indicates the presence of a low resistivity zone reflecting the direction of groundwater flow which is from northeast to southwest with the recharge area concentrated in the south of the study area. The groundwater occurs basically under unconfined condition at depths from about 19 m to about 47 m.
This study has revealed for this area, an average depth of the aquifer of 32 m with the average thickness of the
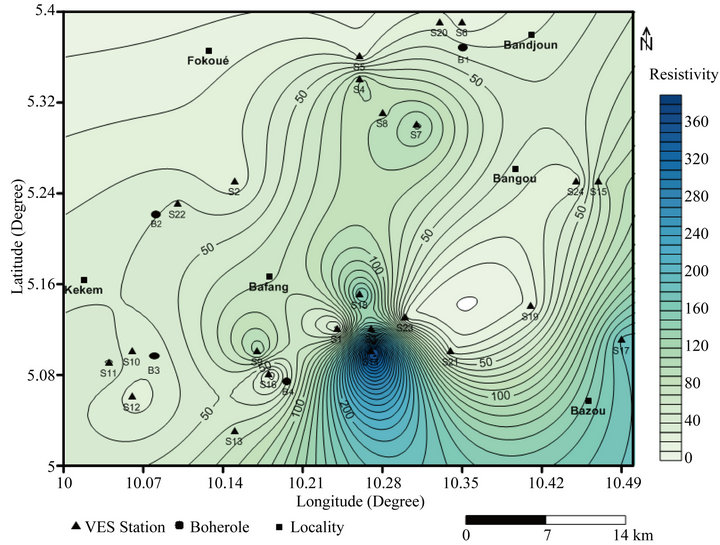
Figure 7. Isoresistivity map of the aquifer in the study area.
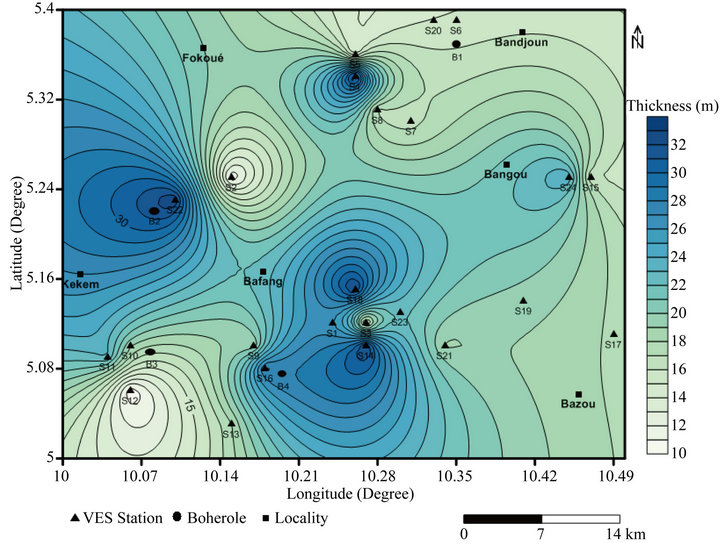
Figure 8. Isopach map of aquifer in the area.
aquifer being 22 m. The shallow aquifers which are generally unconfined may be vulnerable to contamination because of its thin overburden. The presence of clay lenses at different depths may form confining layers. The thickness and resistivity of the aquifers at these VES stations indicate a very good potential for groundwater. And therefore, the study area has a high potential for groundwater development.
The results of study include a detailed report describing the hydrogeologic system of the area and a comprehensive set of data. These products are intended to provide a more detailed understanding of the groundwater system and tools which can be used by regulators, senior water rights holders and other stakeholders, to make informed water management decisions and to help anticipate hydrogeologic effects from changes in study area.
6. Acknowledgements
The authors would like to express their heartfelt gratitude to the Ministry of Water Resources and Energy for their help in data acquisition; special thanks go to Doctors Tchouatcha Milan, Njingti Nfor and Tamfu Victor for their suggestions.
REFERENCES
- W. A. Teikeu, P. N. Njandjock, T. Ndougsa-Mbarga and T. C. Tabod, “Geoelectric Investigation for Groundwater Exploration in Yaounde Area, Cameroon,” Intemational Joumal of Geosciences, Vol. 3, No. 3, 2012, pp. 640-649. doi:10.4236/ijg.2012.33064
- J. Asfahani, “Geoelectrical Investigation for Characterizing the Hydrogeological Conditions in Semi-Arid Region in Khanasser Valley, Syria,” Journal of Arid and Environments, Vol. 68, No. 1, 2007, pp. 31-52. doi:10.1016/j.jaridenv.2006.03.028
- O. G. Omosuyi, A. Adeyemo and A. O. Adegoke, “Investigation of Groundwater Prospect Using Electromagnetic and Geoelectric Sounding at Afunbiowo, Near Akure, Southwestern Nigeria,” Pacific Journal of Science and Technology, Vol. 8, No. 2, 2007, pp. 172-182.
- O. E. Osagie, “Geoelectritric Groundwater Investigation, Southwestern Nigeria,” Journal of Environmental Hydrology, Vol. 18, No. 3, 2010, p. 3.
- L. J. Meli’I, P. N. Njandjock and D. H. Gouet, “Magnetotelluric Method for Groundwater Exploration in Crystalline Basement Complex, Cameroon,” Journal of Environmental Hydrology, Vol. 19, No. 16, 2011, p. 16.
- O. J. Oseji, E. A. Atakpo and E. C. Okolie, “Geoelectric Investigation of the Aquifer Characteristics and Groundwater Potential in Kwale, Delta State, Nigeria,” Journal of Applied Science and Environmental Management, Vol. 9, No. 1, 2005, pp. 157-160.
- N. N. Onu, “Estimates of the Relative Specific Yield of Aquifers from Geo-Electrical Sounding Data of the Coastal Plains of Southeastern Nigeria,” Journal of Technology and Education in Nigeria, Vol. 8, No. 1, 2003, pp. 69-83.
- C. J. Dumort, “Carte Géologique de Reconnaissance du Cameroun à L’échelle du 1/500,000, Coupure DoualaOuest Avec Notice Explicative,” Bulletin de la Direction de Géologie et des Mines, Cameroun, 1968, p. 69.
- G. Njiekak, W. Doir, J. P. Tchouankoué and G. Zulanf, “U-Pb Zircon and Microfabric Data of (Meta) Granitoids of Western Cameroun: Constraints of the Timing of Pluton Emplacement and Deformation in the Pan-African Belt of Central Africa,” Lihos, Vol. 102, No. 3-4, 2008, pp. 460-477.
- D. G. Kouankap Nono, “Etude du Cirsaillement Centre Camerounais Dans la Région de Banéfo-Mvoutsaha au N-E de Bafoussam, Dans le Domaine Centre de la Chaîne Panafricaine Nord Equatoriale: Pétrogenèse, Géochronologie et Structurologie des Formations du Socle,” Ph.D. Thèse de Doctorat, Université de Yaoundé 1, Yaoundé, 2011.
- C. Chebeu, C. D. N. Nlend, J. P. Nzenti and S. Ganno, “Neoproterozoic High-K Calc-Alcaline Granitoids from Bapa-Batié, North Equatorial Fold Belt, Central Cameroon: Petrogenesis and Geodynamic Significance,” The Open Geology Journal, Vol. 5, 2011, pp. 1-20.
- D. Tchaptchet Tchato, “Geology of the Kekem Area (Cameroun Central Domain): Metamorphic Petrology, P-T-t Path, EMP, LA-ICPMS Dating and Implications for the Geodynamic Evolution of the Pan-African North Equatorial Folt Belt,” Ph.D. Thèse de Doctorat, Université de Yaoundé 1, Yaoundé, 2012.
- M. F. Tchoua, “Contribution à L’Etude Géologique et Pé- trologique que Quelques Volcans de la ‘Ligne du Cameroun’ (Monts Manengouba et Bamboutos),” Thèse d’Etat, Université Clermont-Ferrand, Clermont-Ferrand, 1974.
- P. Kamgang, “Contribution à L’Etude Géochimique et Petrologique du Massif de Nko-Gam (Pays Bamoun), Ouest Cameroun,” Thèse 3ème Cycle, Université de Yaoundé, Yaoundé, 1986.
- P. Wandji, J. J. Menard and M. F. Tchoua, “L’activité Hydromagmatique Récente Dans la Plaine du Noun (Ouest Cameroun) et Les Aléas Volcaniques Associés,” Compte Rendu de L’académie des Sciences, Vol. 319, No. 2, 1994, pp. 417-422.
- H. Pfannkuch, “On the Correlation of Electrical Conductivity Properties of Porous Systems with Viscous Flow Transport Coefficients,” Developments in Soil Science, Vol. 2, 1972, pp. 42-54. doi:10.1016/S0166-2481(08)70527-0
- A. Takounjou-Fouépé, V. V. S. R. Gurunadha, J. N. Ndam, L. N. Sigha and G. E. Ekodeck, “Groundwater Flow Modeling in the Upper Anga’a River Watershed, Yaounde, Cameroun,” African Journal of Environmental Science and Technology, Vol. 3, No. 10, 2009, pp. 341-352.
NOTES
*Corresponding author.