Journal of Water Resource and Protection
Vol.3 No.12(2011), Article ID:16403,6 pages DOI:10.4236/jwarp.2011.312101
Performance of Nanofiltration (NF) and Low Pressure Reverse Osmosis (LPRO) Membranes in the Removal of Fluorine and Salinity from Brackish Drinking Water
1Department of Science and Technology, University of Ziguinchor, Ziguinchor, Senegal
2University of Cheikh Anta, Dakar, Senegal
3PALL Corporation, Saint Germain en Laye, France
4European Institute of Membrane, Montpellier, France
E-mail: *ckdiawara@univ-zig.sn
Received September 25, 2011; revised October 27, 2011; accepted November 29, 2011
Keywords: Desalination and Brackish Water, Fluorine, Nanofiltration, Reverse Osmosis
ABSTRACT
Certain areas in Senegal have a serious problem of high fluoride and salinity in underground water because of soil properties. This water currently used for drink has a bad taste on consumption and caused diseases like dental fluorosis and skeletal fluorosis. A membrane filtration plant constructed by Pall Corporation was improved through nanofiltration (NF) and Low Pressure Reverse Osmosis (LPRO). Both NF and LPRO membranes were shown applicable for salinity and fluoride ions removal from brackish and high fluorinated drinking water in a remote community. The NF membrane has given a fluorine retention rate varying between 63.3% and 71% while the LPRO membrane allow to reach 97% to 98.9% for fluorine rejection. Highest salinity rejection rates expressed through conductivity measurements are around 46% and 97% for respectively NF and LPRO.
1. Introduction
Water scarcity is a major problem in several parts of the world namely, in the Middle East, in South Europe, and Africa [1]. Besides, there are also some countries which despite abundant available resources, present bitter and salty water or water contaminated by high level of chemicals elements such as nitrate, aluminum, fluorine [2-6]. The occurrence of high concentration of fluorine in water which is encountered in several countries of the World has been reported by several authors [2,6-8]. In Senegal, the presence of high levels of fluorine (4 mg/L) in drinking water is concomitant to a high level of salinity (generally above 3500 mg/L) so much so that it provokes dental and/or skeletal fluorosis [5]. Aware of the problems of public health linked to the excess of fluorine in drinking water, treatment solutions were studied in order to reduce fluorine as well as salinity to levels recommended by the World Health Organization (WHO). Classical procedures charcoals and clays are known for being efficient in fluoride removal but without effect on salinity. Clay is an absorbant capable of fixing fluorine ions. Its performance is highly dependent on its specific area, the physical and chemical quality of the water to be treated and the geometry of the filtration module. None of the two known solutions takes into account of the desalination which treatment would be determinant in the acceptability of the proposed solution to the local populations. Membrane separation procedures based on pressure driving force such as nanofiltration (NF) and reverse osmosis (RO) have been recognized as efficient treatment methods for the production of drinking water [9]. Yet, the performance of these separation techniques is linked to the intrinsic properties of the membranes [10] and the choice of the best membrane which depends on the quality of water to be treated and operational conditions [4,6].
The aim of this work, realized with a little pilot plant, is to show the performance of two commercial membranes called NF and LPRO both from Dow Chemical. These two membranes respectively enabled to assess by NF and through LPRO their ability to reduce the excess of fluorine for the 2000 inhabitants of the rural community of Ndiaffate (Kaolack, Senegal).
Rejection rates in fluorine and conductivity of the two membranes have been monitored during 300 hours to a constant permeate flow and constant recovery rate. The monitoring of the permeability of membranes versus time show a decrease tendency, which led to a chemical cleaning of the membranes in order to verify if their initial permeability can be restored.
2. Materials and Methods
The pilot plant used on site is shown on the scheme of the Figure 1 below. The module of the pilot unit is composed of 169 circular flat membranes which are interrelated between 170 discs which ensure dynamic resistance of the system. The total membrane area in the module is 7.605 m2.
The functioning of the unit is ensured by making the feed water to pass through the module at a temperature about 303 K and by fixing the conversion rate at 66%; which corresponds to a feed flow of 900 l/h (F1) and a concentrate flow of de 300 l/h (F2). Manometers set in the feed (P1) and at the exit of the concentrate (P2) enable to make the pressures change in time in order to maintain constant the conversion rate. pH is equal to 8 during experimentation. Samples are taken through intervals of regular time in the feed (ef) as well as in the permeate (ep) and the concentrate (ec).
For each sampling, fluorine measurements are made by an ion meter pH/Ion 340i combined with a specific electrode in fluorine designated F800; in order to avoid any ionic influence during each fluorine measure, a total ionic strength adjustment buffer (TISAB) was used. The conductivity of solutions is measured with a HI8733 (Hanna Instruments). The electric supply for the functioning of the unit is ensured by a generator. The NF, which is a polyamide membrane based, is characterized by
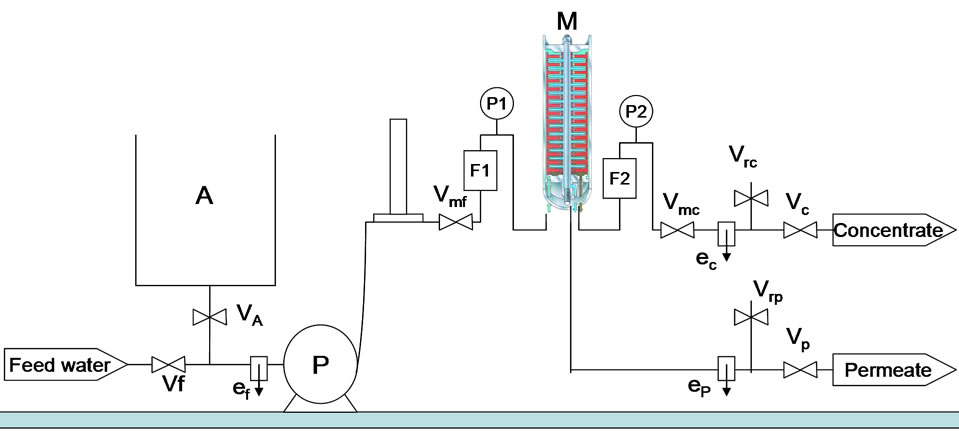
Figure 1. Pilot scheme.
ef, ep, ec: sampling valves in the feed, permeate and concentrate respectively; F1, F2: flow meters in the feed and concentrate respectively; P1, P2: pressure gauges in the feed and concentrate respectively; M: module; P: pump; Vi/Vmi: valves (f: feed; A: tank; p: permeate; c: concentrate; m: modulable).
good water permeability [9,11-14] and sometimes with a very high rejection rate for some applications [7,15,16] whereas the LPRO, which is also a polyamide membrane based, has a relatively low permeability with very high rejection rates [7,17]. Permeability values of membrane in m/h/bar are calculated from the flow of permeates taken by membrane area unit and by pressure unit applied.
The results of fluorine analysis and conductivity enabled us to plot the evolution of the rejection rate (R %) according to the time. The calculated evolution curve of permeability according from each sampling is normalized at 303 K for each of the membranes, was analyzed on the dirtying state of the membranes. Rejection and conversion rates are respectively expressed through the following Equations (1) and (2):
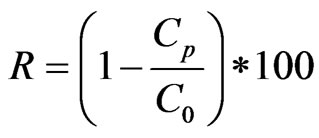 (1)
(1)
C0: concentration in the feed; Cp: concentration in the permeate.
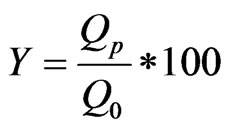 (2)
(2)
Q0: feed flow; Qp: permeate flow.
3. Results and Discussion
In the following paragraphs values measured in this study are presented in percentage form which enables discussion through the angle of membrane efficiency. The results of each of the membranes are analyzed according to the values known in the literature and then compared with one another.
3.1. Fluoride Retention Rate
For the NF membrane, the rejection rate in fluorine is 71% in the beginning of the filtering; that rejection rate is similar to the one related by Kettunen and Keskitalo [2]. We can notice that the NF membrane rejection rate in fluorine decreases afterwards progressively from 69.3% to 63.3% during the 250 filtering hours of the pilot. This phenomenon can be explained by the fact that the new NF, in addition to its rejection capacity, absorbs fluorides ions in the beginning of functioning. This absorption vanishes progressively during the first ten functioning hours. Beyond that, the retention rate in fluorine is only explained by the membrane’s capacity to reject without any absorption phenomenon.
The above noted phenomenon with the nanofiltering membrane is different from what is noticed in the case of a reverse osmosis membrane which is denser and of which predominating transfer mechanism remains the solubilization-diffusion. The LPRO membrane has a rejection rate in fluorine of 97% in the beginning of the filtering experiments, and then it becomes stable around 98.1% for all along the filtering time. Sehn [7] has also found out a rejection rate of 98.4% but with an initial concentration solution in fluorine which is equal to 1.9 mg/L (Table 1).
More than 63% of fluorine was removed with the nanofiltration membrane, while an average of 98% was removed by the low pressure reverse osmosis one.
3.2. Desalination with Conductivity Measurements
The NF membrane rejection rate in salinity is 45.89% in the beginning of experiments but decreases progressively through time. That drop becomes relatively weak beyond 130 functioning hours so as to stay at a reduction rate of about 40% until 250 functioning hours of the pilot (Figure 2). These rejection rate values are similar to those given by Nghiem and Hawkes [9]. Besides, Al-Zoubi and Omar [14] have found out rejection rates of 21.8% and 13.8% in Na+ and Cl– respectively and of 91.8% in  by using the NF as pretreatment method while desalinateing.
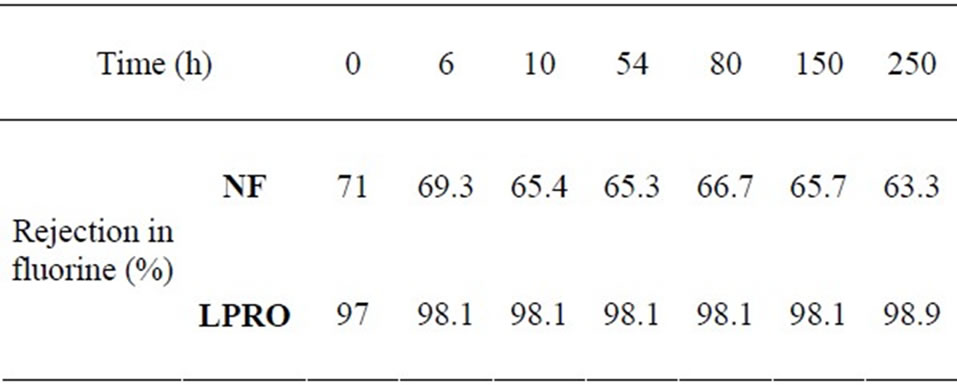
Table 1. rejection rates in fluorine of the NF and LPRO membranes.
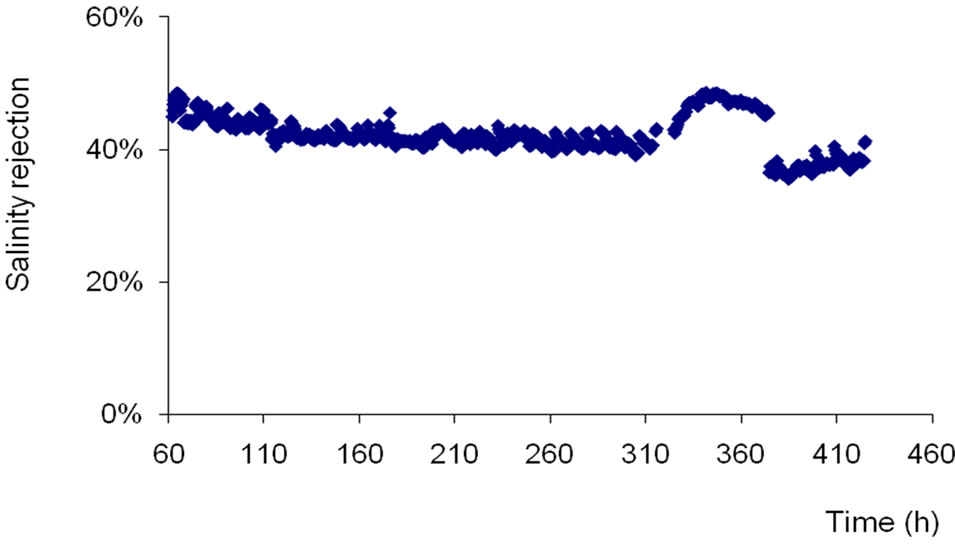
Figure 2. Salinity rejection rate of NF versus time at both constant permeate flow and conversion rate (Qp = 10 l/mn; Y = 66%).
The results of rejection rate drop in salinity show the NF limits in reducing salinity of drinking water on site according to WHO recommendation (1000 mg/L). This aspect takes on a character all the more important that the salinity has a direct influence on the taste of the water. In fact, Hilal et al. [12] have shown that the NF membrane have moderate retention rates of 11% - 29% for a salinity which varies between 5000 and 25000 mg/L for the salts because of large pores diameters. Therefore, we can explain the rejection rate of about 46% obtained in our study for a salinity of 1750 mg/L because the rejecttion rate decreases while concentration increases.
The decrease of salinity rejection to values of 35% observed between 370 and 400 hours correspond to the increase of the recovery rate from 66% to 80%. It’s noteworthy that the increase of the recovery rate leads to a decrease of the rejection rate and a more fouling tendency of membranes. The same effect was observed with low pressure reverse osmosis membrane (Figure 3). In fact, the salinity rejection of LPRO membrane decreases from 97% to 95% when the recovery rate was increased from 66% to 80%.
In order to keep the constant permeate flow at 10 l/mn, the feed pressure applied has gone up from 7.9 bar to 8.9 bar after 228 functioning hours. Thus, at 250 hours, a cleaning has been realized to check the possibility to find again the initial performances.
Unlike the membrane that was previously tested, the LPRO as a low pressure reverse osmosis membrane enables to observe (Figure 3) during the first 200 functioning hours an increase of the conductivity rejection rate according to time between 93.5% to 97% before becoming constant during the next 100 hours. This high reducetion rate in salinity confirms the membrane denseness and allows the production of water with very weak saline content (47.78 mg/L) at the risk of being enough poor for a drinking water. Other authors have talked about these high values of the LPRO membrane rejection rate [7, 17].
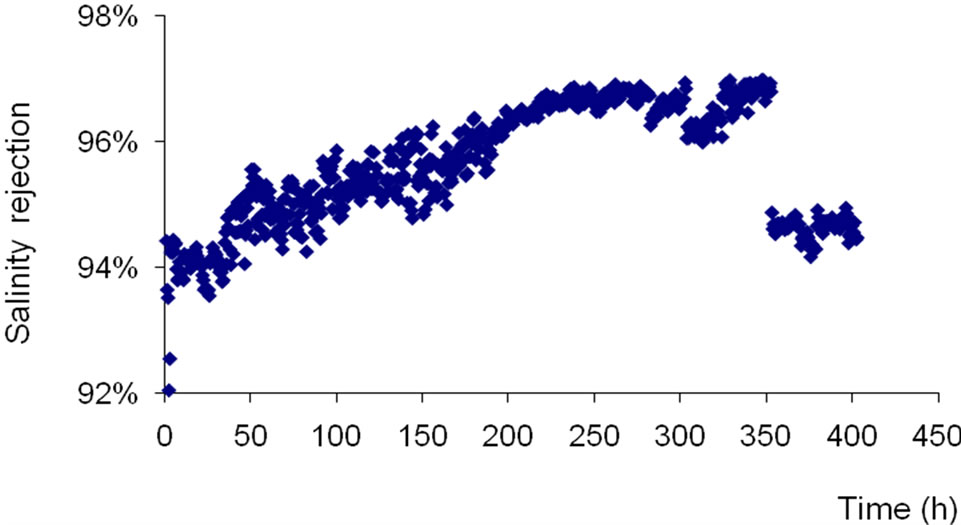
Figure 3. Conductivity rejection rate of LPRO versus time at both constant permeate flow and conversion rate (Qp = 10 l/mn; Y = 66%).
The upshot of this brackish water treatment on site in a remote village in Senegal is that the low pressure reverse osmosis membrane eliminates almost the whole of salts to the extent of thinking about a re-mineralization in order to obtain a drinkable water, whereas the NF270 membrane, basing on its results, shows that it is permeable enough to ensure a reduction in conductivity, thus in salinity of the groundnuts basin water of Senegal dedicated to consumption. Thus, the unequivocal result is that the densest nanofiltering membranes like NF90 which are the most akin to the reverse osmosis type, of which mechanism of solubilization-diffusion transfer seems to prevail over the convection, will fit much better for the treatment of those consumption waters.
3.3. Permeability Evolution
The Figure 4 shows the permeability evolution of NF membrane according to time.
The NF membrane permeability is 0.0147 m/h/bar during the first 50 functioning hours. The permeability gets lower and lower between 50 and 200 functioning hours, varying from 0.0147 to 0.0124 m/h/bar then remains almost constant between 200 and 250 hours.
After chemical cleaning realized around 300 functioning hours, membranes permeability gets at 0.0156 m/h/ bar, which is akin to those of new membranes (0.016 m/h/bar). The comparable value of permeability obtained after chemical with the virgin one shows that the NF membranes can be used for other filtrations. The NF membrane permeability is relatively high [10-12] compared to the LPRO one.
The LPRO membrane permeability varies from 0.0080 to 0.0068 m/h/bar between 0 and 100 functioning hours. It decreases progressively between 100 and 300 of cumulative functioning hours from 0.0067 to 0.0057 m/h/ bar.
The LPRO permeability decreases with time can be explained by a fouling tendency of membranes due to deposits of organics and minerals compounds at the top of the surface layer (Figure 5).
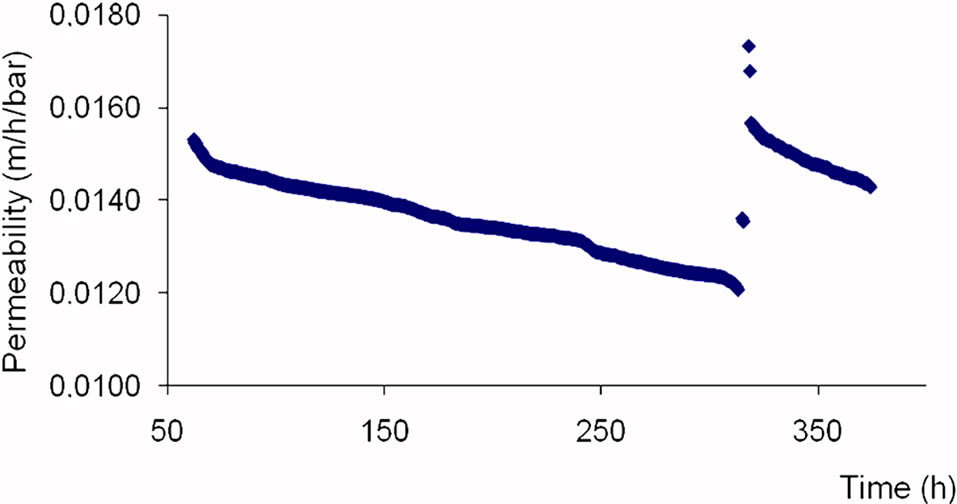
Figure 4. Permeability of NF membrane versus time.
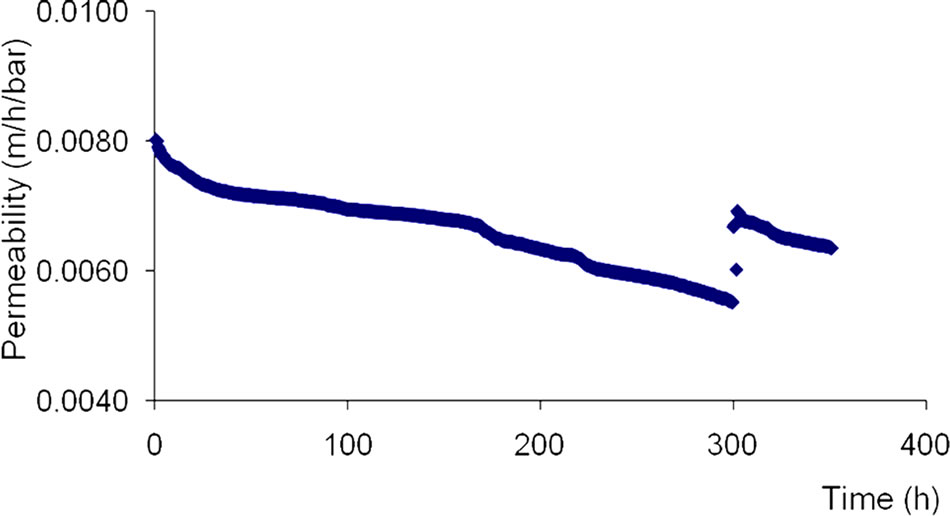
Figure 5. Permeability of LPRO membrane versus time.
After chemical cleaning realized around 300 functioning hours, the permeability of LPRO membrane increases progressively and reaches the value of 0.074 m/h/bar during the two functioning hours following the membranes’ cleaning.
3.4. Cleaning Efficiency
After chemical cleaning of NF membrane, the rejection rate in salinity is at 34.89% within the first functioning hours which follows the cleaning. But that rejection rate increases progressively at first until it reaches the value of 45.45% which is close to the membrane’s initial rejecttion (45.89%), then it remains constant for a while before taking up a progressive falling tendency according to time. The increment of the rejection rate observed right after the cleaning corresponds perfectly to manufacturer’s expectation (Dow Chemical) because an alkali cleaning with a pH superior to 9 for a NF membrane made of polyamide causes a swelling of the membrane. This leads then to a permeability increment and a rejection rate reduction; what Nilsson et al. [18] have found on different types of polyamide membranes. That effect has disappeared after 20 hours in normal functioning.
Those different phenomena are visible on the permeability evolution curve (Figure 4) of the NF membrane which goes from 0.0150 m/h/bar in the beginning of filtering to 0.0126 m/h/bar after 250 before cleaning, and stabilizes at 0.0147 m/h/bar during 20 additional functioning hours after cleaning. The recovered permeability after chemical cleaning is around 98% for the NF membrane. This confirms the effectiveness of the adopted cleaning system and the fact that NF is at the very edge of salt reduction of Senegal brackish waters especially where the resource is often subject to concentration variations due partly to a half-dry, sudano-sahelian weather.
As for the NF membrane, after chemical cleaning of LPRO membrane, the rejection rate in salinity is about 96% within the first functioning hours which follows the cleaning. But that rejection rate increases progressively and reaches the value of 97% after 50 functioning hours. The same phenomena observed for NF are noticed for LPRO membrane because these membranes are both polyamide based on their active layer.
The recovered permeability after chemical cleaning of low pressure reverse osmosis membrane is around 86%.
4. Conclusions
From this work it appears that it is possible, through membranes technologies, to treat in a single operation the fluorine and salinity excess in order to supply the population’s good quality drinking water. Both nanofiltration and low pressure reverse osmosis are efficient for removal of fluorine and salinity from high fluorine brackish underground water.
By comparing the rejection rates of fluorine and salinity and permeability of membranes, the results of this work demonstrated that the NF membranes are more adapted than the LPRO ones for the treatment of drinking water with concentrations slightly above recommendations in both fluorine and salinity.
On the other hand, the LPRO which requires a higher functioning pressure with a relatively lower permeability allows to achieving very high rejection rates. Thus, the LPRO membrane appears to be more effective than the NF when the water to be treated has concentrations in fluorine and salt which are far beyond WHO recommendations.
This study was the first one carried out in a remote village in Senegal and will be applied further with a bigger plant integrating photovoltaic cells in order to save energy consumption and therefore lowering costs of produced water. This can leads to a better access to safe drinking water for rural populations living in the groundnut basin of Senegal.
5. Acknowledgements
Authors are very indebted to the ministry of scientific research in Senegal (“FIRST” project), to Professor L. COT of “chair UNESCO-SIMEV” and the “frères carmes” community in Kaolack for financial and logistical support.
REFERENCES
- A. Al-Amoudi and R. W. Lovitt, “Fouling Strategies and the Cleaning System of NF Membranes and Factors Affecting Cleaning Efficiency,” Journal of Membrane Science, Vol. 303, No. 1-2, 2007, pp. 4-28. doi:10.1016/j.memsci.2007.06.002
- R. Kettunen and P. Keskitalo, “Combination of Membrane Technology and Limestone Filtration to Control Drinking Water Quality,” Desalination, Vol. 131, No. 1-3, 2000, pp. 271-283. doi:10.1016/S0011-9164(00)90025-0
- L. Paugam, S. Taha, J. Cabon and G. Do, “Elimination of Nitrate Ions in Drinking Waters by Nanofiltration,” Desalination, Vol. 152, No. 1-3, 2002, pp. 271-274. doi:10.1016/S0011-9164(02)01073-1
- A. Santafe-Moros, J. M. Gozalvez-Zafrilla and J. Lora-Garcıa, “Performance of Commercial Nanofiltration Membranes in the Removal of Nitrate Ions,” Desalination, Vol. 185, No. 1-3, 2005, pp. 281-287. doi:10.1016/j.desal.2005.02.080
- M. Pontié, C. K. Diawara, A. Lhassani, H. Dach, M. Rumeau, H. Buisson and J. C. Schrotter, “Water Defluoridation Processes a Review. Apllication: Nanofiltration (NF) for Future Large-Scale Pilot Plants,” Fluorine and the Environment, Vol. 2, 2006, pp. 50-80.
- C. K. Diawara, “Nanofiltration Process Efficiency in Water Desalination,” Separation & Purification Reviews, Vol. 37, No. 3, 2008, pp. 303-325. doi:10.1080/15422110802228770
- P. Sehn, “Fluoride Removal with Extra Low Energy Reverse Osmosis Membranes: Three Years of Large Scale Field Experience in Finland,” Desalination, Vol. 223, No. 1-3, 2008, pp. 73-84. doi:10.1016/j.desal.2007.02.077
- L. H. MacDonald, G. Pathak, B. Singer and P. R. Jaffé, “An Integrated Approach to Address Endemic Fluorosis in Jharkhand, India,” Journal of Water Resource and Protection, Vol. 3, No. 7, 2011, pp. 457-472. doi:10.4236/jwarp.2011.37056
- L. D. Nghiem and S. Hawkes, “Effects of Membrane Fouling on the Nanofiltration of Trace Organic Contaminants,” Desalination, Vol. 236, No. 1-3, 2009, pp. 273-281. doi:10.1016/j.desal.2007.10.077
- S. N. Diop, M. A. Diallo, C. K. Diawara and D. Cot, “Intrinsic Properties and Performances of NF270 and XLE Membranes for Water Filtration,” Water Science & Technology: Water Supply, Vol. 11, No. 2, 2011, pp. 186-193. doi:10.2166/ws.2011.024
- M. Mänttäri, A. Pihlajamtiki and M. Nyström, “Comparison of Nanofiltration and Tight Ultrafiltration Membranes in the Filtration of Paper Mill Process Water,” Desalination, Vol. 149, No. 1-3, 2002, pp. 131-l36. doi:10.1016/S0011-9164(02)00744-0
- N. Hilal, H. Al-Zoubi, A. W. Mohammad and N. A. Darwish, “Nanofiltration of Highly Concentrated Salt Solutions up to Seawater Salinity,” Desalination, Vol. 184, No. 1-3, 2005, pp. 315-326. doi:10.1016/j.desal.2005.02.062
- R. Liikanen, H. Kiuru, J. Peuravuori and M. Nyström, “Nanofiltration Flux, Fouling and Retention in Filtering Dilute Model Waters,” Desalination, Vol. 175, No. 1, 2005, pp. 97-109. doi:10.1016/j.desal.2004.08.043
- H. Al-Zoubi and W. Omar, “Rejection of Salt Mixtures from High Saline by Nanofiltration Membranes,” Korean Journal of Chemical Engineer, Vol. 26, No. 3, 2009, pp. 799-805. doi:10.1007/s11814-009-0133-7
- M. Mänttäri, T. Pekuri and M. Nyström, “NF270, a New Membrane Having Promising Characteristics and Being Suitable for Treatment of Dilute Effluents from the Paper Industry,” Journal of Membrane Science, Vol. 242, No. 1-2, 2004, pp. 107-116. doi:10.1016/j.memsci.2003.08.032
- A. Caus, S. Vanderhaegen, L. Braekena and B. Van der Bruggen, “Integrated Nanofiltration Cascades with Low Salt Rejection for Complete Removal of Pesticides in Drinking Water Production,” Desalination, Vol. 241, No. 1-3, 2009, pp. 111-117. doi:10.1016/j.desal.2008.01.061
- E. M. V. Wagner, A. C. Sagle, M. M. Sharma and B. D. Freeman, “Effect of Crossflow Testing Conditions, Including Feed Ph and Continuous Feed Filtration, on Commercial Reverse Osmosis Membrane Performance,” Journal of Membrane Science, Vol. 345, No. 1-2, 2009, pp. 97-109. doi:10.1016/j.memsci.2009.08.033
- M. Nilsson, G. Tragardh and K. Östergren, “Influence of Temperature and Cleaning on Aromatic and Semi-Aromatic Polyamide Thin-Film Composite NF and RO Membranes,” Separation and Purification Technology, Vol. 62, No. 3, 2008, pp. 717-726. doi:10.1016/j.seppur.2008.03.014