Journal of Water Resource and Protection
Vol. 3 No. 8 (2011) , Article ID: 6986 , 9 pages DOI:10.4236/jwarp.2011.38073
Microbial Removal of Phenol and p-Chlorophenol from Industrial Waste Water Using Rhodococcus sp.RSP8 and Its Growth Kinetic Modeling
Department of Chemical Engineering, University of Calcutta, Kolkata, India
E-mail: pronoy_sinha@yahoo.co.in
Received March 4, 2011; revised May 7, 2011; accepted July 9, 2011
Keywords: Rhodococcus sp.RSP8, Biodegradation, Phenol, p-Chlorophenol, Inhibition, Kinetics
ABSTRACT
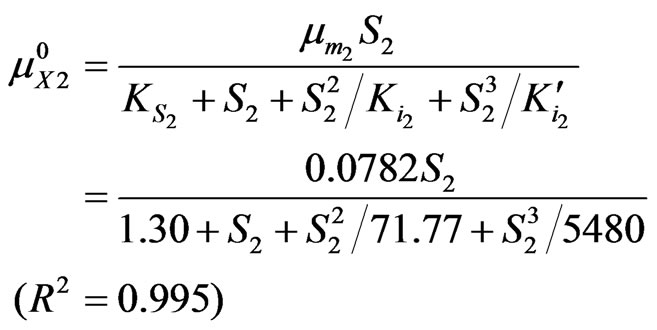
A phenol-degrading microorganism, Rhodococcus sp.RSP8, was used to study the substrate interactions during cell growth on phenol and p-chlorophenol dual substrates. Both phenol and p-chlorophenol could be utilized by the bacteria as the sole carbon and energy sources. When cells grew on the mixture of phenol and p-chlorophenol, strong substrate interactions were observed. The p-chlorophenol inhibited the degradation of phenol, on the other hand, phenol also inhibited the utilization of p-chlorophenol. The overall cell growth rate depends on the co-actions of phenol and p-chlorophenol. In addition, the cell growth and substrate degradation kinetics of phenol, p-chlorophenol as single and mixed substrates for Rhodococcus sp.RSP8 in batch cultures were also investigated over a wide range of initial phenol concentrations (5 - 1600 mg·L–1) and initial p-chlorophenol concentrations (5 - 250 mg·L–1). The single-substrate kinetics was described well using the Haldane-type kinetic models, with model constants of µm1 = 0.15 h–1, KS1 = 2.22 mg·L–1 and Ki1 = 245.37 mg·L–1 for cell growth on phenol and of µm2 = 0.0782 h–1, KS2 = 1.30 mg·L–1 and Ki2 = 71.77 mg·L–1, K′i2 = 5480 (mg·L–1)2 for cell growth on p-chlorophenol. Proposed cell growth kinetic model was used to characterize the substrates interactions in the dual substrates system.
1. Introduction
Due to the toxicity of both phenol and p-chlorophenol, efficiently removing of these compounds by microorganisms is of great importance. Phenol is a characteristic pollutant in wastewaters and effluents from crude oil and coal conversion processes. To treat phenolic compounds, biological methods are preferable because this is economical, and there is a low possibility of the production of by products. The biodegradation of phenol have been widely examined in the past three decades and different microorganisms were used by different researchers in this kind of study [1-4]. Several other studies have shown that p-chlorophenols can be degraded by a wide variety of microorganisms [5-7]. The microorganisms used are usually aerobes because the aerobes are efficient at degrading toxic compounds and usually transform the organic compounds into inorganic compounds (CO2, H2O). As phenol and p-chlorophenol are most important components in phenolic wastewater; recently, the inhibitions of pchlorophenol on aerobic biodegradation of phenol have been investigated. It was observed that phenol and pchlorophenol mutually inhibited each other; the inhibition of p-chlorophenol to phenol degradation was stronger than reverse, but o-p-chlorophenol enhanced phenol degradation marginally. Knowledge of the kinetics of biodegradation is important for the evaluation of the persistence of organic pollutant and the design of biodegradation facilities [8]. Therefore, further detailed research is needed to quantify these substrate interactions in the degradation of phenol and p-chlorophenol mixtures. The aim of our present work is to investigate and quantify the kinetics of cell growth and biodegradation of phenol and p-chlorophenol as the single and mixed substrates using Rhodococcus sp.RSP8.
2. Kinetics Models
The Rhodococcus sp.RSP8 growth rate and substrate degradation rate were only limited by substrate concentration at fixed initial pH, temperature and shaking rate. To develop the cell growth kinetics model in binary substrates system, our strategy is first to specify the cell growth model for cells acting on phenol and p-chlorophenol alone, and then to quantify the substrates interactions. In our work, as the flasks were covered with cotton plugging, it was presumed that the aeration provided by shaking the flasks was sufficient to keep the oxygen concentration constant and not limited, the influence of oxygen was not considered. Because of the inhibition of high phenol or p-chlorophenol concentration on the cell growth, the Haldane type kinetic models [9] were selected for assessing the dynamic behavior of Rhodococcus sp.RSP8 growth on phenol or p-chlorophenol alone.
2.1. Cell Growth on Phenol and p-Chlorophenol
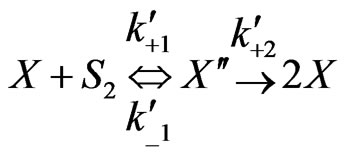
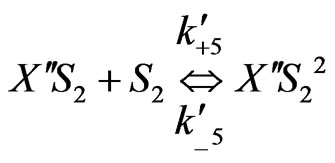
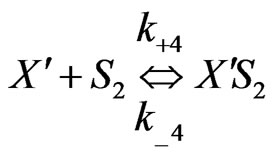
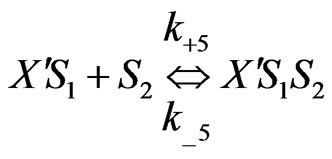
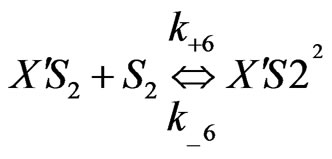
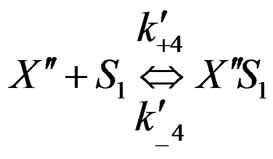
On the basis of the experimental results when both the substrates exerted substrate-inhibition on the cells (considering that the inhibitory effects of p-chlorophenol on the cell growth behaviors are larger than those of phenol), the following sequences of reactions based on enzymatic reactions are proposed:
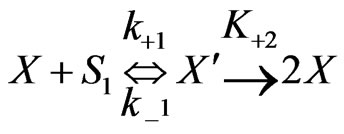 (1)
(1)
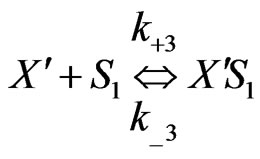 (2)
(2)
 (3)
(3)
 (4)
(4)
 (5)
(5)
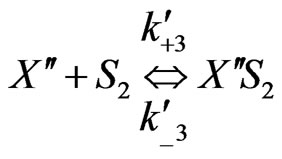
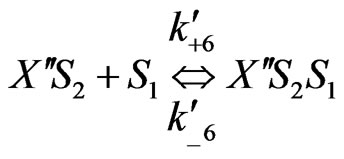
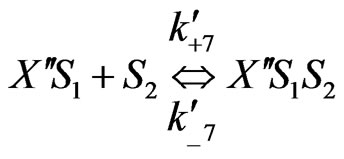
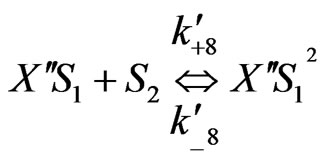
Similarly when cross-inhibition occurred between phenol and p-chlorophenol, the following set of reactions can be proposed;
 (6)
(6)
 (7)
(7)
 (8)
(8)
 (9)
(9)
 (10)
(10)
 (11)
(11)
 (12)
(12)
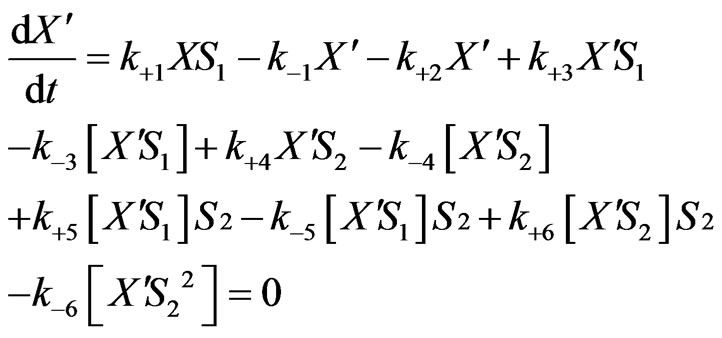
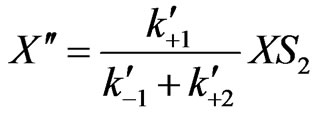
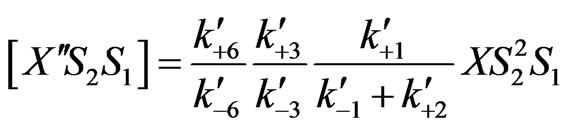
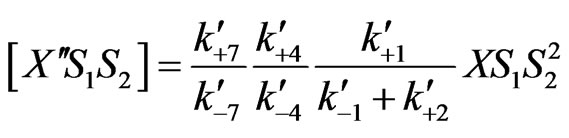
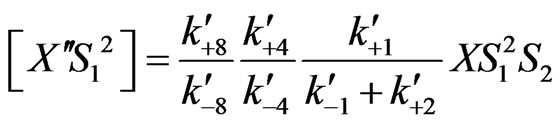
By considering the above mechanism and assuming pseudo-steady state for formation of the cellular intermediates, the cell growth equation, for the mixed two growth substrates (phenol and p-chlorophenol) can be obtained. Cellular intermediates in this mechanism are
 .
.
From Equations (1)-(2), (6)-(8),
 (13)
(13)
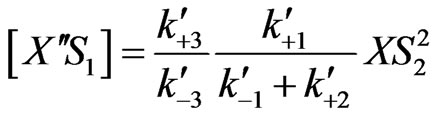
Equations (2), (6), (7) and (8) will provide
 (14)
(14)
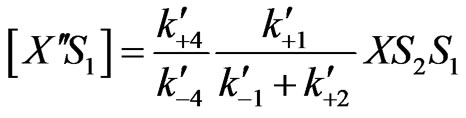
 (15)
(15)
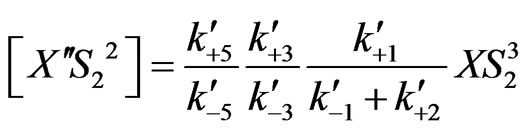
 (16)
(16)
 (17)
(17)
By solving Equations (13)-(17) and (18)-(22) can be obtained:
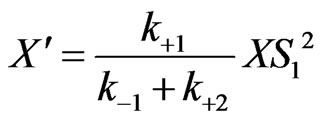 (18)
(18)
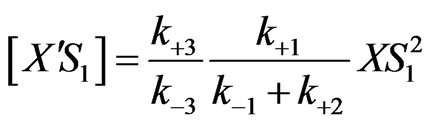 (19)
(19)
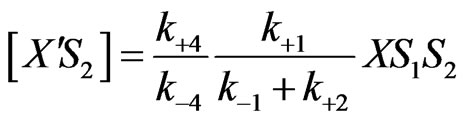 (20)
(20)
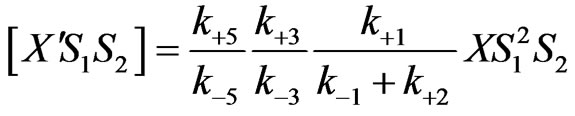 (21)
(21)
 (22)
(22)
Similarly, we can also obtain from Equations (3)-(5) to (9)-(12)
 (23)
(23)
 (24)
(24)
 (25)
(25)
 (26)
(26)
 (27)
(27)
 (28)
(28)
 (29)
(29)
Therefore, the total cell mass can be represented as follows:
 (30)
(30) Here
The specified growth rate is modified as
 (31)
(31)
and
 (32)
(32)
 (33)
(33)
 (34)
(34)
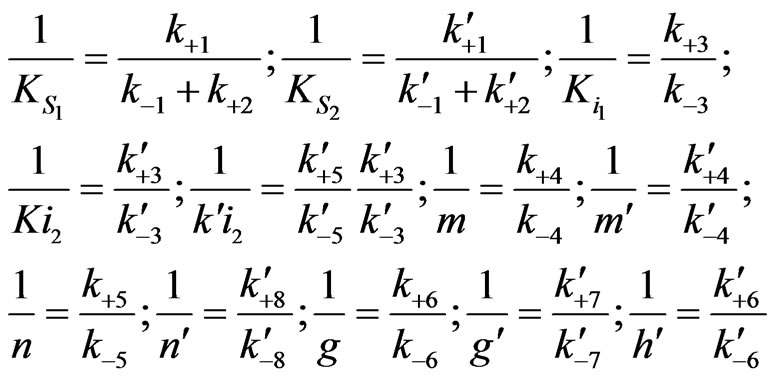
where
 ,
,
 ,
,
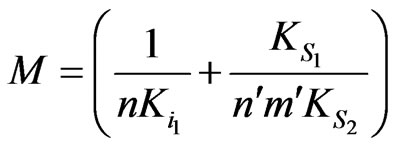 ,
,
Similarly
 (35)
(35)
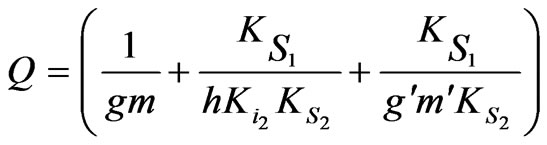
where

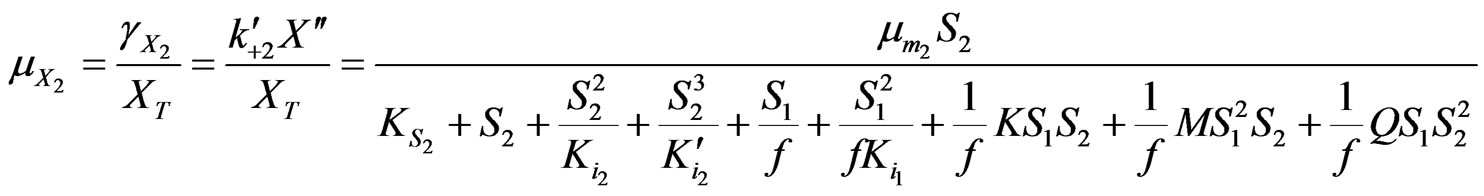
Based on Equations (34) and (35) above, the specific growth rate can be obtained as
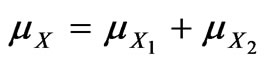 (36)
(36)
Although  is derived as the ratio of
  and
and , it should be determined as an independent parameter from fitting experimental data due to the complexity of the system [10].
 and
and  can be obtained separately from the kinetics of individual cell growth on phenol alone or p-chlorophenol alone, respectively.
2.2. Substrates Degradation Kinetics Model
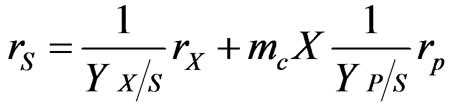
Analyzing the utilization of the substrate in cells in more detail, the consumption of substrate for cell growth and for the maintenance and also, for product formation if possible has to be considered [11]. The substrate consumption rate of substrate biodegradation is
 (37)
(37)
where 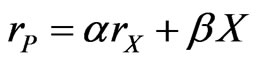 is the product formation rate and because
  are all constants, Equation
(37) can be reduced to
 (38)
(38)
or
 (39)
(39)
where  and
and  are all kinetic constants and they were regressed using Matlab based on the experimental data. Thus, the specific degradation rates of phenol and p-chlorophenol in dual substrates system can be repre sented as follows:
 (40)
(40)
 (41)
(41)
3. Materials and Methods
3.1. Microorganism and Culture Conditions
Rhodococcus sp.RSP8 was isolated from an industrial coal wastewater treatment plant and identified based on the physiological and biochemical tests and 16SrDNA. Stock culture of this strain was maintained by periodic sub-culturing on nutrient agar slants and stored at 4˚C. Pure culture of this microorganism was used throughout our work.The liquid mineral salt medium (MSM) used in this study has a composition as follows (gL–1): 0.4 K2HPO4, 0.2 KH2PO4, 0.1 NaCl, 0.1 MgSO4, 0.01 MnSO4H2O, 0.01 Fe2(SO4)3H2O, 0.01 Na2MoO4-2H2O, 0.4 (NH4)2SO4. Phenol and/or p-chlorophenol were added to the medium before inoculation [12,13]. The initial pH value of the medium was adjusted to 7 with 30% NaOH before autoclaving.
3.2. Analytical Methods
Cell density was determined with a UV spectrophotometer (Model-U-4100 spectrophotometer, Hitachi) by measuring the absorbance of the microorganism at the wavelength of 600 nm [14]. Then OD600 was converted to dry cell weight by a calibration curve, which was obtained by plotting dry weight of biomass per liter against optical density. Dry weight was determined by filtering a specific volume of suspended culture through pre-weighted 0.45 mm pore size filters, drying the cells at 90˚C until the weight were constant. Phenol and p-chlorophenol concentrations were quantified by high performance liquid chromatography (HPLC). Immediately after the measurements of optical density, aqueous samples of suspended culture were centrifuged at 1000 rpm for 20 min. Then the cells free supernatants were used for determining the residual phenolic concentrations in the solution. HPLC was performed on a reverse phase C18 column (250 mm. 4.6 mm, LabAlliance, U.S.A.) with a methanol/water (400/ 300, v/v) mobile phase at a flow rate of 1.0 mL min–1, and detection was realized with a UV detector (Model 500, LabAlliance, U.S.A.) at 280 nm. The retention time for phenol was 4.89 min and for p-chlorophenol was 6.12 min.
3.3. Biodegradation Experiments
The startup of the experiments was obtained by inoculating 20 mL liquid broth medium with microbial strain from nutrient agar slant stored in 4˚C refrigerator, in sterile conditions. After 20 h of incubation at 37˚C, subculture was carried out by inoculating 2 mL of the cell culture to 100 mL fresh liquid broth medium at initial pH of 7. Then 2.5 mL of the cells at late exponential growth phase (OD600 around 1.1 absorbance units) were transferred into the MSM as inoculation. The biodegradation experiments were conducted in a series of 250 mL sterile shaking flasks. Each flask contained 50 mL sterile mineral salt medium (MSM) with various phenol or p-chlorophenol concentrations. When they were used as the sole carbon source and energy, phenol concentrations varied from 5 to 1600 mg·L–1, and p-chlorophenol concentrations varied from 5 to 250 mg·L–1 were investigated. To determine the interactions between the mixed substrates, batch experiments were also performed in MSM with both phenol and p-chlorophenol were existed. The used phenol concentrations were ranging from 5 to 1600 mg·L–1 (5, 10, 50, 100, 150, 200, 300, 500, 800, 1000, 1200, 1400, 1600), and at each phenol concentration 5 to 250 mg·L–1 (5, 10, 30, 50, 80, 100, 150, 200,250) p-chlorophenol were added to the medium. The sub cultivated cells at late exponential phase were also used to inoculation. Five milliliters samples were periodically removed from the medium for analysis of cell density and residual phenolic concentrations. The data shown in the corresponding figures in Section 4 were the mean values of the experiments.All of above experiments were carried out at the initial pH of 7˚C and 37˚C in an orbital shaker at 150 rpm. All experiments were repeated three times.
4. Results and Discussion
4.1. Biodegradation on Single Growth Substrate
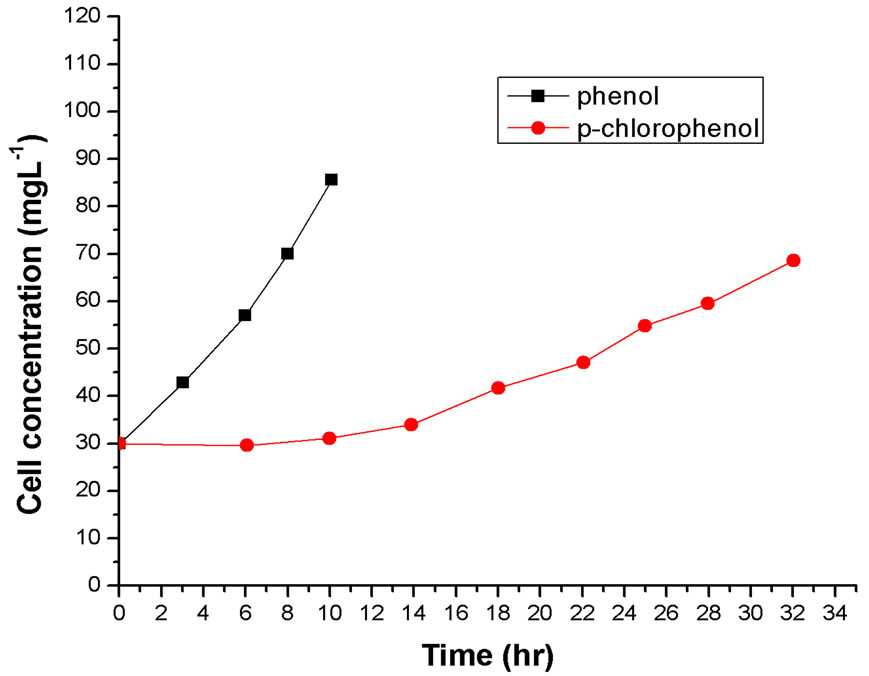
Batch cultures of Rhodococcus sp.RSP8 were conducted in media containing either phenol or p-chlorophenol as the sole carbon source. Substrate of high concentrations can exhibit inhibitions on cell growth and its own degradation, the inhibitions of phenol on cell growth and substrate degradation were widely observed by some other researchers [15-17]. Figures 1(a) and (b) depicted the comparison of cell growth and substrate degradation at the initial phenol or p-chlorophenol concentration of 100 mg·L–1. It was very impressive for 100 mg·L–1 phenol to be entirely degraded within 10 h. This was 22 h less than that for 100 mg·L–1 p-chlorophenol. It can still be seen from the cell growth curves that there is hardly any lag phase that can be observed when cell grow on phenol, but when used the same amount of p-chlorophenol as sole substrate, 12 h lag phase appeared. And the cell growth rate and the ultimate cell concentration were higher than that on p-chlorophenol alone. It may be attributed to the fact that p-chlorophenol was more toxic than phenol, which exhibited larger inhibitory effects on the cell growth behaviors.
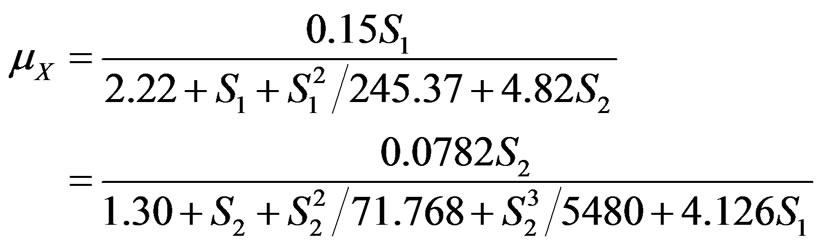
To obtain the cell growth and degradation kinetic model parameters of single substrate, cell and substrate concentrations were measured with time for different initial liquid substrate concentrations of phenol (5 - 1600 mg·L–1) and p-chlorophenol (5 - 250 mg·L–1) alone. Model parameters were estimated by curve-fitting based on non-linear least squares of residuals. Non-linear regression analysis was performed using Matlab software employing a hybrid of the Gauss-Newton and steepest descent techniques to solving non-linear equations. And the following model equations and their regression coefficients were obtained for phenol alone and p-chlorophenol alone:
For phenol alone:
 (42)
(42)
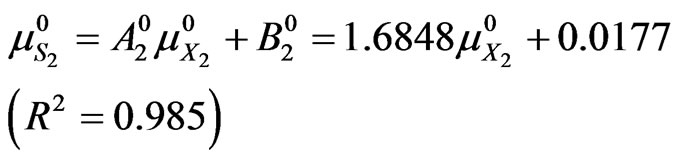
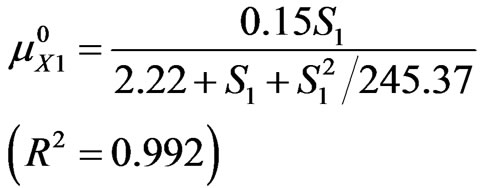 (43)
(43)
 (a)
(a)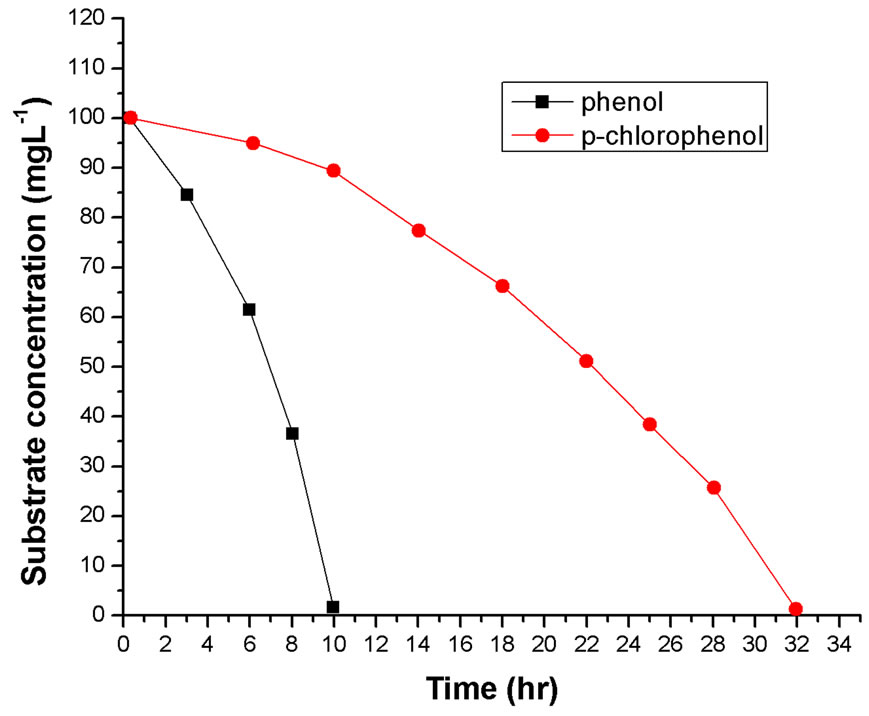 (b)
(b)
Figure 1. (a) and (b) Comparison of cell growth and substrates degradation at the initial phenol or p-chlorophenol concentration of 100 mg·L–1.

 (44)
(44)
 (45)
(45)
The dependences of Rhodococcus sp.RSP8 specific growth rate and degradation rate on the initial concentrations of phenol and p-chlorophenol alone are shown in Figures 2 and 3. It can be seen that the maximum specific
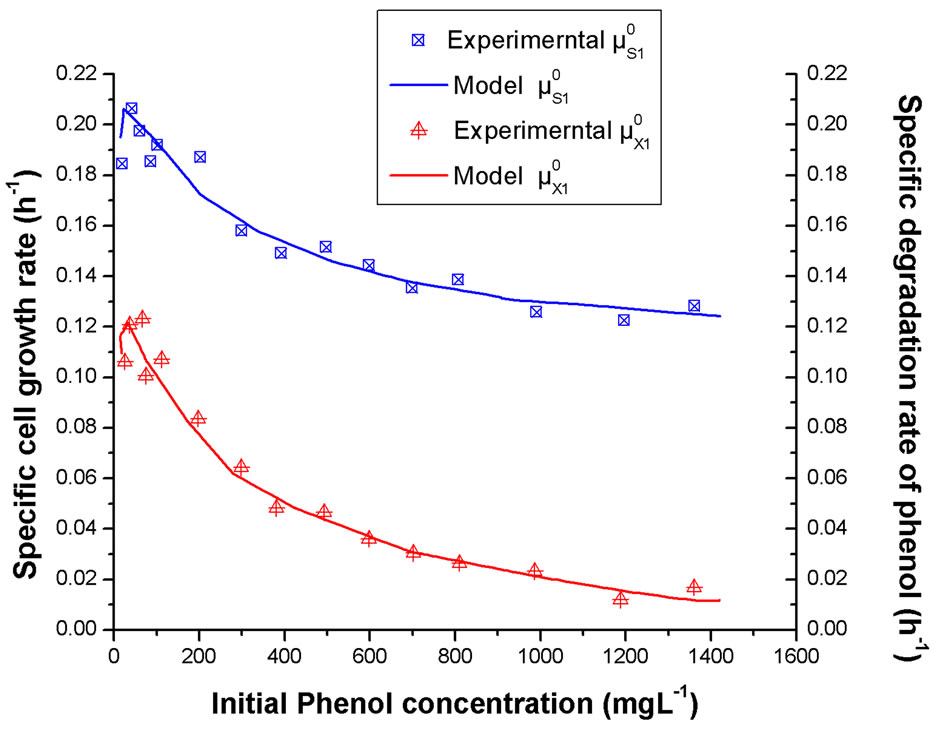
Figure 2. Influence of the initial phenol concentration alone on the specific growth rate and specific degradation rate.
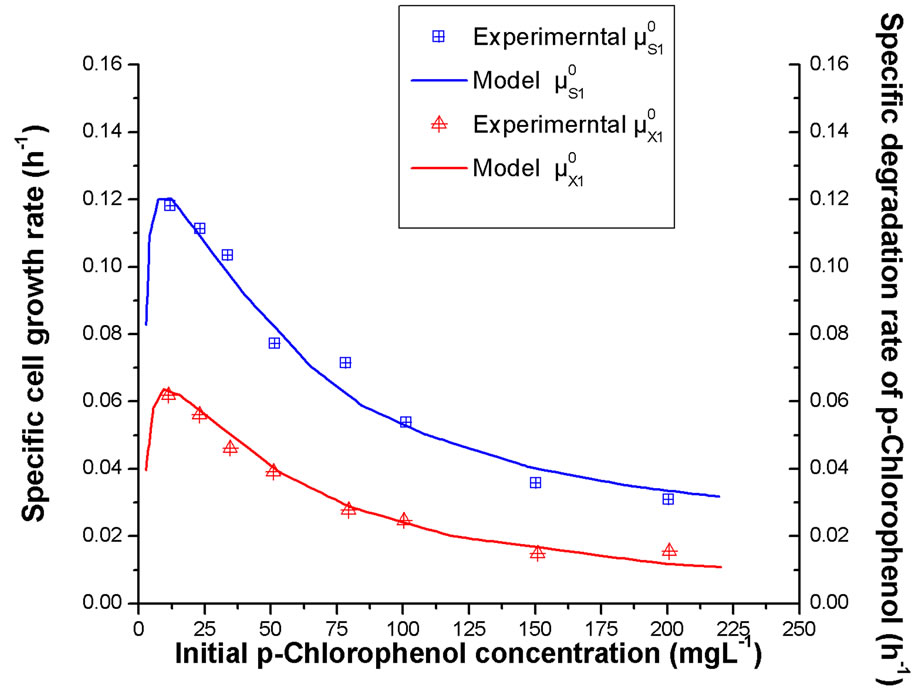
Figure 3. Dependence of specific growth rate and specific degradation rate of p-chlorophenol alone at different initial p-chlorophenol concentrations.
growth and degradation rates both occurred at low substrate concentration. And with further increase of initial substrate concentration, much lower values of the specific growth and degradation rates were obtained. In addition, it was also noted that the simulated values of cell growth and degradation kinetic models agreed well with the experimental data. The phenomenon was substantially resulting from intense substrate inhibition at high substrate concentration. And the higher the substrate concentration in the medium was, the stronger the substrate inhibition displayed.
On comparing Figure 2 with Figure 3, it was found that both the specific cell growth rates and the specific degradation rates in phenol solution were much higher than that in p-chlorophenol solution, which indicated that the strain was inclined to utilize more phenol than p-chlorophenol. It might be the result from the fact that strain Rhodococcus sp.RSP8 was separated from the acclimated activated sludge using phenol as sole carbon and energy source and it was easy for it to adjust to the environment with phenol.
4.2. Biodegradation on Dual Growth Substrates
Biodegradation experiments with media containing both phenol and p-chlorophenol at different concentrations were performed in a series. Examinations were varied widely (phenol concentration from 5 to 1600 mg·L–1 and p-chlorophenol concentration from 5 to 250 mg·L–1) so as to validate the general application of these models. As the presence of interaction between phenol and p-chlorophenol dual substrates, the behavior of cell growth and substrate degradation might differ greatly from the single substrate system.
Examples of the overall cell concentrations and substrates degradation at the initial total phenolic concentration (sum of phenol and p-chlorophenol) of 200 mg·L–1 are shown in Figures 4 and 5, respectively. The cell growth curves at initial phenol or p-chlorophenol concentration of 200 mg·L–1 are presented to Figure 4 so as to see the inhibition effects of the second component in detail. It can be observed from Figure 4 that the overall cell growth rates on the dual substrates were higher than these of p-chlorophenol alone and smaller than these of phenol alone and the total cell growth was the co-action of phenol and p-chlorophenol. It was clear that the overall cell growth rates decreased with the increased p-chlorophenol concentration in the medium (Figure 4). It may due to the added p-chlorophenol enhance the substrate inhibition of the mixed system on cell growth, however, the substrates interactions may be another important reason. We can see from Figure 5 that both phenol and p-chlorophenol could be consumed simultaneously, but the presence of p-chlorophenol decreased the degradation rate of phenol. At the same time, phenol also exerted strong inhibition on p-chlorophenol transformation; it was observed that
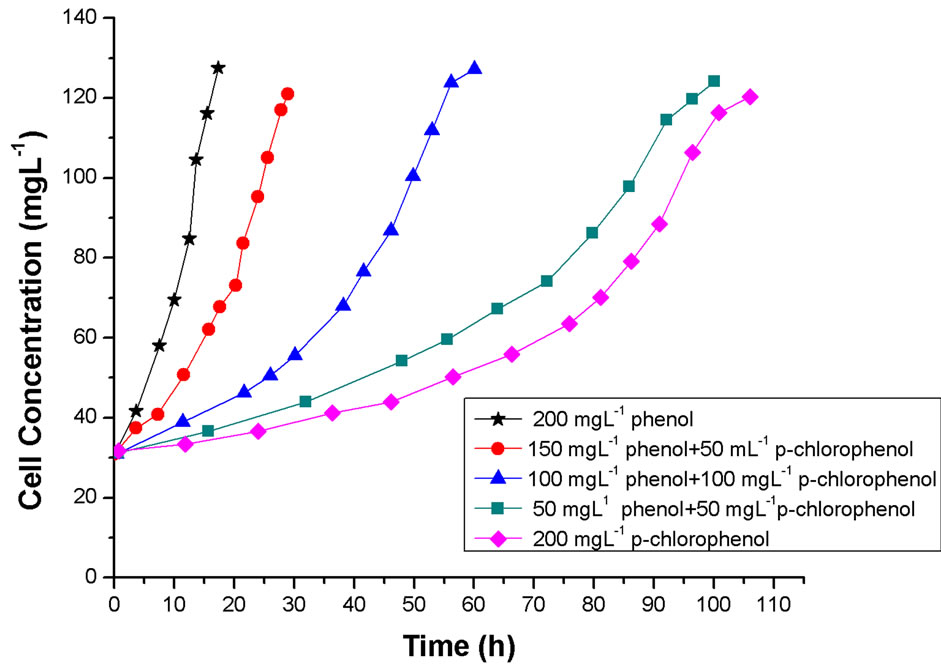
Figure 4. Experimental data for cell growth at initial total phenolic concentration of 200 mg·L–1.

Figure 5. Experimental data of phenol and p-chlorophenol degradation at initial total phenolic concentration of 200 mg·L–1.
rapid removal of p-chlorophenol occurred only near the depletion of phenol.
Kinetics of overall cell growth on phenol in the presence of p-chlorophenol was modeled by Equation (36). Using the determined parameters for cells grown on phenol ( ) and p-chlorophenol (
 )
)
alone, coupled with experimental data obtained from cells grown on the dual growth substrates, the parameters representing interactions between phenol and p-chlorophenol including  were determined, and
  = 2.46 ± 0.12, K = 1.8 ± 0.36 × 10⁻⁶, M = 5.5 ± 0.74 × 10⁻⁵, Q= 6.7 ± 0.53 × 10⁻⁴. As shown in Figure 4, the model fitted the experimental data well with R2 = 0.996.
Correlation coefficients of phenol and p-chlorophenol are R2 = 0.992 and R2 = 0.991, respectively.
The specific degradation rates of phenol and p-chlorophenol on the dual substrates system were modeled by Equations (40) and (41), respectively. Based on the experimental data of biodegradation and calculated µX1 and µX1 with time according to Equations (34) and (35), the model parameters of phenol and p-chlorophenol obtained for the substrates degradation kinetics in the dual substrates system were shown in Table 1. The Figure 5 also shows the comparisons of the predictions of these degradation kinetic models and the experimentally determined degradation data of phenol and p-chlorophenol on the dual substrates system at the initial total phenolic
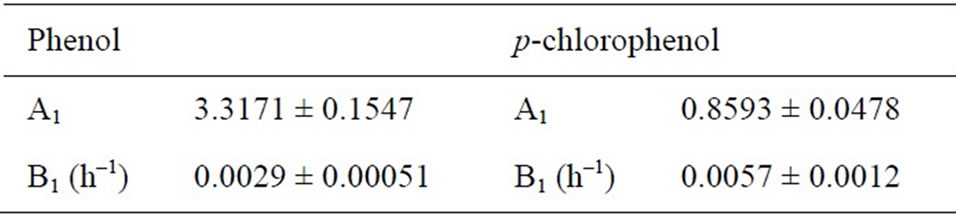
Table 1. Summary of the model parameters for specific degradation kinetics in the dual substrates system.
concentrations of 200 mg·L–1. Obviously, the simulated values of the degradation kinetics of phenol and pchlorophenol in the dual substrates system agreed well with the experimental data. Comparison between experimental results and model simulation of cell growth and substrates degradation in dual substrates system in all other experiments were also performed, the outcome showed that the experimental data and model prediction were in good agreement with R2 ≥ 0.95.
5. Comparison with the Other Model
The kinetics of cell growth on multiple growth substrates in biodegradation reaction has been widely studied by some other researchers. The most widely used model was the cross-inhibition equation proposed by Yoon et al. [16], Abuhamed et al. [18] modified this model to determine the interactions between benzene, toluene and phenol under the substrate inhibition effects. The model equation used by Abuhamed et al. were also adopted to simulate the overall cell growth data of our research, and Equations (40) and (41) were still used to model phenol and p-chlorophenol degradation, respectively. The obtained models were:
For overall cell growth:
 (46)
(46)
For phenol degradation in the dual substrates system
 (47)
(47)
For p-chlorophenol degradation in the dual substrates system

For phenol degradation in the dual substrates system
 (48)
(48)
For p-chlorophenol degradation in the dual substrates system
 (49)
(49)
Curve fitting at different initial phenol and p-chloroenol concentration was carried out, typical example of cell growth and substrates degradation at initial phenol concentration of 150 mg·L–1 and p-chlorophenol concentration of 50 mg·L–1 are plotted in Figures 6 and 7, respectively. For comparison, our model simulation is also presented. It can be seen that the fit of the model used by Abuhamed et al. was not as good as the models used in our work, especially during the substrates degradation
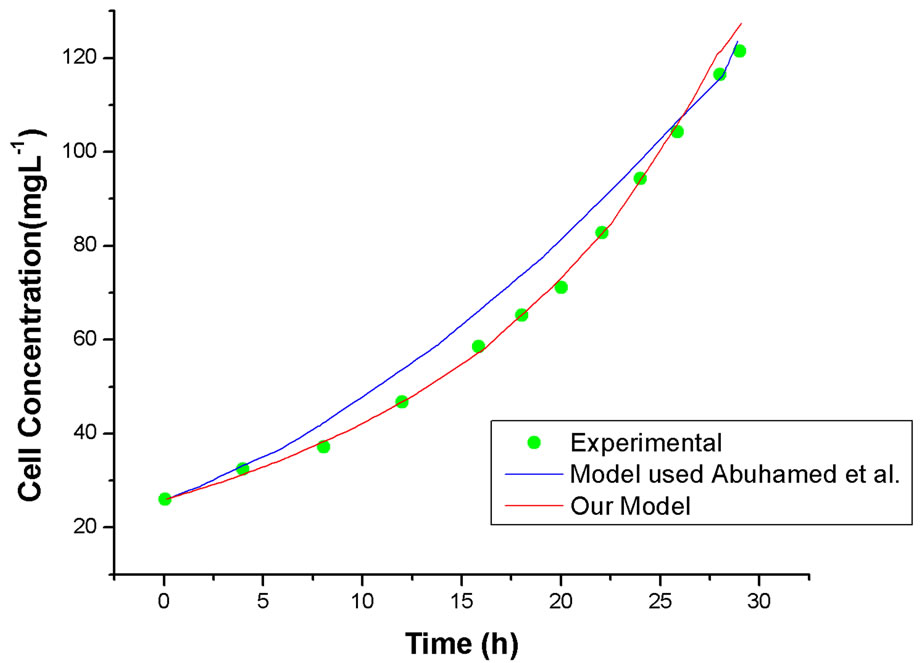
Figure 6. Comparison of our model and model used by Abuhamed et al. on simulation of cell growth in mixed substrates system, initial phenol concentration of 150 mg·L–1 and p-chlorophenol concentration of 50 mg·L–1.
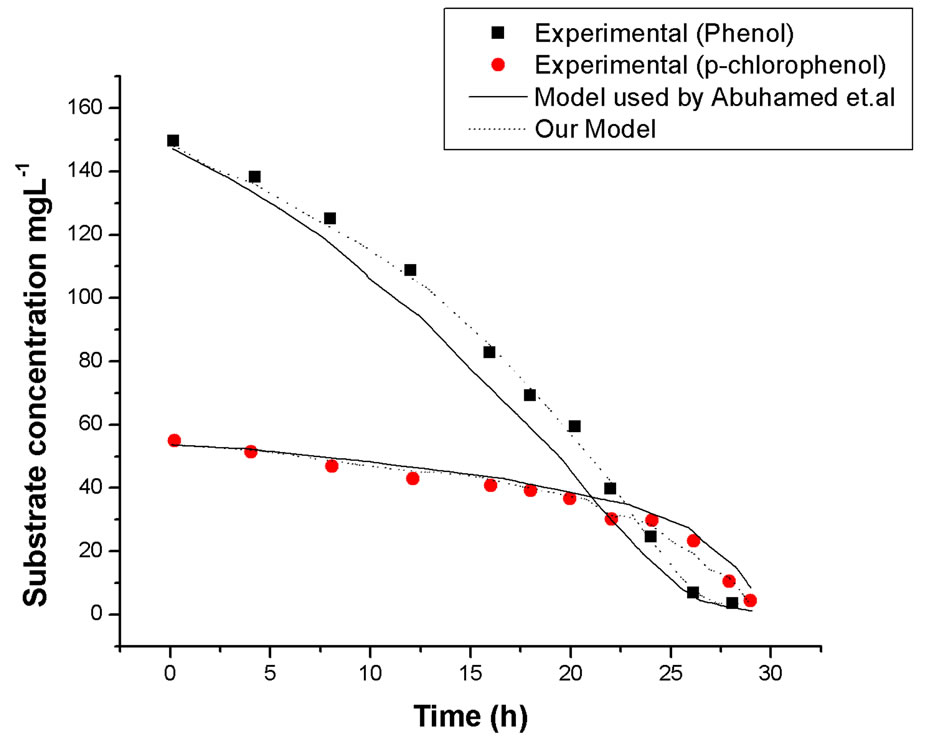
Figure 7. Comparison of our model and model used by Abuhamed et al. on simulation of substrates degradation in mixed substrates system, initial phenol concentration of 150 mg·L–1 and p-chlorophenol concentration of 50 mg·L–1.
course. So we can conclude that our model was better to depict our experimental results.
6. Conclusions
Biological degradations of phenol and p-chlorophenol as the single and mixed substrates by a bacterial strain of Rhodococcus sp.RSP8 in the liquid mineral salt medium (MSM) were carried out in shake-flask experiments at 37˚C and the initial pH of approximately 7. The cells were able to consume phenol and p-chlorophenol alone completely. When cells grew on the mixture of phenol and p-chlorophenol, strong substrate interactions were observed. The kinetics of phenol and p-chlorophenol as the single and mixed substrates by Rhodococcus sp.RSP8 were investigated at the initial phenol concentrations varied from 5 to 1600 mg·L–1, the initial p-chlorophenol concentrations varied from 5 to 250 mg·L–1, the temperature of 37˚C and the initial pH of 7. The kinetic models for the specific growth rate and the specific degradation of phenol and p-chlorophenol as the single and mixed substrates were proposed, and the simulated values of these models agreed well with the experimental data. It is our view that the above information would be useful for modeling and designing the units treating phenol and pchlorophenol contaminated industrial wastewaters. These findings would be useful in the treatment of phenolic contaminated industrial wastewater by low cost biological methods and thus would help in the protection of water sources from pollution.
7. Acknowledgements
This work was supported by a Fellowship from CSIR, New Delhi, India.
The authors have declared no conflict of interest.
REFERENCES
- Z. Alexievaa, M. Gerginova, P. Zlateva and N. Peneva, “Comparision of Growth Kinetics and Phenol Metabolizing Enzymes of Trichosporn Cutaneum R57 and Mutants with Modified Degradation Abilities,” Enzyme and Microbial Technology, Vol. 34, No. 3-4, 2004, pp. 242-247. doi:10.1016/j.enzmictec.2003.10.010
- K. Bandhyopadhyay, D. Das, P. Bhattacharyya and B. R. Maiti, “Reaction Engineering Studies on Biodegradation of Phenol by Pseudomonas Putida MTCC 1194 Immobilized on Calcium Alginate,” Biochemical Engineering Journal, Vol. 8, No. 3, 2001, pp. 179-186. doi:10.1016/S1369-703X(01)00101-2
- W. Sokol, “Oxidation of an Inhibitory Substrate by Washed Cells (Oxidation of Phenol by Pseudomonas Putida),” Biotechnology and Bioengineering, Vol. 30, 1987, pp. 921-921. doi:10.1002/bit.260300802
- R. D. Yang and A. E. Humphrey, “Dynamic and Steady State Studies of Phenol Biodegradation in Pure and Mixed Cultures,” Biotechnology and Bioengineering, Vol. 17, No. 8, 1975, pp. 1211-1235. doi:10.1002/bit.260170809
- Z. Aleksieva, D. Ivanova, T. Godjevargova and B. Atanasov, “Degradation of Some Phenol Derivatives by Trichosporon Cutaneum R57,” Process Biochemistry, Vol. 37, No. 11, 2002, pp. 1215-1219. doi:10.1016/S0032-9592(01)00336-3
- K. Gunther, D. Schlosser and W. Fritsche, “Phenol and Cresol Metabolism in Bacillus Pumilus Isolate from Contaminated Groundwater,” Journal of Basic Microbiology, Vol. 35, No. 2, 1995, pp. 83-92. doi:10.1002/jobm.3620350205
- C. Hinteregger, R. Leitner, M. Loidl, A. Ferschi and F. Stereichsbier, “Degradation of Phenol and Phenolic Compounds by Pseuedomonas Putida EKP,” Applied Microbiology and Biotechnology, Vol. 37, No. 2, 1992, pp. 252- 259.
- J. Nielsen, J. Villdsen and G. Liden, “Bioreaction Engineering Principles,” 2nd Edition, Chinese Chemical Industry Pub, Beijing, 2002.
- E. B. James and F. O. David, “Biochemical Engineering Fundamentals,” 2nd Edition, McGraw-Hill Pub, US, 1986.
- H. Yong, G. Klinzing and H. W. Blanch, “Competition for Mixed Substrates by Microbial Populations,” Biotechnology and Bioengineering, Vol. 19, No. 8, 1977, pp. 1193-1210. doi:10.1002/bit.260190809
- H. Feitkenhauer, S. Schnicke, R. Muller and H. Markl, “Kinetic Parameters of Continuous Cultures of Bacillus Thermoleovorans sp.A2 Degrading Phenol,” Journal of Biotechnology, Vol. 103, No. 2, 2003, pp. 129-135. doi:10.1016/S0168-1656(03)00105-6
- D. Leonard, D. Nicholas and Lindley, “Growth of Ralstonia Eutropha on Inhibitory Concentrations of Phenol: Diminished Growth Can Be Attributed to Hydrophobic Perturbation of Phenol Hydroxylase Activity,” Enzyme and Microbial Technology, Vol. 25, No. 3, 1999, pp. 271- 277.doi:10.1016/S0141-0229(99)00039-3
- M. Kibret, W. Somitsch and K. H. Robra, “Characterization of a Phenol Degrading Mixed Population by Enzyme Assay,” Water Research, Vol. 34, No. 4, 2000, pp. 1127-1134. doi:10.1016/S0043-1354(99)00248-1
- F. Zeng, K. Y. Cui, J. M. Fu, G. Y. Sheng and H. F. Yang, “Biodegradability of Di(2-Ethylhexyl) Phthalate by Pseudomonas Fluorescens FS1,” Water, Air & Soil Pollution, Vol. 140, No. 1-4, 2002, pp. 297-305. doi:10.1023/A:1020108502776
- P. J. Allsop, Y. Chisti, M. Moo-Young and G. R. Sullivan, “Dynamics of Phenol Degradation by Pseudomonas Putida,” Biotechnology and Bioengineering, Vol. 41, No. 5, 1993, pp. 572-580. doi:10.1002/bit.260410510
- B. M. Peytona, T. Wilsona and D. R. Yonge, “Kinetics of Phenol Biodegradation in High Salt Solutions,” Water Research, Vol. 36, No. 19, 2002, pp. 4811-4820. doi:10.1016/S0043-1354(02)00200-2
- S. J. Wang and K. C. Loh, “Modeling the Role of Metabolic Intermediates in Kinetics of Phenol Biodegradation,” Enzyme and Microbial Technology, Vol. 25, No. 3-5, 1999, pp. 177-184. doi:10.1016/S0141-0229(99)00060-5
- T. Abuhamed, E. Bayraktar, T. Mehmetoglu and U. Mehmetoglu, “Kinetics Model for Growth of Pseudomonas Putida F1 during Benzene, Toluene and Phenol Biodegradation,” Process Biochemistry, Vol. 39, No. 8, 2004, pp. 983-988. doi:10.1016/S0032-9592(03)00210-3