Journal of Biomedical Science and Engineering
Vol.6 No.4(2013), Article ID:30520,10 pages DOI:10.4236/jbise.2013.64061
Effects of air sac compliances on flow in the parabronchi: Computational fluid dynamics using an anatomically simplified model of an avian respiratory system
![]()
Department of Mechanical Engineering, Saitama University, Saitama, Japan
Email: masanorin@mech.saitama-u.ac.jp
Copyright © 2013 Akira Urushikubo et al. This is an open access article distributed under the Creative Commons Attribution License, which permits unrestricted use, distribution, and reproduction in any medium, provided the original work is properly cited.
Received 8 March 2013; revised 12 April 2013; accepted 20 April 2013
Keywords: Computational Fluid Dynamics; Avian Lung; Air Sacs; Compliance
ABSTRACT
Air flow in an avian lung was studied numerically to determine the effects of air sac compliance on flow in the parabronchi. In this preliminary study, the geometry of the avian respiratory system was simplified to capture the characteristics of respiratory flow. The pressure fluctuation within air sacs caused by inflation and deflation was expressed by a lumped parameter model. The results demonstrate that the flow direction in the parabronchi varied, depending upon the compliance of the air sacs. A unidirectional flow in the parabronchi was achieved for compliances where pressure fluctuations in all air sacs were in phase. Air sac compliance significantly affected the pressures in the anterior and posterior air sacs and thus the pressure difference over the parabronchi that drove the flow in the parabronchi. These results address the importance of air sac compliance in the avian respiratory system and suggest that the compliance of air sacs would be optimized to accomplish unidirectional flow in the parabronchi.
1. INTRODUCTION
Avian respiratory systems mainly consist of the trachea, bronchi and air sacs. The bronchi form a continuous loop, starting from the mesobronchus, ventrobronchi, parabronchi, and ending up with the dorsobronchi [1-3]. This loop structure allows inhaled air to flow in only one direction. Oxygen-rich inhaled air passes, during both inspiration and expiration, through the parabronchi, where an exchange of oxygen and carbon dioxide takes place [4-6]. This lung design helps birds maintain high metabolic rates for flight at altitude [6,7].
Two mechanical factors have been proposed to induce unidirectional flow in the parabronchi. One is an aerodynamics valve. As shown by radiophotography and microscopy [8,9], the primary bronchi just cranial to the ventrobronchial junction, the junction between primary bronchus and ventrobronchi, is narrowed in some birds. This narrowing accelerates the inhaled air, thereby increasing its convective inertia and directing the inhaled air to the mesobronchi [8,10-12]. It also causes flow separation at the ventrobronchial junction [12] and enhances formation of vortices at the origin of the ventrobronchi. The vortices work as a type of lid for the inhaled air, such that it cannot flow into the ventrobronchi [13-15]. The other mechanical factor is a pressure difference between the air sacs [5,16]. Evidence for this lies in the experiments [17,18] that demonstrate that occlusion of air sacs with cotton results in depression of the respiratory function, although the degree of depression depended in that work on the combination of occlusions. On the basis of these results, the pressure difference between air sacs was concluded to regulate the flow in parabonchi.
The air sacs are stretchy bags composed of thin membranes [3,19]. They deform largely and repeatedly in accordance with a change in pleural pressure to store in and push out air for helping continuous flow in parabronchi where exchange of oxygen and carbon dioxide takes place [20].
Airsacculitis is one of the pathological symptoms caused by Escherichia coli [21], Mycoplasma [22-24], aspergillosis [25], and so forth. Infected by these bacteria and virus, the air sac tissue is histologically changed and gets thickened [22-24]. It is also known that birds with airsaccultis exhibit respiratory distress [26]. Considering these two facts together, we postulate that the compliance of air sacs would be optimized for the activities of each bird species, and the change in air sac compliance would result in changes in respiratory flow and accordingly respiratory distress.
The aim of the study was to investigate the effects of air sac compliance on flow in the parabronchi. In this preliminary study, the geometry of the avian respiratory system was simplified to capture the characteristics of respiratory flow. The pressure fluctuation within air sacs caused by their inflation and deflation was expressed with a lumped parameter model. The flow in the avian respiratory system was studied numerically using various values of air sac compliance to determine their influence on respiratory flow.
2. METHOD
2.1. Geometry of the Avian Lung Model
Figure 1 presents an overview of the model of the avian respiratory system. The model simplifies the anatomical characteristics of the avian lung [4]. Here we assume that the geometry and diameters of the trachea and bronchi do not change during the respiratory cycle for the following reasons. First, the trachea is supported by rings of cartilage [1,9,27] and airways embedded in parenchyma are practically rigid [3,4,28-30]. Second, the lung volume varies by a mere 1.4% between respiratory cycles [31]. The connecting points and length of the respiratory bronchi were determined on the basis of anatomical data [1,2, 32,33]. For simplicity, the diameter of the bronchi, D, was uniformly set to 4.5 mm in reference to the maximum diameter of the primary bronchi of the domestic fowl [1]. The cross-section identified by the arrow in Figure 1(a) represents the inlet connecting to the syrinx which in turn connects to the trachea and then the larynx. For further explanation, a Cartesian coordinate system (x, y, z) is defined at the origin, O, placed at the center of the inlet, such that the x axis lies along the center line of the primary bronchi. In the following, the nomenclature of [4] is used. Figure 1(b) presents the x-y cross-section of the model with a description of the lengths. The channel extending along the x-axis from the inlet is the primary bronchus, with a length of 24.55 mm. The primary bronchus bifurcates into the mesobronchus, which extends along the x-axis and the ventrobronchi, which follows the y-axis. The mesobronchus is further connected to the dorsobronchi, which is established along the y-axis. Two posterior air sacs, namely, the posterior thoracic air sac
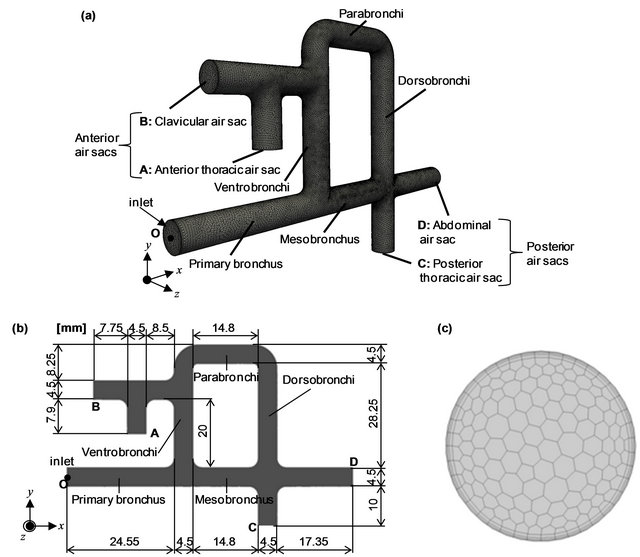
Figure 1. Anatomically-simplified model of the avian lung. (a) The computational mesh; (b) Cross-section view of the flow channel at the x-y plane; and (c) The computational mesh of the inlet cross-section.
(cross-section C) and the abdominal air sac (cross-section D), are present at the junction between the mesobronchus and the dorsobronchi. The dorsobronchi turns left to connect with the parabonchi, where the exchange of oxygen and carbon dioxide takes place. The parabrochi meets the ventrobronchi, which has two anterior air sacs, namely, the anterior thoracic air sac (cross-section A) and the clavicular air sac (cross-section B) that includes the interclavicular air sac and the cervical air sac.
Computational meshes were created for flow analysis (Figure 1(a)). Four layers of prism meshes that account for 7.6% in the radial direction from the wall were allocated near the wall to resolve boundary layers. The rest of the computational domain was filled with polyhedral meshes, as seen in Figure 1(c), which shows the mesh of the inlet. The total number of nodal points was 387,781 and that of the meshes was 132,004.
2.2. Modeling of the Mechanics of an Air Sac
Enlargement of the body cavity by inspiratory muscle action lowers pressure in the air sacs relative to the atmosphere during inspiration, thereby drawing air into the lung and air sacs [3]. Once the elastic force of the air sac exceeds the pressure in the air sac, it deflates, thereby causing an outflow of the air, with a decrease in the pressure within the air sac. To represent this behavior, we employed a lumped parameter model, given by
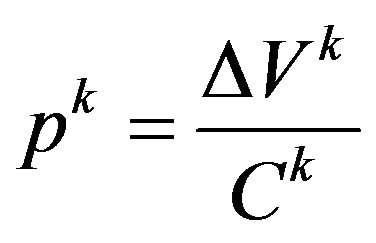 (1)
(1)
where pk is the pressure in air sac k, ∆Vk is the total change in the volume of air sac k, and Ck is the compliance of the air sac k. Superscript k stands for one of the air sacs attached to cross-section A, B, C or D. The total change in the volume of each air sac from its natural state was calculated from
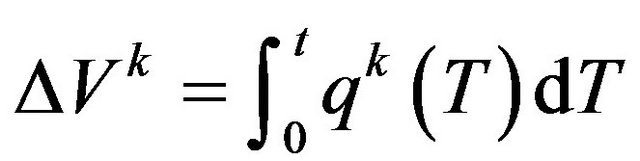 (2)
(2)
where q(t) is the flow rate entering or exiting the air sac at time t. In Equation (1), the numerator stands for the total volume change from the natural state. This equation describes the situation where an increase in the total amount of air contained in the air sac causes the elevation of pressure within the air sac, and vice versa.
2.3. Flow Analysis
As described below, the maximum velocity at the inlet was set at 2.06 m/s. Using the speed of sound at room temperature (a = 343.51 m/s), the Mach number for the system was estimated to be 0.006. This is much smaller than the threshold, 0.3, below which it can be assumed that air is an incompressible fluid, with density 1.2 kg/m3 and kinematic viscosity 1.5 × 10⁻⁵ m2/s. Furthermore, flow was assumed to be laminar because the maximum Reynolds number assessed at the inlet was approximately 725. The flow simulations were performed by solving the Navier-Stokes equations and the equation of continuity, given by
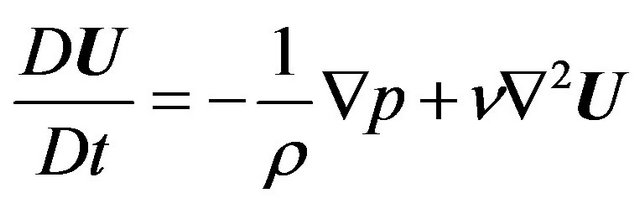 (3)
(3)
 (4)
(4)
where U is the velocity vector (u, v, w) in the (x, y, z) directions and  is a differential operator. The equations were solved with Open FOAM software (SGI Corp, v2.0.1) that adopts a finite volume method on the basis of the pressure implicit with splitting of operators method for formulation. An implicit Euler scheme was used for the unsteady term, the first-order Gaussian integration with a central difference scheme was used for the gradient term, and the first-order Gaussian integration with an upwind scheme was used for the divergence term [34]. Convergence of the numerical solution was assessed based on a maximum tolerance of 1.0 × 10⁻⁶ for pressure and 1.0 × 10⁻⁵ for velocity.
2.4. Simulation Procedure
A flowchart of the simulation is shown in Figure 2. The simulation was commenced from a quiescent flow state. With advancement of a time step, a total change in the volume of each air sac from its natural state was calculated from velocity obtained by the current time step from Equation (2), and then the pressure in each air sac was calculated from Equation (1). The pressure in each
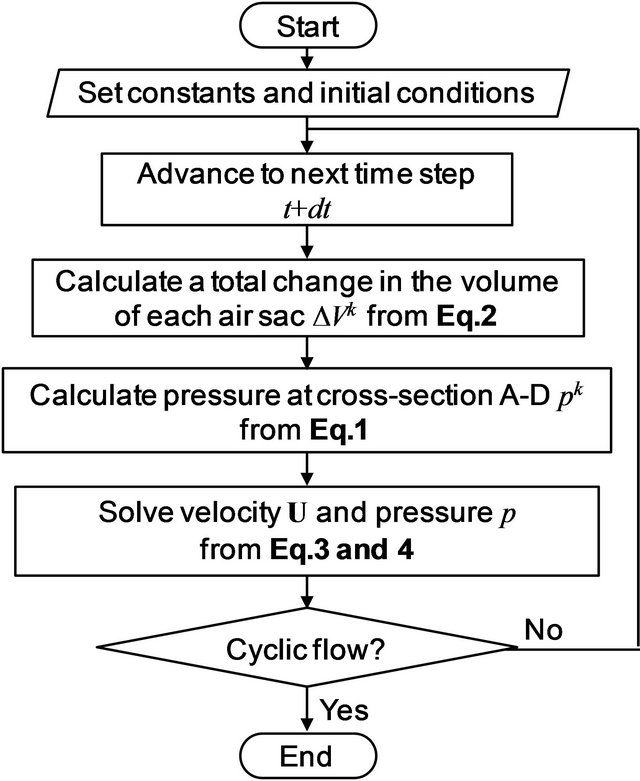
Figure 2. A flowchart of the avian respiratory flow simulation.
air sac was assigned to the cross-sections A-D as outlet boundary conditions for the following flow simulation. Inflow velocity was given at the inlet as an inlet boundary condition. Since effects of the air sac compliance on respiratory flow would be more manifested than eupneic breathing, panting breath condition was employed. Figure 3 plots a time variation of the inflow rate used in this study. The curve was obtained by approximating the data of panting breath of a duck with a sinusoidal function [20], and the frequency of respiration f was set to 10 Hz in reference to the data of domestic pigeons in panting breath [35]. The Womersley number assessed with the inlet diameter as a characteristic length αw was 4.6. Because the flow was oscillatory, the velocity profile at the inlet was defined by Womersley flow [36]:
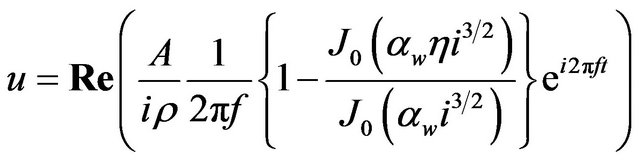 (5)
(5)
 (6)
(6)
where Re means “take the real part of”, f is a frequency of respiration, αw is the Womersley number, J0 is the Bessel function of the first kind, and η is the non-dimensional number r/R representing a normalized radial position with respect to the radius of the inlet R. Constant A is determined from the tidal volume VT. The constant A in Equation (5) was determined as 211.8 kg/m2s2 from the tidal volume of a pigeon VT = 1.05 × 10⁻⁶ m3 [35]. The non-slip condition (zero velocity) was assumed at the wall. Given these boundary conditions, the flow simulation in the anatomically-simplified model of the avian lung was implemented by solving Equations (3) and (4). This process was repeated until cyclically repeatable flow was obtained. In actual simulations, the period of a respiratory cycle was divided into 200 steps with a time increment of Δt = 5 × 10⁻⁴ s for C equal to and larger than 1, and 1000 steps with a time increment of Δt = 1 × 10⁻⁴ s for the rest of conditions. According to the results, a cyclically repeatable flow was attained at most by the 13th cycle.
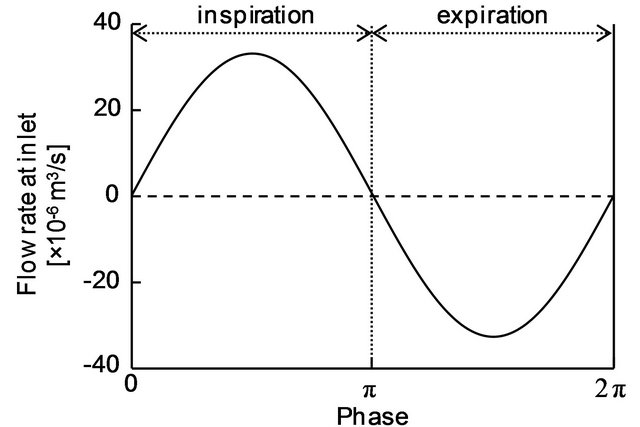
Figure 3. Time variation of the flow rate at the inlet.
We performed flow simulations with different values of the compliance. A unit value of the compliance C0 was 8.158 × 10⁻⁸ m3/Pa in reference to the compliance of the domestic fowl [37]. Note that this referred value of compliance is the overall compliance of the air sacs and the surrounding body walls. However, to our best knowledge, no published data on the compliance of air sacs is available. The values of the compliance of air sacs were changed concurrently, i.e. CA =CB =CC =CD = C, in 11 multiple of C0 (0.01, 0.1, 0.25, 0.5, 1, 2, 5, 8, 10, 50, 100) to determine their effects on respiratory flow in the avian lung. Hereinafter, each condition was described with its multiple number of C0, e.g. C = 0.01C0 is C = 0.01.
3. RESULTS
3.1. Flow Pattern
Figure 4 illustrates streamlines in the avian lung under the condition C = 0.01 at t/T = (a) 1/8 (acceleration in
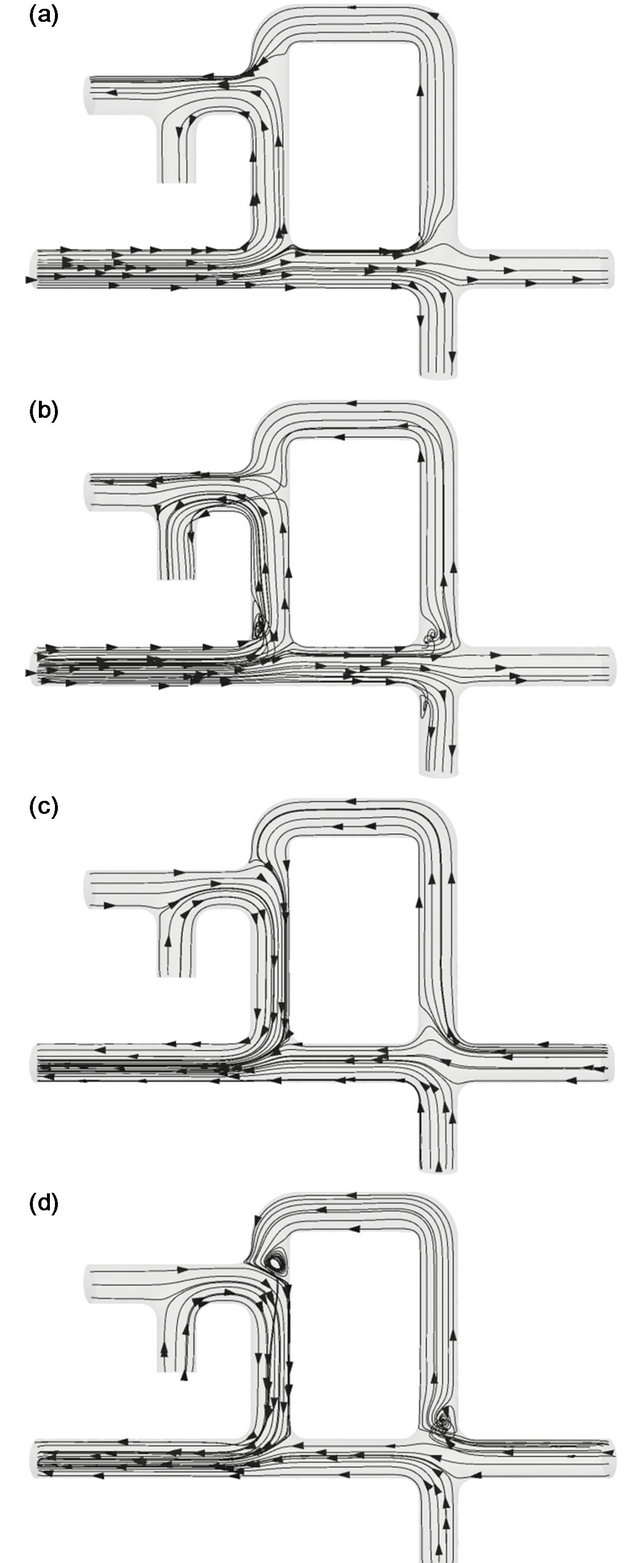
Figure 4. Streamlines in the avian lung at C = 0.01. (a) t/T = 1/8, (b) t/T = 3/8, (c) t/T = 5/8, (d) t/T = 7/8.
inspiration), (b) 3/8 (deceleration in inspiration), (c) 5/8 (acceleration in expiration) and (d) 7/8 (deceleration in expiration). As shown in Figure 4(a), the air coming through the primary bronchus split into two directions, the mesobronchus and the ventrobronchi. The flow heading to the mesobronchus was directed to the parabronchi from the posterior side to the anterior side (from the right to the left in Figure 4) after passing through the posterior air sacs and the dorsobronchi. In contrast, the flow heading to the ventrobronchi merged with the flow from the parabronchi and flowed into the anterior air sacs. The overall behavior of the flow during the deceleration of inspiration (Figure 4(b)) appeared almost the same as that observed during acceleration. However, vortices were formed at the corner of the primary bronchi and the ventrobronchi, as well as near the junction of the primary bronchi and the dorsobronchi.
When the flow turned to expiration, these vortices vanished, as seen in Figure 4(c). In this phase, part of the air ejected from the posterior air sacs was delivered to the parabronchi through the dorsobronchi, while the rest was directed to the mesobronchi. At the same time, the air ejected from the anterior air sacs merged with that from the parabronchi and later joined air from the mesobronchi to exit. Macroscopically, flow during the decaleration phase of expiration showed a similar pattern to that during acceleration, except that vortices formed at the corner of the dorsobronchi and the mesobronchi, and at the corner at the ventrobronchi and the parabronchi, as seen in Figure 4(d). At C = 0.01, the air in the parabrochi flowed from the anterior side to the posterior side throughout the respiratory cycle.
The flow pattern at C = 1 is shown in Figure 5. Time instants (a)-(d) in Figure 5 are the same as those in Figure 4. Although the overall behavior of the flow appears similar to that observed for C = 0.01, there are differences between Figures 4 and 5 worth noting. As in Figure 5(a), the flow in the parabronchi goes from the left to the right during acceleration in inspiration. The flow direction during deceleration was reversed from that during acceleration, as observed in Figure 5(b). At the same time, vortices formed at various corners. In particular, a large vortex was generated at the corner of the mesobronchi and the dorsobronchi. Those vortices were not observed during acceleration of expiration, as in Figure 5(c). During the deceleration phase of expiration, a small vortex was found at the root of the dorsobronchi (Figure 5(d)). In this case, flow in the parabronchi was not unidirectional; it was directed from the anterior to the posterior side during the acceleration of inspiration and from the posterior to the anterior side during the remainder of the respiratory cycle.
Figure 6 shows the flow pattern at C = 10. Again, time instants (a)-(d) in Figure 6 are the same as those in
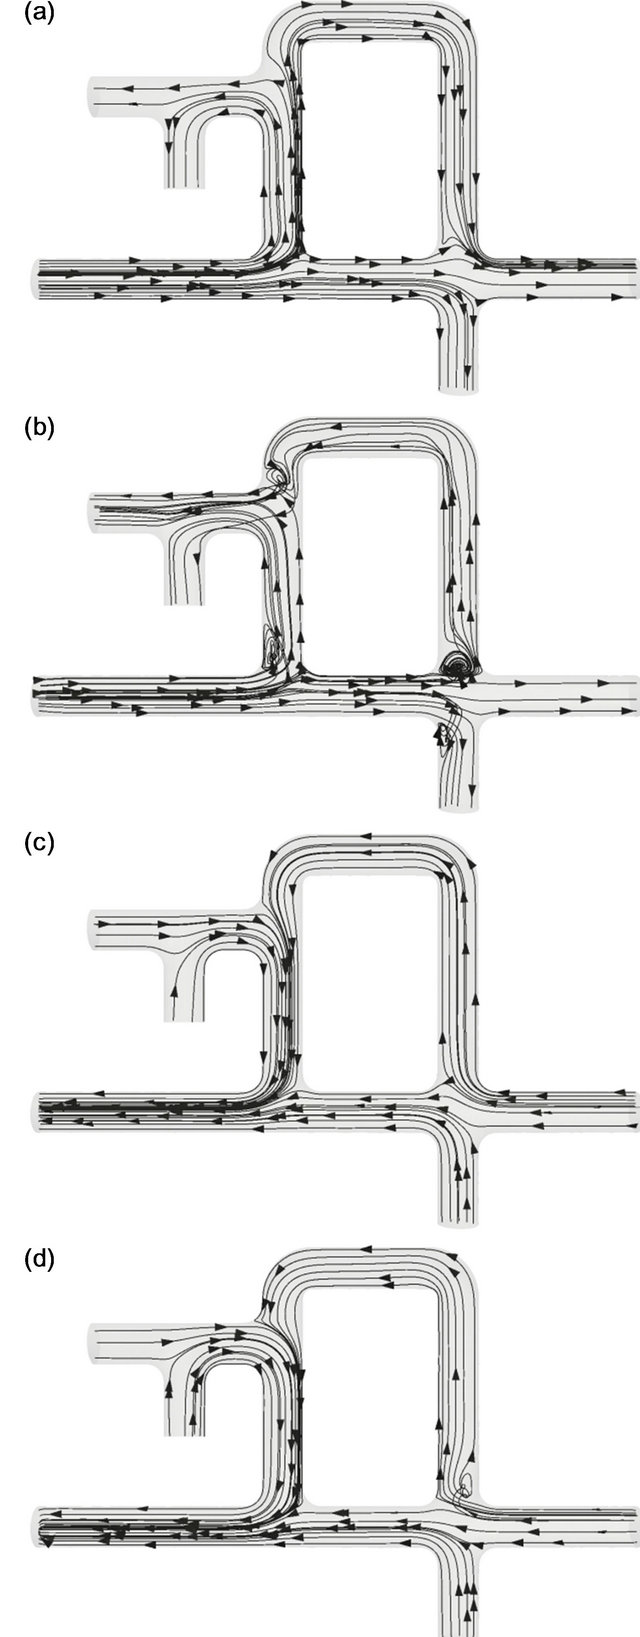
Figure 5. Streamlines in the avian lung at C = 1. (a) t/T = 1/8, (b) t/T = 3/8, (c) t/T = 5/8, (d) t/T = 7/8.
Figure 4, and the flow pattern at C = 10 was macroscopically the same as that at C = 0.01. Under this condition, the air in the parabonchi flowed from the posterior to the anterior side throughout the respiratory cycle. Differences between Figures 4 and 6 were found during the deceleration phase of both inspiration and expiration. During the deceleration phase of inspiration, the vortex that formed at the corner of the primary bronchi and the dorsobronchi occupied a larger space of the dorsobronchi,
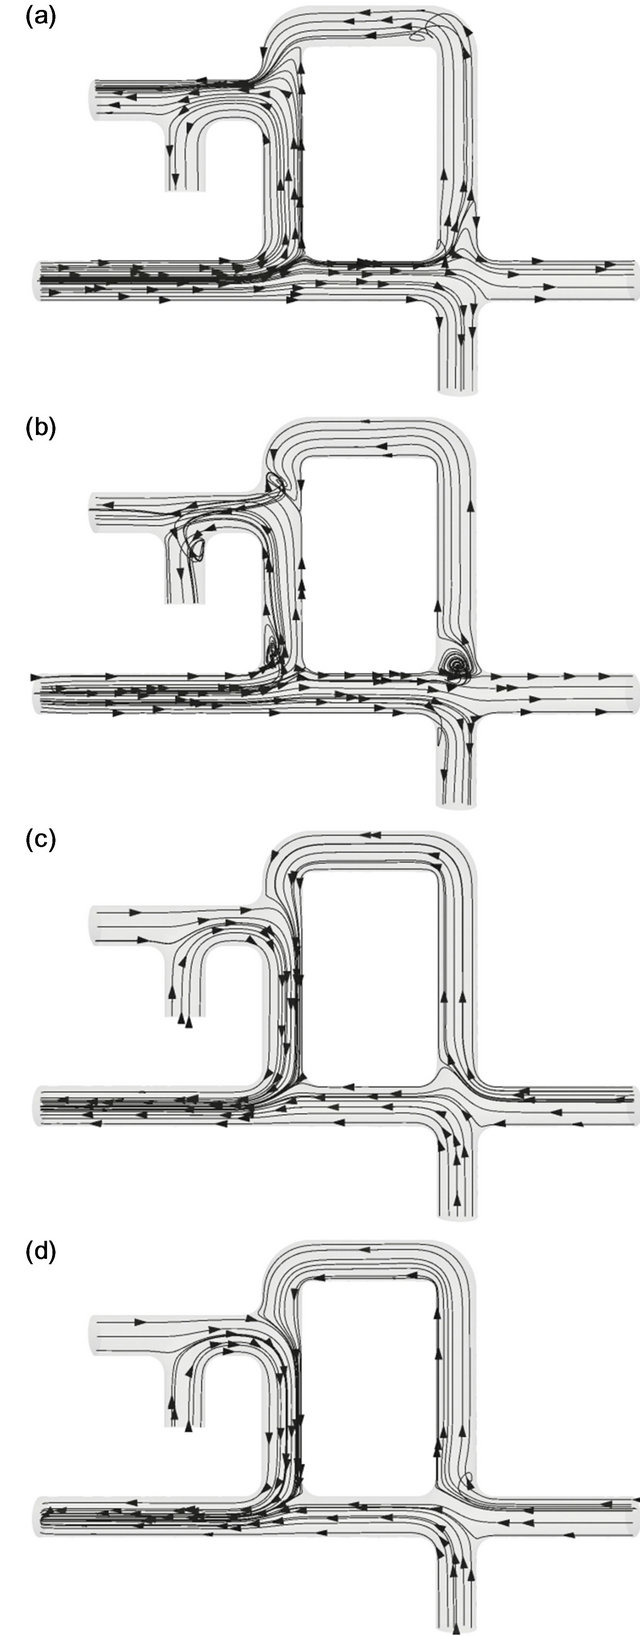
Figure 6. Streamlines in the avian lung at C = 10. (a) t/T = 1/8, (b) t/T = 3/8, (c) t/T = 5/8, (d) t/T = 7/8.
blocking the upwardly directed airflow (Figure 6(b)). During the deceleration phase of expiration, no vortices were observed (Figure 6(d)).
3.2. Flow in the Parabronchi
The time variation of the flow rate at the cross-section (x = 36.45 mm) of the parabronchi is shown in Figure 7. The horizontal axis represents the phase in the respiratory cycle. A positive flow rate value is defined for the air flowing from the posterior to the anterior side (the negative direction on the x-axis). For C = 1, the flow rate was negative during part of the inspiration phase and positive during the rest of the cycle. This means that the flow in the parabronchi was bidirectional for C = 1. Bidirectional flow was observed for C = 0.5 and 100 as well, although there was almost no negative flow for C = 100. In contrast, the flow in the parabronchi was always positive and thus unidirectional for C = 0.01 and 10. It was also found that the phase when the flow rate reached a maximum shifted to the expiration phase as the compliance of the air sacs increased.
3.3. Effects of Air Sac Compliance on the Generation of Unidirectional Flow in the Parabronchi
The total volumes of the positive flow V+ and the negative flow V− passing through the parabronchi over one respiratory cycle were calculated. The ratio of V+ to V− is plotted against the compliance of the air sacs in Figure 8. As V−/V+ approaches zero, the unidirectional nature of flow in the parabronchi becomes stronger. As in Figure 8, V−/V+ was zero for the low compliances C = 0.01 and 0.1 and for the high compliances C = 8, 10 and 50. The value of V−/V+ was the largest for C = 0.5, and decreased as the compliance became either smaller or larger. For C
= 5 and 100, V−/V+ was not zero but was nevertheless quite small compared with that at C = 1.
3.4. Time Variation of a Pressure in Each Air Sac
Pressures at the cross-section A-D or the air sacs are plotted as a function of time in Figure 9. Figures 9 (a)- (e) represent the data obtained for compliances of 0.01, 0.5, 1, 10 and 100, respectively. As seen in Figure 9, the
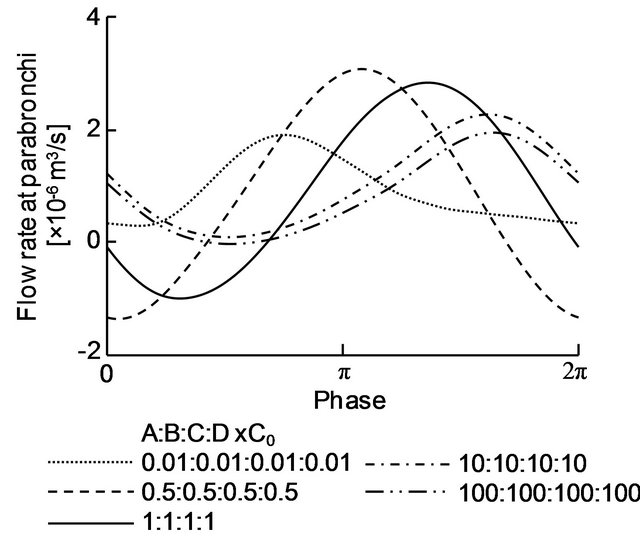
Figure 7. Temporal variation of the flow in the parabronchi.
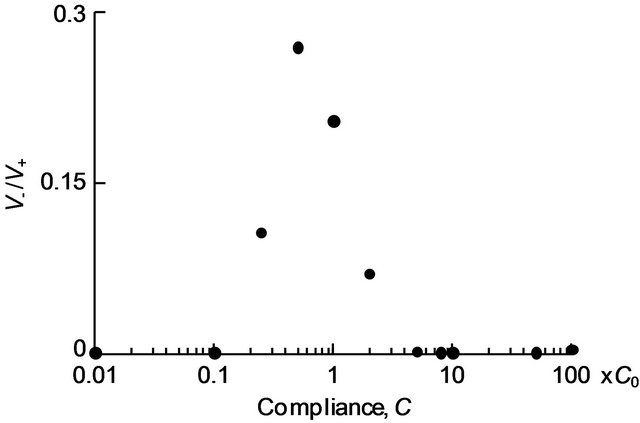
Figure 8. Plot of the ratio V−/V+ against air sac compliance.
range of the pressure in the air sacs decreased as their compliances decreased. For C = 0.01, the curves appear to virtually overlap (Figure 9(a)). However, magnified views of the pressure curves revealed that the pressures in the posterior air sacs (C and D) were larger than those in the anterior airs sacs (A and B) during inspiration. During expiration, the pressure relation inverted, demonstrating larger pressure in the anterior air sacs. Figures 9(b) and (c) show a slightly different trend from Figure 9(a). At C = 1, the pressures in the posterior air sacs were larger than those in the anterior airs sacs during the deceleration phase of inspiration and the acceleration phase of expiration. For larger compliances (Figures 9(d) and (e)), the pressures in the abdominal air sac, D, were always larger than those in the anterior air sacs A and B throughout the respiratory cycle. For C = (a) 0.01, (d) 10 and (e) 100, the pressure in the air sacs became maximal at the phase π, corresponding to the turning point from inspiration to expiration.
3.5. Time Variation of a Pressure Difference over the Parabronchi
The pressure at the cross-section of the parabronchi at x = 31.4 mm and that at x = 42.0 mm were spatially averaged for each time and defined as Pante and Ppost, respectively. The time variations of the pressure difference Ppost − Pante for C = 0.01, 0.5, 1, 10 and 100 are plotted in Figure 10. For C = 0.5 and 1, the absolute value of the negative maximum pressure difference was almost the same as that of the positive maximum pressure difference. In addition, the length of time during which the pressure difference was negative was equivalent to that for the positive pressure difference. In contrast, for C = 0.01 and 10, the absolute values of the negative maximum pressure differences were smaller than those of the positive maximum pressure differences, and the length of time for the negative pressure difference was shorter than that for the positive pressure difference.
Figure 9. Time variation of the pressure in air sacs A-D. (a) C = 0.01, (b) C = 0.5, (c) C = 1, (d) C = 10, (e) C = 1009.
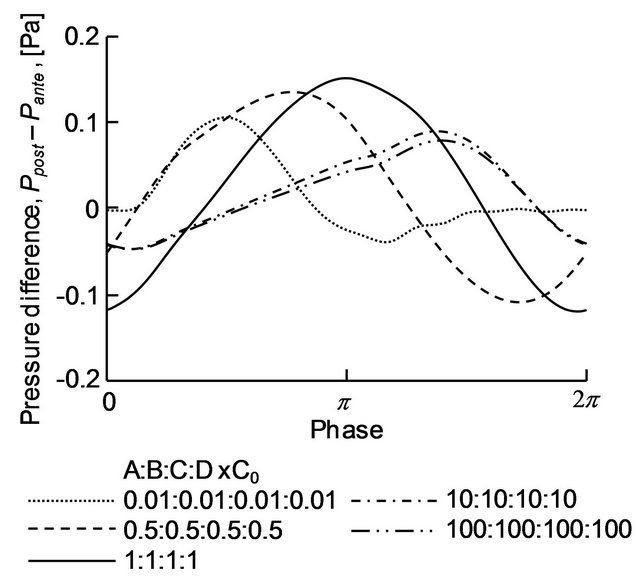
Figure 10. Time variation of the pressure difference over the parabronchi.
4. DISCUSSION
In the present study, an avian respiratory flow was simulated using an anatomically simplified model of avian lung. The obtained flow patterns in Figures 4-6 demonstrated that during inspiration, the main stream of inflow was lead to the posterior air sacs. During expiration, the air stocked in the anterior air sacs was directed to the primary bronchi while air in the posterior air sacs went to the parabronchi. In some conditions, flow in the parabronchi was unidirectional throughout a respiratory cycle. Such features of the main flow are consistent with the ones in a real avian lung [3-5,20,38,39]. It is generally considered that in real birds air barely flows in the ventrobronchi during inspiration and in mesobronchi during expiration [5,8,10,11,20,38,39]. In contrast, here we observed not a little amount of flow in the ventrobronchi during inspiration and in mesobronchi during expiration. This is attributable to smaller contributions of aerodynamic valving caused by vortices and flow separations due to simplification of the geometry of the avian lung and the absence of segmentum accelerans as discussed in the following paragraphs. Although a quantitative comparison with previous studies to validate the results is difficult due to differences in various conditions including geometry, these results indicated that the model represented main characteristics of avian respiratory flow such as unidirectional flow in the parabronchi.
As shown in Figures 4-6, the flow direction in the parabronchi varied, depending upon the compliance of the air sacs. Figure 8 demonstrates that the achievement of unidirectional flow in the parabronchi was bimodal for small compliances (C = 0.01 and 0.1) and large compliances (C = 8, 10 and 50). By examining at Figure 9, we found that for those cases, the pressure fluctuations in all air sacs were in phase, whereas they were out of phase for the conditions under which the flow in the parabronchi was not unidirectional. According to Cohn and Shannon [40], such synchronization of the pressure in phase is a feature of the real avian lung. These data suggest that phase-synchronization of the pressure fluctuations in air sacs would be one of the necessary conditions to accomplish unidirectional flow in the parabronchi.
Figures 7, 8 and 10 demonstrate that the trend in pressure difference over the parabronchi differed between unidirectional (C = 0.01, 0.1, 8, 10 and 50) and bidirectional (C = 0.25, 0.5, 1, 2, 5 and 100) flow in the parabronchi. For the former case, the absolute value of the negative maximum pressure difference was smaller than that of the positive maximum pressure difference. In contrast, for the latter case, the absolute value of the positive maximum pressure difference was almost equal to that of the negative maximum pressure difference, and the time for the positive pressure difference was as long as that for the negative pressure difference. On the basis of these results, the driving mechanism for air flow in the parabronchi may be explained as follows. As the positive pressure difference over the parabronchi increases, air flow is driven from the dorsobronchi to the ventrobronchi. Once created, the convective inertial force acts to maintain this flow, even if the pressure difference becomes zero or even negative. Therefore, as long the negative pressure difference over the parabronchi was of short duration or the magnitude of the negative pressure was small, unidirectional flow was achieved in the parabrochi. On the contrary, a reverse flow from the anterior to the posterior side arose if the pressure difference over the parabronchi tended largely towards being negative for a long time.
It was reported that some birds have a narrowing, termed the segmentum accelerans, in the primary bronchus, just cranial to ventrobronchial junction [8,9]. This narrowing is believed to increase convective inertia of inhaled air, thereby directing the inhaled air to the mesobronchi [8,10-12]. In addition, the narrowing causes flow separation at the ventrobronchial junction, which produces vortices near the origin of the ventrobronchi. The vortices formed impede the inhaled air flowing to the ventrobronchi and helps it head towards the mesobronchi [13-15]. These two factors work as aerodynamic valves to direct the inhaled air to the mesobronchi and thereby facilitate the unidirectional flow in the parabronchi throughout the respiratory cycle [8,10-15]. The present model does not possess the narrowing at the primary bronchi. Consequently, inhaled air passing through the primary bronchi was not accelerated to the extent that part of the flow was directed to the ventrobronchi, as seen in Figures 4-6. Moreover, the vortices formed near the origin of the ventrobronchi did not develop significantly, because of absence of the narrowing. If a narrowing was established in the primary bronchus just cranial to the ventrobronchial junction, the inhaled air was more prone to flow to the mesobronchi and subsequently into the posterior air sacs. As a result, it is expected that a pressure difference between the posterior and anterior air sacs becomes larger, thereby achieving unidirectional flow in the parabronchi more easily.
The present study has some limitations. First, the model geometry was an anatomically simplified avian lung and differed from the real lung in the number of bronchi, their angulation, and their diameters [1,2,32,33]. However, the simplification was necessary because of the both limited availability of detailed anatomical information and limited computational resources. In fact, similar geometrical simplifications for flow analyses have been used in many studies, and they successfully captured macroscopic flow characteristics in the avian lung [5,10,12]. In this sense, the usage of the geometrically simplified model would be allowed as far as we discuss only the main features of the flow. Second, mechanical parameters such as flow rates were taken from various species of birds. Thus, the simulation here was a kind of “chimeric” analysis, although we attempted to use data from species with similar body sizes, as far as possible. Third, the model for expressing the mechanics of air sacs to determine the pressure boundary did not take account of intra-thoracic pressure and the elasticity of the air sacs. Here, we imposed an inlet flow condition regardless of the air sac compliance, meaning that breathing was involuntary. Inspiration and expiration should be driven by the intra-thoracic pressure or the transmural pressure over the air sacs. Another problem when modeling the air sacs is the use of a constant compliance value throughout the respiratory cycle. In reality, compliance varies with a change in air sac volume [37,41]. Notwithstanding these limitations, this preliminary study addressed the importance of air sac compliance in avian respiratory function, thereby suggesting that air sac compliance in the avian lung is optimized for each species to achieve unidirectional flow in the parabronchi. In future studies, we will address the shortcomings listed above by including more realistic geometry of the avian lung using magnetic resonance imaging and computed tomography and establishing a realistic respiratory system by incorporating a change in intra-thoracic pressure and air sac elasticity for quantitative analysis of the compliance of avian air sacs.
5. CONCLUSION
In this study, we examined the effects of air sac compliance on flow in the parabrochi using a geometrically simplified model of an avian respiratory system. The results demonstrate that air sac compliance has a significant impact on flow patterns, including vortex formation, in the lung. Differences in compliance also cause changes in the pressures in the anterior and posterior air sacs and thus the pressure difference between them that drives the flow in the parabronchi. Consequently, it was found that achievement of unidirectional flow in the parabronchi is affected by air sac compliance. These results suggest that air sac compliance would be optimized to accomplish unidirectional flow in the parabronchi.
REFERENCES
- Akester, A. (1960) The comparative anatomy of the respiratory pathways in the domestic fowl (Gallus domesticus), pigeon (Columba livia) and domestic duck (Anas platyrhyncha). Journal of Anatomy, 4, 487-505.
- King, A.S. (1966) Structural and functional aspects of the avian lungs and air sacs. International Review of General and Experimental Zoology, 2, 171-267.
- Fedde, M.R. (1998) Relationship of structure and function of the avian respiratory system to disease susceptibility. Poultry Science, 77, 1130-1138.
- Scheid, P. and Piiper, J. (1971) Direct measurement of the pathway of respired gas in duck lungs. Respiration Physiology, 11, 308-314. doi:10.1016/0034-5687(71)90004-1
- Kuethe, D. (1988) Fluid mechanical valving of air flow in bird lungs. The Journal of Experimental Biology, 136, 1-12.
- Schmidt-Nielsen, K. (2007) Animal physiology: Adaptation and environment. 5th Edition, University of Tokyo Press, Tokyo, 37-42 (in Japanese).
- Tucker, V. (1968) Respiratory physiology of house sparrows in relation to high-altitude flight. The Journal of Experimental Biology, 48, 55-66.
- Wang, N., Banzett, R., Ntions, C. and Jenkins, F. (1992) An aerodynamic valve in the avian primaty bronchus. The Journal of Experimental Zoology, 262, 441-445. doi:10.1002/jez.1402620411
- Maina, J.N. and Africa, M. (2000) Inspiratory aerodynamic valving in the avian lung: Functional morphology of the extrapulmonary primary bronchus. The Journal of Experimental Biology, 203, 2865-2876.
- Wang, N., Banzett, R., Butler, J. and Fredberg, J. (1988) Bird lung models show that convective inertia effects inspiratory aerodynamic valving. Respiration Physiology, 73, 111-124. doi:10.1016/0034-5687(88)90131-4
- Brown, R., Kovacs, C., Butler, J., Wang, N., Lehr, J. and Banzett, R. (1995) The avian lung: Is there an aerodynamic expiratory valve? The Journal of Experimental Biology, 198, 2349-2357.
- Maina, J.N., Singh, P. and Moss, E. (2009) Inspiratory aerodynamic valving occurs in the ostrich, struthio camelus lung: A computational fluid dynamics study under resting unsteady state inhalation. Respiratory Physiology & Neurobiology, 169, 262-270. doi:10.1016/j.resp.2009.09.011
- Sakai, E., Watanabe, T. and Himeno, T. (2005) Oscillatory flow structure and unidirectional flow in model avian bifurcation. Transactions of the Japan Society of Mechanical Engineers Series B, 71, 2083-2091 (in Japanese).
- Sakai, E., Watanabe, T. and Himeno, T. (2006) Numerical study on mass transport enhancement in oscillatory flow of avian lung model. Transactions of the Japan Society of Mechanical Engineers Series B, 72, 72-80 (in Japanese).
- Sakai, E., Watanabe, T. and Himeno, T. (2010) Numerical study on oscillatory flow in multi-bifurcation of avian lung model. Transactions of the Japan Society of Mechanical Engineers Series B, 76, 86-93 (in Japanese).
- Brackenbury, J. (1972) Lung-air-sac anatomy and respiratory pressures in the bird. The Journal of Experimental Biology, 57, 543-550.
- Brackenbury, J., Darby, C. and El-Sayed, M. (1989) Respiratory function in exercising fowl following occlusion of the thoracic sir sacs. The Journal of Experimental Biology, 145, 227-237.
- Brackenbury, J. and Amaku, J. (1990) Respiratory responses of domestic fowl to hyperthermia following selective air sac occlusions. Experimental Physiology, 75, 391-400.
- Gilbert, P.W. (1939) The avian lung and air-sac system. The Auk, 56, 57-63. doi:10.2307/4078361
- Scheid, P. and Piiper, J. (1989) Respiratory mechanics and air flow in birds. In: King, A.S. and McLelland, J., Eds., Form and Function in Birds, Academic Press, London, 369-391.
- Russel, S.M. (2003) The effect of airsacculitis on bird weights, uniformity, fecal contamination, processing errors, and populations of Campylobacter spp. and Escherichia coli. Poultry Science, 82, 1326-1331.
- Fletcher, O.J., Anderson, D.P. and Kleven, S.H. (1976) Histology of air sac lesions induced in chickens by contact exposure to Mycoplasma synoviae. Veterinary Pathology, 13, 303-314.
- Fletcher, O.J., Fairchild, S.E., Smith, F.G. and Trampel, D.P. (1984) Microcomputer-assisted morphometric analysis of airsacculitis caused by Mycoplasma gallisepticum in immunised and nonimmunised chickens. Avian Pathology, 13, 545-560. doi:10.1080/03079458408418554
- Ficken, M.D. and Barnes, H.J. (1989) Acute airsacculitis in turkeys inoculated with Pasteurella multocida. Veterinary Pathology, 26, 231-237. doi:10.1177/030098588902600307
- Yokota, T., Shibahara, T., Wada, Y., Hiraki, R., Ishikawa, Y. and Kadota, K. (2004) Aspergillus fumigatus infection in an ostrich (Struthio camelus). The Journal of Veterinary Medical Science, 66, 201-204. doi:10.1292/jvms.66.201
- Shankar, B.P. (2008) Common respiratory diseases of poultry. Veterinary World, 7, 217-219.
- McLelland, J. (1991) A color atlas of avian anatomy. Saunders Co., Philadelphia, 95-119.
- Maina, J.N. (2005) The lung air-sac system of birds: Development, structure and function. Springer, Heidelberg.
- Maina, J.N. (2007) Spectacularly robust! Tensegrity principle explains the mechanical strength of the avian lung. Respiratory Physiology & Neurobiology, 155, 1-10. doi:10.1016/j.resp.2006.05.005
- West, J., Watson, R. and Fu, Z. (2007) The human lung: Did evolution get it wrong? European Respiratory Journal, 29, 11-17. doi:10.1183/09031936.00133306
- Jones, J.H., Effmann, E.L. and Schmidt-Nielsen, K. (1985) Lung volume changes during respiration in ducks. Espiratory Physiology, 59, 15-25.
- Makanya, A. and Djonv, V. (2008) Development and spatial organization of the air conduits in the lung of the domestic fowl, Gallus gallus variant domesticus. Microscopy Research and Technique, 71, 689-702. doi:10.1002/jemt.20608
- Onuk, B., Hazitoglu, M. and Kabak, M. (2009) Gross anatomy of the respiratory system in goose (Anser anser domesticus): Bronchi and sacci pneumatici. Ankara Universitesi Veteriner Fakultesi Dergisi, 56, 165-170.
- OpenFOAM User Guide (2011) Version 2.0.0.
- Calder, W. and Schmidt-Nielsen, K. (1967) Temperature regulation and evaporation in the pigeon and the roadrunner. American Journal of Physiology, 213, 883-889.
- Womersley, J.R. (1955) Method for the calculation of velocity, rate of flow and viscous drag in arteries when the pressure gradient is known. The Journal of Physiology, 127, 553-563.
- Scheid, P. and Piiper, J. (1969) Volume, ventilation and compliance of the respiratory system in the domestic fowl. Respiration Physiology, 6, 298-308. doi:10.1016/0034-5687(69)90029-2
- Bouverot, P. and Dejours, P. (1971) Pathway of respired gas in the air sacs-lung apparatus of fowl and ducks. Respiration Physiology, 13, 330-342. doi:10.1016/0034-5687(71)90037-5
- Bretz, W.L. and Schmidt-Nielsen, K. (1972) The movement of gas in the respiratory system of the duck. The Journal of Experimental Biology, 56, 57-65.
- Cohn, J. and Shannon, R. (1968) Respiration in unanesthetized geese. Respiration Physiology, 5, 259-268. doi:10.1016/0034-5687(68)90064-9
- Perry, S.F. and Duncker, H.R. (1980) Interrelationship of static mechanical factors and anatomical structure in lung evolution. Journal of Comparative Physiology B: Biochemical, Systemic, and Environmental Physiology, 138, 321- 334. doi:10.1007/BF00691567
NOTES
*Corresponding author.