Journal of Biomedical Science and Engineering
Vol.6 No.6(2013), Article ID:33696,14 pages DOI:10.4236/jbise.2013.66082
Multivariate and wavelet techniques of spontaneous electroencephalography and event related potentials during children maturation. The role of phase resetting
![]()
Human Psychobiology Laboratory, Department of Experimental Psychology, University of Seville, Seville, Spain
Email: cbarriga@us.es
Copyright © 2013 Catarina I. Barriga-Paulino et al. This is an open access article distributed under the Creative Commons Attribution License, which permits unrestricted use, distribution, and reproduction in any medium, provided the original work is properly cited.
Received 8 April 2013; revised 16 May 2013; accepted 28 May 2013
Keywords: Cerebral Maturation; Late Positive Component; P300; Delta; Spontaneous EEG
ABSTRACT
The purpose of this study is to analyze whether the maturation of spontaneous EEG occurs at the same rate as Late Positive Component (LPC) maturation. To that end, the spontaneous EEG rhythms power spectral density (PSD) and the LPC component in a group of children and a group of young adults were obtained and analyzed by means of Spearman’s correlation coefficients, hierarchical clustering, Principal Component Analysis (PCA) and topographical analysis. The multivariate analysis revealed a co-maturation of LPC with the delta band. This co-maturation was more evident in the more posterior region. The multivariate analysis results suggest that the maturation of the two components is temporally closely associated. The LPC in both children and young adults was produced by a combination of increase of Event Related Spectral Perturbation (ERSP) and phase resetting in the delta band. It can be suggested that the maturations of delta and LPC are functionally interdependent due to a possible origin of LPC as a delta phase resetting and/or because both processes depend on the same fraction of synaptic pruning.
1. INTRODUCTION
The relationship of slow wave maturation and P300 components during maturation, particularly in early childhood, has never been explored. The brain rhythms are produced by the spontaneous activity of neural networks throughout the lifespan. With increasing age, from childhood to adulthood, the lower frequency bands (delta and theta) decrease, and the higher frequency bands (alpha and beta) increase [1-3]. The increase in higher frequencies with age only occurs for relative power; in absolute power there is a decrease in high and low frequencies with age.
There are also other neural signals that change during human development, for example, the P300 component, probably the most studied endogenous event-related potential of the brain. The P300 is also related to the LPC, which would refer to posterior positive potentials during cognitive processing. These two related components belong to the family of the late positive waves, which occur at latencies of 250 to 500 ms [4]. In this report we would refer to P300 when explaining scientific literature, because is in P300 in which more of the work on maturation and time-frequency analysis has been done, and our results would be referred to the closely related but less restrictive term of LPC. Most studies have reported a decrease in P300 latency with increasing age from childhood to adulthood [5-9]. With regard to the amplitude, most results also indicate a decrease with age in visual P300. Courchesne et al. [5], using letters and random patterns as stimuli, found a decrease with age in the visual target P300. Thomas and Nelson [8], using faces as stimuli, and Van der Stelt et al. [9], using colour discrimination as the relevant task, found a decrease in P300 amplitude with age to target stimuli. Berman et al. [10] have also reported decreasing amplitude with age in a memory experimental paradigm. Flores et al. [11] also found a decrease with age in target LPC in a valid-invalid central cue Posner’s type experiment. Therefore, the general picture that can be drawn for the developmental trend of the visually induced P300 component is of a decrease in amplitude with age.
The fact that the P300 becomes increasingly affected by slower frequencies (delta and theta) has been pointed out [12]. Intriligator and Polich [13,14] also verified that spectral power and mean frequency were generally positively correlated with P300 amplitude and peak latency, primarily in the slower EEG bands. These authors found that the strongest relationships were observed for delta, theta and slower alpha activities, in the eyes open condition.
In a study focusing on the frequency decomposition of the P300, Klimesch, Schimke and Pienert [15] found that, although most of the P300 power lies in the delta range, latency and amplitude measures were significantly influenced by the theta band [12]. Digiacomo et al. [16] also found a positive correlation between the late positive component and the theta band, although in the latter study the delta band was not explored. In addition, positive associations between pre-stimulus theta and alpha band spectral power and P300 amplitude have been reported [4,17-20].
However, according to Verleger [21], the main portion of P300 power lies in the sub-delta and delta bands. He showed that most of the P300 power is due to EEG delta activity; the amplitude of the P300 response increases when single trials with high enhancement in the delta range (1 - 3.5 Hz) are averaged. These results are also supported by Digiacomo et al. [22] using wavelets. These authors observed that the topography of the phase resetting, measured as a high Inter-Trial Coherence (ITC) of the P300 time window in the delta range, lies in posterior sites, suggesting that the P300 component is partially constructed by the phase resetting of delta waves.
The possibility that the P300 component amplitude is, in fact, related to individual variability was explored [13, 14]. They found a positive relationship between delta, theta and low alpha power with P300 amplitude. Polich [19] also showed a parallel decrease in spontaneous delta and theta power in visual and auditory P300 with adults increasing in age, from young to late adulthood. Therefore, at least from correlational analysis, it is possible to observe a positive relation between P300 amplitude in adults (in baseline and in spontaneous EEG) and low frequency components, suggesting that both low frequency and P300 components would share physiological mechanisms. However, if the same relationship exists during child development is not established.
The present report is concerned with the relation between LPC and frequency bands during development. In this sense, this study must be considered a cross-analysis of the data presented in previous reports [1,11], and only the results which show a relationship between frequency bands in spontaneous EEG and LPC induced by visual stimulation will be reported. We think this approach can be useful for adding information about the interdependency of these two types of EEG parameters during development.
Both the EEG rhythms and the LPC component have been described as changing with age. The goal of the present report is to explore whether there is a co-maturation of the LPC component and brain rhythms and to suggest its possible relationship with phase resetting, ERSP and cortical pruning. A positive association between EEG and LPC parameters would be interpreted as a consequence of a common independent cause, i.e. synaptic pruning, or a functional relationship between LPC amplitude from a more basic phenomenon, such as low frequency brain rhythms phase resetting. The interdependence between these two types of phenomena would be explored by means of multivariate techniques. The broad variability between children and young adults in brain rhythms and LPC amplitude would allow the use of multivariate techniques to explore the co-variation pattern of these neurophysiological variables. The possibility that co-maturation would be due to phase resetting and ERSP in the delta range induced by the stimuli would be explored by means of time-frequency analysis.
The present results are not only the results of the authors but of many anonymous reviewers in different editorial settings which have contributed to the actual format. Although the empirical results has already been published [1,11] , we still think it is worthy to cross data to obtain new and unsuspected results.
The first part of the report would concentrate in establishing by multivariate techniques the co-maturation of LPC and brain rhythms. Then this range would be selected for trying to explain the LPC during development by a combination of a spatial filter provided by ITC on the pre-target oscillations, and by the increase of ERSP induced by the target stimulus.
2. EXPERIMENTAL PROCEDURES
2.1. Subjects
Data from eighteen children (12 female, 16 right-handed) aged 8 - 13 years (mean age: 10.06 ± 1.43) and twenty young adults (12 female, 20 right-handed) aged 18 - 23 years (mean age: 20.56 ± 1.3) were recorded and analyzed in this study. Experiments were conducted with the informed and written consent of each participant (parents/ tutors in the case of the children), following the Helsinki protocol.
2.2. Electrophysiological Recording
Three minutes of spontaneous EEG with open eyes and the EEG during the stimuli presentation phase were recorded from 20 scalp sites of the International 10 - 20 system (Fp1, Fp2, F3, F4, F7, F8, Fz, FCz, T7, T8, C3, C4, Cz, P7, P8, P3, P4, Pz, O1, O2), using tin electrodes mounted on an electrode cap (EASYCAP, HerrschingBreitbrunn, Germany) with two additional electrodes (M1, M2). Ocular movements (EOG) were recorded from two electrodes at the outer canthus of each eye for horizontal movements and one electrode under the left eye for vertical movements that was referred to FP1. The EEG was recorded with an average reference. All the scalp electrodes were referred to the mastoid average (M1 + M2/2). Impedance was maintained below 10 KΏ. Data were recorded in DC at 512 Hz, with a 20,000 amplification gain using a commercial AD acquisition and analysis board (ANT).
2.3. Stimuli Paradigm
After the recording of the spontaneous EEG, The Event Related Potentials (ERPs) during a visual central cue Posner paradigm were obtained [11]. The stimulus presentation was computer-controlled by the software EEVOKE (ANT, Enschede, The Netherlands). Participants were seated 0.50 m. away from a computer screen. A white fixation square was on during the whole experiment. The complete trial period included a central directional cue (S1) lasting 300 ms, an attentive waiting period of 1360 ms, and a subsequent peripheral target (S2) lasting 300 ms and subtending a visual angle of 4.56˚ situated 3.66˚ eccentrically in the horizontal meridian (Figure 1 from [11]). The targets were squared cartoon figures. A different figure was presented in each block of trials. The whole experiment consisted of 240 trials divided into 5 blocks, with an inter-trial interval of 1860ms, including 10 training trials. Since the central cue could indicate the correct or incorrect direction of the target’s appearance, two different conditions arose: validly cued targets (VC) (82.1% of trials) and invalidly cued targets (IC) (17.9% of trials). The subjects used the index finger of the right hand to respond to right-side targets by pressing a joystick button and, correspondingly, the index finger of the left hand to respond to left-side targets. During this task, the EEG was recorded using the same parameters as for the spontaneous EEG.
3. DATA ANALYSIS
3.1. Recording Processing and Analysis
A 0.1 Hz high-pass filter and a 20 Hz low-pass filter (zero phase shift type, low cut-off of 6 db/octava, high cut-off of 48 db/octava) were applied to the recordings. The artefacts in the resulting EEG recordings were corrected by an artefact correction protocol. The algorithm used for the artefact correction was based on PCA (BESA software). This method splits the EEG components associated with cerebral activity from artefacts (ocular movements, muscular or cardiac activity), on the basis of spatial distribution, after which the EEG can be reconstructed free of artefacts [23].
After the correction of artefacts, an artefact rejection protocol was applied. All the epochs for which the EEG exceeded ±100 μV in any channel were automatically discarded.
The Fast Fourier Transform (FFT) algorithm (BESA software) was applied to time domain data to convert them into the frequency domain. The FFT was applied to 2-second epochs. The FFT algorithm implemented in the BESA software was applied to time domain data to convert them into the frequency domain using a cosine square window, and no overlapping between epochs occurred. The PSD was computed in windows of 2 seconds (including 1024 sampling points), and then averaged for each individual subject. The PSD data were exported for each subject and electrode, and four frequency bands were defined: Delta (1 - 4 Hz), Theta (5 - 8 Hz), Alpha (9 - 12 Hz) and Beta (14 - 19 Hz). The statistical analysis of the comparison of the different frequency bands in children and young adults has been described elsewhere and will not be described here [1].
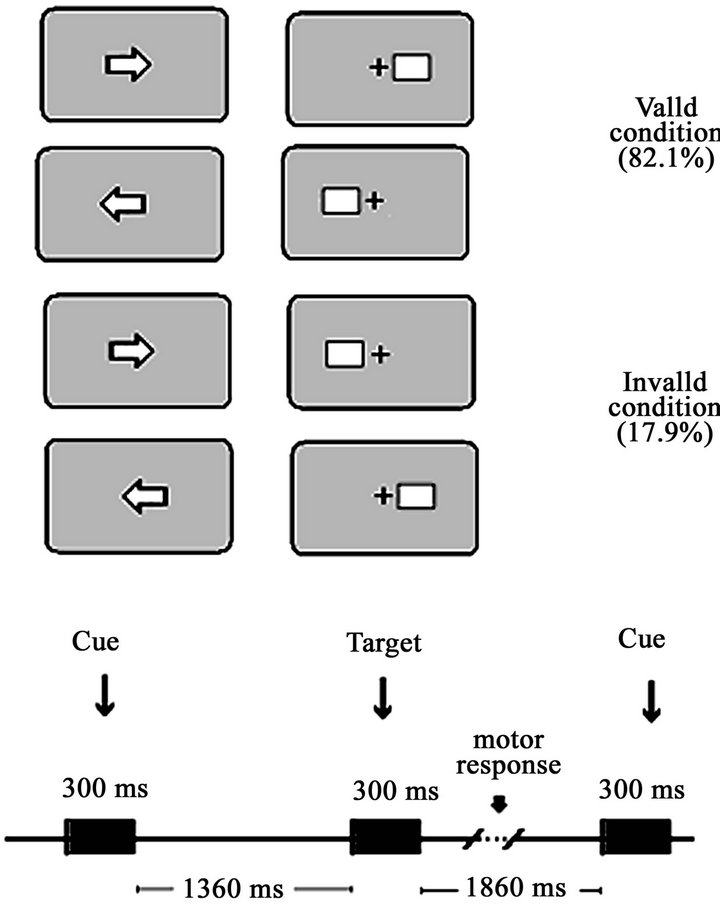
Figure 1. Central cue Posner paradigm performed in the study by Flores et al. (2010). The experimental paradigm comprised two conditions: valid and invalid. In the valid condition, the cue indicates the spatial position in which the target appears. In the invalid condition, the target appears on the opposite side to the cued location. The temporal contingencies of the different stimuli of the trial are displayed in the bottom part of the figure. The percentage of valid and invalid trials appears in parentheses.
The LPC component was obtained by averaging the EEG using the target stimuli as trigger. For the LPC amplitude, the mean voltage was analyzed in two conditions: valid and invalid trials. The average amplitude of the LPC was measured for both groups (children and young adults) in the 340 - 440 ms time-window for all the recorded electrodes. The LPC amplitudes were obtained in the valid and invalid trials in children and young adults. The continuous EEG was divided into epochs of 1200 ms; all epochs were aligned to a baseline from −200 to 0 ms preceding the target stimulus (S2) and 1000 ms poststimulus. ERPs were obtained for each subject by averaging the EEG, using the switching on of the target as a trigger. The average amplitude was measured for both groups in a posterior late positivity (possible P3b, and conceptualized in the broader concept of P300) in the 340 - 440 ms time-window (see [11] for more details).
3.2. Spearman’s Correlation Coefficients, Principal Component Analysis, Hierarchical Clustering and Topographical Analysis
Several techniques were performed to analyze whether the maturation of the spontaneous EEG is related to the LPC component maturation. The first method used was Spearman’s correlation. We correlated the spectral power of the three regions in the four frequency bands with the LPC in the valid and invalid conditions. In this report we are not interested in the cross-frequency correlation pattern, and, therefore, it will not be described here (see [1] for a full description of this aspect). We concentrated in the pattern of correlations between the different frequency bands and the LPC component. The two-tailed statistical significance of the Spearman’s correlation coefficients was obtained taken in account the number of subjects.
Afterwards, we used PCA, which identifies latent components that explain the variance in the experimental data [24]. The PCA was computed using SPSS 18.0. PCA was applied to the data matrix obtained from collapsing different electrodes. The electrodes Fp1, Fp2, F7, F3, Fz, F4 and F8 for the frontal region, FCz, T7, C3, Cz, C4 and T8 for the central region, and P7, P3, Pz, P4, P8, O1 and O2 for the posterior region were collapsed. We applied this procedure to the valid and invalid LPC and to the different brain rhythms. Finally, a matrix of 38 subjects by 18 variables (4 bands × 3 regions + 3 regions of LPC valid cues + 3 regions of LPC invalid cues) was analyzed. We computed this collapse in order to have more subjects than variables. Non-rotated PCA using the correlational matrix was used. The final data matrix had 38 subjects (rows) and 18 empirical variables (columns), including delta, theta, alpha, beta and LPC in valid and invalid locations. This method allows to express the total variance of the data in a few components which can easily be identified as a source of variance in the empirical data. In this particular data set it would allow to relate which components explain simultaneously the LPC and frequency bands variance. The explained variance of each extracted component was represented in order to evaluate how important was each extracted component in explaining the total data variance (Scree Test). In order to establish the physiological meaning of each component the loading factors of each empirical variable for components 1 - 10 was represented. As the loading factors are the correlation coefficient between a given empirical variable and the factorial scores of a given component, the two-tailed statistical significance of the loading factors was estimated taken in account the number of subjects (N = 38 for the total sample).
Additionally, a hierarchical clustering was applied to the standardized data. This method, by means of computing the Euclidean distance of empirical variables in the subject’s space (the converse can be used for classifying subjects in the variable space), makes it possible to classify the variables by their proximity in this space. The result is presented as a dendrogram providing different levels of aggregation. This analysis would give additional support to the pattern of co-variation revealed by the PCA and correlational analysis.
Finally, we represented the topographical maps of the bands and the LPC in both conditions in order to observe possible similarities between LPC and frequency bands. The topography should provide additional support for the co-maturation argument.
3.3. Time Frequency Analysis: Event Related Spectral Power Modulation and Inter-Trial Phase Coherence Analysis
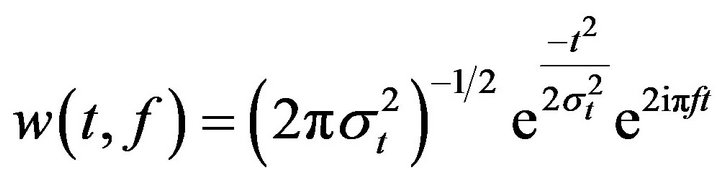
To study time-frequency dynamics of the electrical activity elicited by the invalid and valid targets, single trials (from 1 second before target and 1 second after target) were convoluted time locked to the target stimuli using a complex Morlet wavelet:
 (1)
(1)
The relation  (where
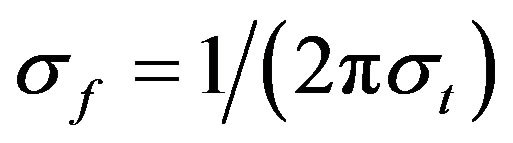 ) was set to 6.7 [25].
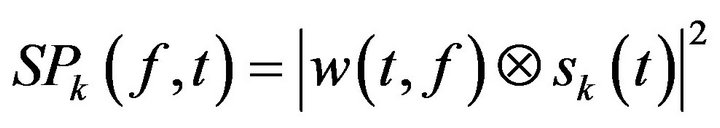
Changes in time varying energy (square of the convolution between wavelet and signal) in the studied frequencies (from 1 Hz to 40 Hz; linear increase) were computed for each trial
 (2)
(2)
(where  is the EEG signal at the kth trial, | | represents the complex norm and
  is the complex convolution). ERSP modulations (increase or decrease of power respect to baseline) was analyzed in relation to averaged spectral power in the baseline period of 0.2 s before the target stimulus S2 after averaging the spectral power of all trials
  as:
as:
 (3)
(3)
In addition, the ITC was also computed to study the degree of coincidence of the phase of the different trials:
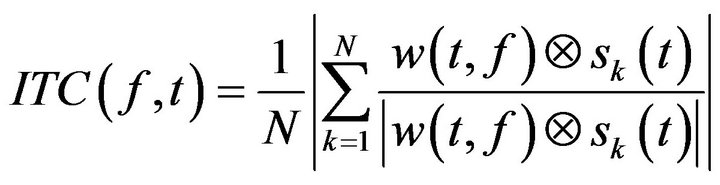 (4)
(4)
being N the total number of trials. Time frequency computation where performed under Matlab© 10 (Mathworks, Natick, MA).
For both ERSP and ITC the mean value in the time window of 200 - 400 ms, in the 2 - 3 Hz frequency range in which delta oscillations presented maximal ITC and post-target ERSP-PT was computed. The statistical analysis was computed between the ERSP-PT and ITC with respect to baseline in this time period and frequency range by means of t-test in three selected electrodes in which LPC presents a maximal amplitude: P3, P4 and Pz. Previously, the normality of the ERSP and ITC of children and young adults was demonstrated by means of the Kolmogorov-Smirnov goodness of fit test.
Spearman’s correlations of LPC amplitude vs. the delta range for the spontaneous power, non-normalized ERSP in baseline (ERSP-BL), ERSP-PT (200-400 ms post-target), ITC, ERSP-BL multiplied by ITC, and spontaneous delta * ITC were computed and expressed in a topographical map. These correlations expressed in topographical maps would provide an idea about the contribution of those parameters to the LPC formation. These parameters were also correlated with age for obtaining information about maturational trends.
3.4. Modeling of the Late Positive Component
As the hypothesis of present analysis was that the LPC is constructed by a combination of phase resetting of delta oscillations in baseline and an increase of ERSP induced by the target, the amplitude of the LPC component in each electrode was modeled by a multiple regression model (the frequency range used was 2 - 3 Hz).
 (5)
(5)
LPC_AMPi: Amplitude of the Late Positive Component in electrode i C1i and C2i: Linear slope coefficients obtained by the multiple regression in electrode i DeltaERSP_BLi: Event Related Spectral Perturbation during Baseline (–200 to 0 ms) in electrode i in delta range (2-4 Hz)
ITCi = Intertrial Coherence in electrode i ERSPi-PT = Post-target Event Related Spectral Perturbation (200 to 400 ms) in the delta range.
The statistical significance of the model and the predicted values of the model were expressed also topographically.
4. RESULTS
4.1. Co-Maturation of Late Positive Component and Brain Rhythms
We only analyzed the latencies of the late positivity (P3b) because the children did not present statistically significant anterior positivity (P3a) in a central cue Posner paradigm (Figure 1 from [11]).
Figure 2(a) shows the PSD of the spontaneous EEG activity. Children presented more power spectral density in all frequency bands (Figure 2(a)). These age-related differences were statistically significant and have been described elsewhere [1]. Regarding the LPC amplitude in the valid and invalid cue conditions, the children presented negative voltages in the frontal electrodes (Fz and FCz) and positive voltages in the posterior ones (Pz and Oz). In young adults there were no negative voltages in the frontal electrodes like those observed in children; however, the young adults showed high amplitude in the
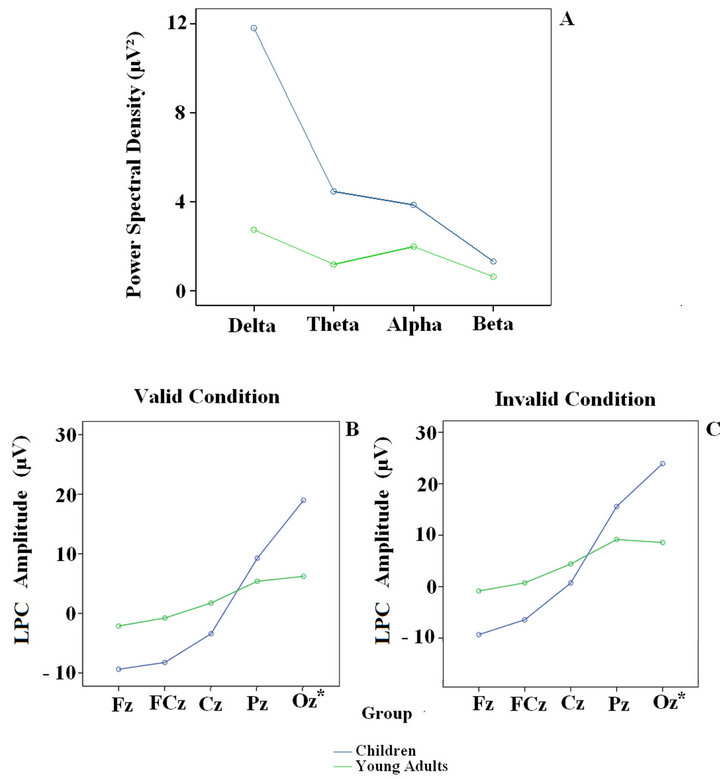
Figure 2. Power Spectral Density of the eyes open spontaneous EEG in the four frequency bands (above) and LPC amplitude for the central electrodes (Fz, FCz, Cz, Pz and Oz) in the valid and invalid conditions (below) in children and young adults. The Oz is a virtual electrode; it was calculated by averaging O1 and O2.
posterior region (Figures 2(b) and (c)). Age-related modulation of the spontaneous EEG and the LPC component had already been reported [1,11]. The general pattern consists in a decrease in power of all frequency bands and LPC amplitude in all frequency bands.
In the Spearman’s correlation matrix of the total sample (Figure 3), which analyzes the relationship between the three regions (frontal, central, posterior) of the four frequency bands and the three regions of valid and invalid LPC, high positive correlations between delta and theta band and the posterior region of LPC were found (marked in red), and high negative correlations in the anterior region (marked in blue) for the total sample. In addition, less systematic correlations were obtained between LPC and alpha and beta.
When the total sample was split and analyzed the two subjects sub-samples separately, the correlation matrix for the children and young adults showed a much lower pattern of correlation (Figure 4), given the loss of variability when the two groups are segregated. However, the correlation pattern of an inverse relationship between delta and LPC was maintained in children. This pattern was almost completely lost in young adults.
Figure 5 shows the topographical distribution of the EEG bands and the LPC in children and young adults. The topographical maps show that the most similar topography between LPC and brain rhythms is with the alpha rhythm. However, it must be pointed out that alpha did not show a co-variation with the LPC component (Figures 3 and 4). Delta presented two foci; one posterior and the other central. The LPC presents a similar
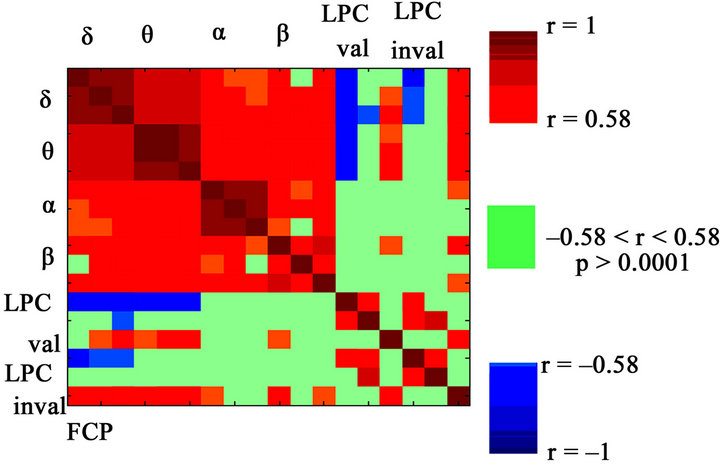
Figure 3. Spearman’s correlation matrix obtained between the three regions: Frontal (F), Central (C) and Posterior (P) of the four frequency bands and the three regions of valid and invalid LPC for the total sample. Positive correlations are shown in red, and negative correlations are shown in blue. The lack of correlation is represented in green, with a significance level of p > 0.0001. Notice the high statistically significant pattern of correlation between the delta band with the LPC component: negative for frontal electrodes and positive for posterior electrodes. LPC also showed a high pattern of correlation with the theta band, however, less than with delta, especially in the frontal electrodes.
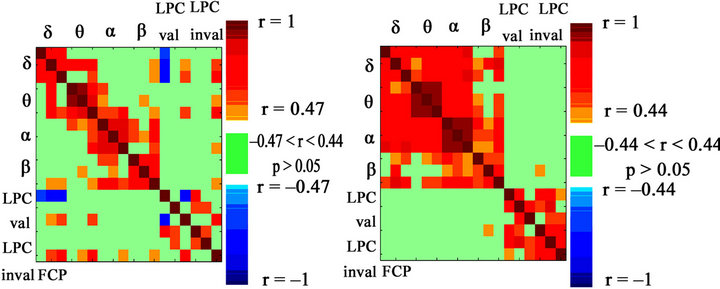
Figure 4. Spearman’s correlation obtained between the three regions: Frontal (F), Central (C) and Posterior (P) of the four frequency bands and the three regions of valid and invalid LPC in children (left) and young adults (right). Notice that the pattern of LPC vs. delta correlations is only maintained in children and is absent for adults. Positive correlations are shown in red, and negative correlations are shown in blue. The lack of correlation is represented in green, with a significance level of p > 0.05.

Figure 5. Topography maps of children (6 maps above) and young adults (6 maps below) for the EEG rhythms and valid/ invalid LPC. Notice that LPC (valid and invalid conditions) and delta overlap in topography in posterior electrodes.
topography with the delta band in the posterior area, which is the area where LPC variables and delta variables covariate (Figures 3 and 4). It can also be observed that the decrease in amplitude of LPC with age is accompanied by a decrease in delta amplitude in posterior sites.
The data matrix was submitted to PCA. The Figure 6 represents the amount of variance explained by each component. This representation can be used as a Scree Test in which the components preceding a change in the slope of the curve are retained. The figure presents two slope’s changes (from components 4 to 5, and from 7 to 8) which suggests that the components 1 - 7 would be relevant to explain the total variance.
The Figure 7 represents the values of the loading factors of each empirical variable in each of the components 1 - 10. The loading factors represent the correlation between the factorial scores of a given component and the empirical variables values. Therefore, a high loading factor would be interpreted as the component being a source of variance for a given variable. The Figure 7 shows that LPC and delta share statistically significant loading factors in the same components (2 - 5), indicating that the same source of variance explains both: LPC and delta band.
The hierarchical cluster analysis (Figure 8) confirmed the pattern of co-variation detected by the correlational and the PCA. Hierarchical clustering analyzes the empirical variables Euclidean distance in the multivariate subject´s space. The dendrogram showed a close association between the LPC and the delta band when the total sample is analyzed (children and young adults). This result suggests that, as indicated in Figure 3, there is a close association in the pattern of maturation of spontaneous delta and LPC, but also a secondary pattern of association with theta.
To verify whether the analysis of the reduced matrix is similar to that of the original matrix (composed by 120 variables: 4 bands × 20 electrodes + 20 electrodes of LPC valid cues + 20 electrodes of LPC invalid cues), we also applied the same techniques to the original matrix (Figure 9). The Spearman’s correlation showed that the LPC amplitude presented a high correlation with the PSD of the delta band. The posterior electrodes of the LPC showed the highest positive correlation with the delta PSD. The anterior electrodes showed negative correlations with the delta band as shown in Figure 9.
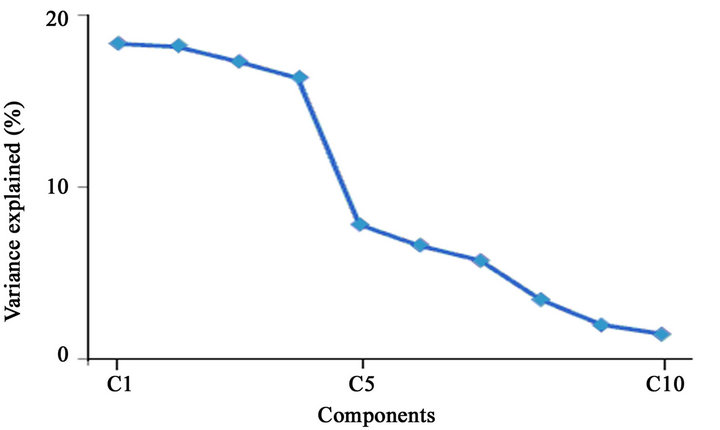
Figure 6. Percentage of variance explained by PCA components 1 - 10. Notice the changes in slope from component 4 to 5, and from component 7 to 8.
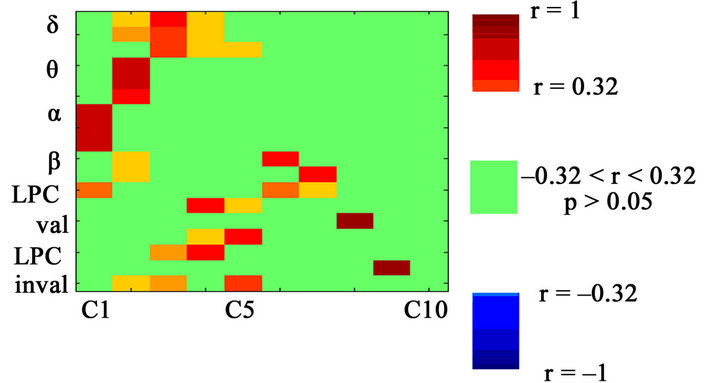
Figure 7. Loading factors of the different variables with component 1-10. LPC (valid and invalid conditions) and delta band present the same pattern of statistically significant loading factors for components 2 - 5. Positive loading factors are shown in red, and negative loading factors are shown in blue. The lack of correlation is represented in green, with a significance level of p > 0.05.
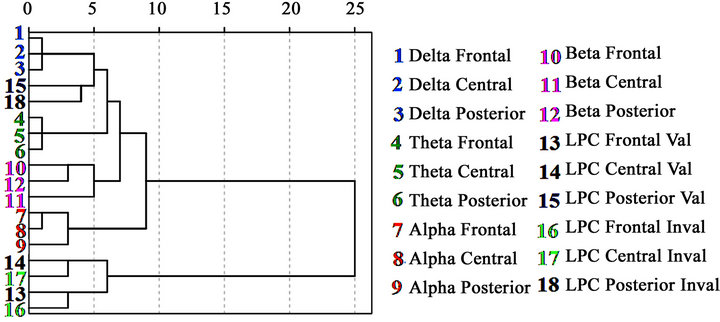
Figure 8. Dendrogram representing the hierarchical clustering of the different empirical variables. The dendrogram was obtained from the total sample (38 subjects). Notice that the posterior LPC in valid and invalid conditions are situated hierarchically between delta and theta bands.
It would be interesting to test if the association between LPC and delta is maintained when the original extended matrix (120 variables and 38 subjects) is introduced in the PCA analysis. However, in this case more variables than subjects appear and some errors would appear in the PCA. However, if the factorial scores of the more significant components obtained from the collapsed (reduced) and the original (extended) data matrices are similar, it would imply that the same components are extracted, implying the validity of the PCA analysis of the extended matrix. The correlation of the factorial scores of the first four components extracted from the PCA with 120 variables (abscissa axis) with the factorial scores of the first four components extracted from the PCA with 18 variables (ordinate axis) is represented in Figure 10. The first four components of the original matrix are not in the same extraction order that the first four components of the reduced matrix. The first component of the original matrix corresponds to the third component of the reduced matrix, the second to the first, the third to the second and only the fourth matches in both matrices. However, it can be observed that the correlation is very high (>0.97 for all the comparisons), which means that both analyses (reduced and non-reduced) are reliable. This is probably due to the high pattern of covariance between different electrodes.
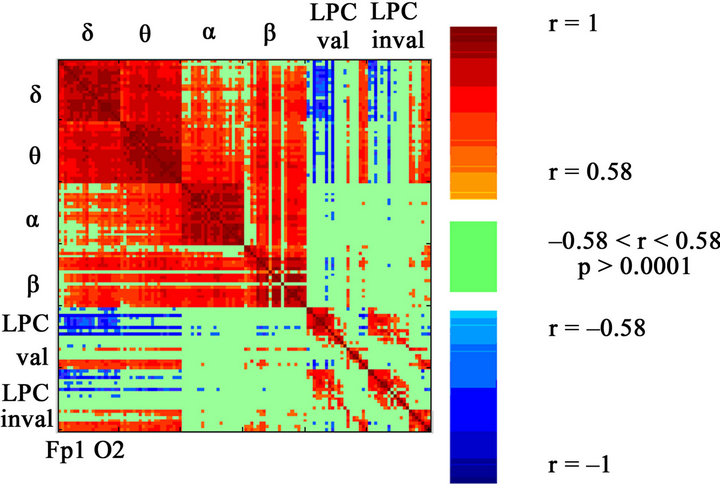
Figure 9. Spearman’s correlations between the four frequency bands’ PSD’s and the amplitude of the valid and invalid LPC components. The correlations are obtained for the 20 recorded electrodes. Positive correlations are shown in red, and negative correlations are shown in blue. The lack of correlation is represented in green, with a significance level of p > 0.0001. For each band and LPC, the PSD and amplitude values are represented for the 20 electrodes (Fp1, Fp2, F3, F4, F7, F8, Fz, FCz, T7, T8, C3, C4, Cz, P7, P8, P3, P4, Pz, O1, O2). Each row or column of the matrix represents a frequency (or LPC amplitude) in a given electrode. Notice the high statistically significant pattern of correlation between the delta band with the LPC component; negative for frontal electrodes and positive for posterior electrodes. LPC also showed a high pattern of correlation with the theta band, however less than with delta, especially in the frontal electrodes.
The Figure 11 represents the amount of variance explained by each component. As indicated before, this representation can be used as a Scree Test in which the components that produce a change in the slope of the curve are retained. The figure present a single change of slope suggesting that the components 1 - 5 would be relevant to explain the total variance.

Figure 10. Pearson’s correlations between the components extracted from PCA in the 120 variables matrix (abscissa axis) and the four components extracted from PCA in the 18 variables matrix (ordinate axis). The pairs of components selected are the homologous components (same pattern of loading factors) in both PCAs.

Figure 11. Percentage of variance explained by components 1 - 10. Notice the change in slope from component 5 to 6.
The Figure 12 represents the values of the loading factors of each empirical variable with the components 1 - 10. High loading factors would be interpreted as the component being a source of variance for a given variable. The Figure 12 shows that LPC and delta share statistically significant loading factors in the same components (1 - 2), indicating that the same source of variance explains both: LPC and delta band.
From all the previous results a statistically significant pattern of correlation emerges between spontaneous delta and LPC amplitude, the following step would be related to demonstrating the reduction of LPC amplitude with age is due to the building up of LPC by a combination of baseline power spatially filtered by the ITC values and by the ERSP post-target. As delta decrease with age, a concomitant reduction of LPC would occur.
4.2. Late Positive Component as a Function of Delta Range ERSP-BL, ITC and ERSP-PT
Figure 13 shows the normalized ERSP in the delta range (increase in percentage from baseline) of LPC in Pz for valid and invalid conditions in children and young adults. In both cases there is an increase that was statistically significant (Table 1) for the electrodes in which LPC has maximal amplitude. The ITC also showed a statistically significant increase in the LPC time window and frequency range for both children and adults in both experimental conditions (valid and invalid). For the sake of comparison the absolute ERSP without baseline correction is also displayed. In the absolute ERSP the higher power in baseline of children with respect to adults for the delta range frequency can be appreciated.
The Figure 14 shows the topographies of parameters extracted from the FFT of spontaneous EEG and wavelet
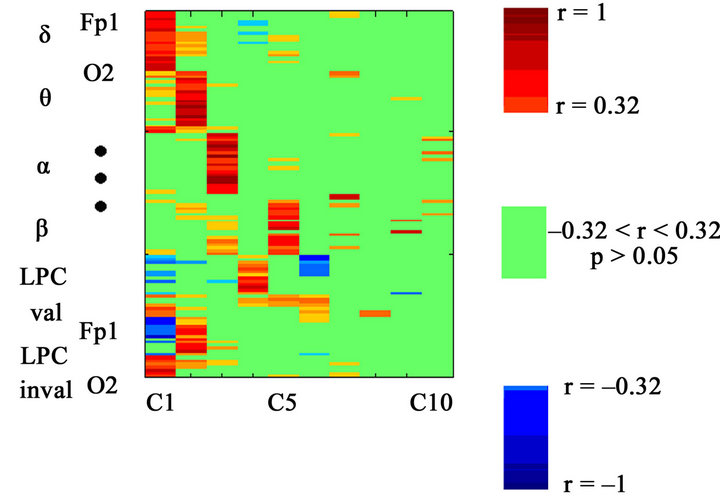
Figure 12. Loading factors of the different variables with component 1-10 obtained from the extended matrix) (120 variables). LPC (valid and invalid conditions) and delta present the same statistically significant loading factors components 1-2. Positive loading factors are shown in red, and negative loading factors are shown in blue. The lack of correlation is represented in green, with a significance level of p > 0.05.
analysis during target stimulation, and the correlations of LPC vs. these parameters, and the correlations of LPC and the obtained parameters with age. This figure includes all the topographies for the valid and invalid condition.
There are several interesting results than can be drawn from these representations:
1) LPC decrease with age in posterior sites for both, valid and invalid conditions.
2) The negative correlation of delta spontaneous power, delta * ITC, ERSP-BL and ERSP-BL with age.
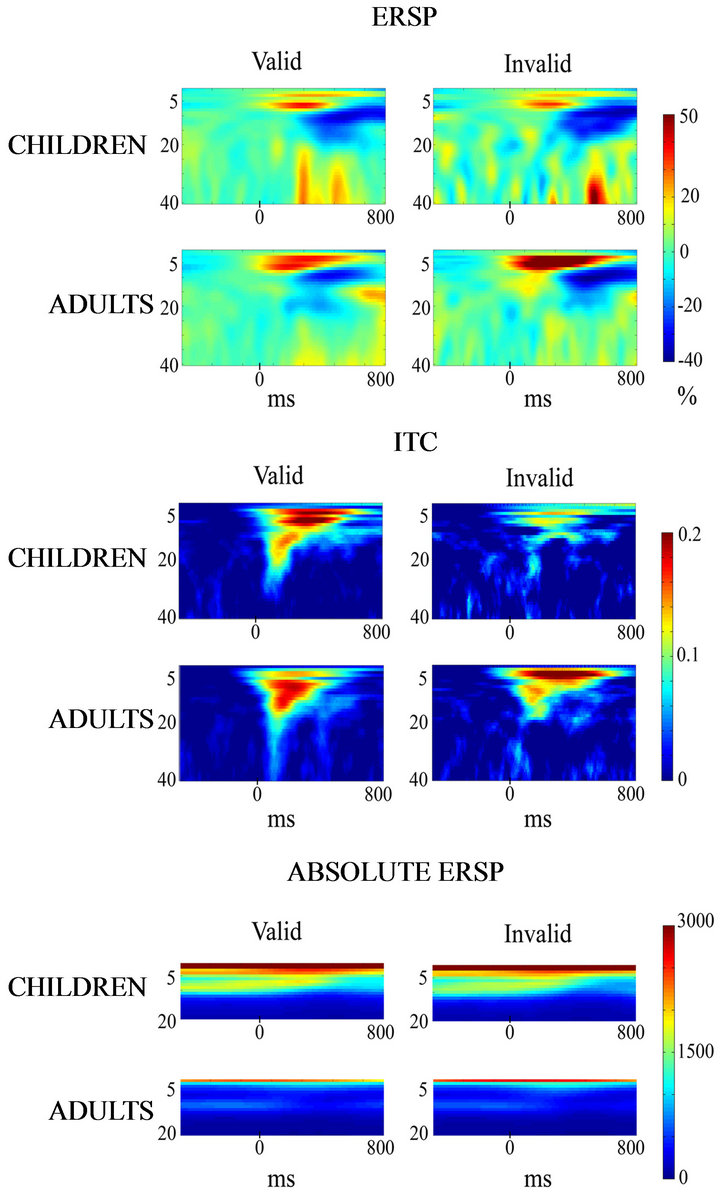
Figure 13. Normalized and absolute ERSP and ITC in the frequency range of 1-40 Hz. The normalized ERSP is expressed as an increase in percentage from baseline. An increase in delta, but also in other frequencies can be appreciated, for valid and invalid conditions in children and young adults. The ITC is also increased with respect to baseline in the time window and frequency range of LPC for both children and adults in both experimental conditions (valid and invalid). The absolute ERSP is also displayed in the bottom of the figure. Notice that absolute power is low frequencies is much higher in children than in young adults in baseline and post-target periods.
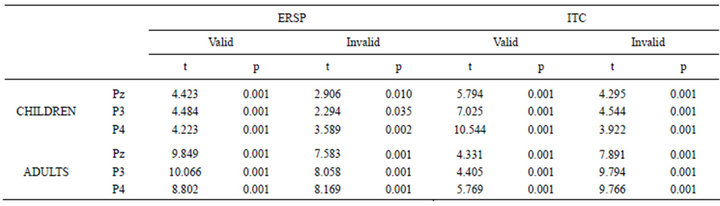
Table 1. T-test comparisons between baseline and ERSP and ITC averaged in the 200-400 ms time window and the 2-4 Hz frequency range in the electrodes Pz, P3 and P4. The statistical comparisons were computed independently for children and young adults. The hypothesis of normality of all these variables was accepted by means of the Kolmogorov-Smirnov test of goodness of fit (p > 0.05).

Figure 14. Topographies for valid (left side) and invalid (right side) conditions. Topography column: Topographies of LPC in microvolt's, power of spontaneous delta EEG in squared microvolt’s, ITC in arbitrary units, the product of spontaneous delta power by ITC (delta * ITC) in arbitrary units, ERSP during baseline (ERSP-BL) in arbitrary units, the product of ERSP-BL by ITC (ERSP-BL * ITC) in arbitrary units, normalized ERSP post-target (ERSP-PT) in percentage increase from baseline. Column of correlation of LPC vs.: Spearman's correlation, electrode by electrode, of LPC with the other extracted parameters. Column of correlation of age vs.: Spearman's correlation, electrode by electrode, of the different parameters with age. Negative values indicated that this parameter decreases with age, and positive values indicate an increase with age.
3) ITC presents an anterior and posterior topography that could provide a spatial filter for the delta ERSP-BL. This parameter increases with age in the invalid condition.
4) Delta ERSP-BL baseline maximizes the central topography of delta, and the posterior topography is decreased with respect to spontaneous delta.
5) ERSP-BL when multiplied by ITC, which would work as a spatial filter in the generation of LPC, yields a posterior topography in valid condition and anterior topography in invalid condition.
6) ERSP-PT presents an increase in anterior and posterior sites following the topography of LPC. Interestingly, this parameter grows with age.
The general picture that can be drawn from this correlation pattern is that as post-target ERSP grows with age, while LPC decreases, ERSP post-target by itself cannot explain the decrease of LPC with age. However, introducing one component decreasing with age (baseline ERSP) spatially filtered by ITC would be able to reproduce the LPC topography.
Applying the multiple regression model described in the methods section it was possible reproduce the LPC topography in both valid and invalid conditions (Figure 15) with a high degree of statistical significance for the proposed model (Equation (15)).
5. DISCUSSION
The results showed a close correlation between the PSD of the delta band and the amplitude of the LPC component in the period from late childhood to young adulthood. This relationship, as revealed by the correlations matrices, appears in both frontal and posterior areas with different signs. The LPC presented a similar scalp distribution with alpha and with the posterior electrodes of delta. PCA analysis showed that the same source of variance explains the delta and LPC variability, and alpha power is nor related as a common source of variance
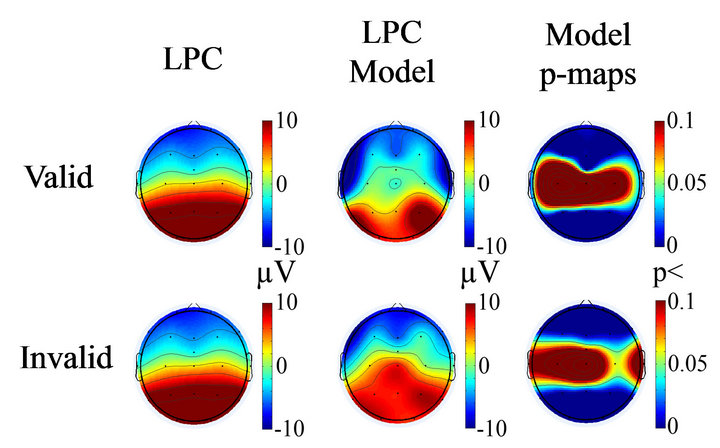
Figure 15. Topographies of LPC in valid and invalid condition (left column), the computed model of LPC by equation 5 (middle column), and the statistical significance of the model in each electrode (right model).
with LPC. The hierarchical clustering also showed a clear association between delta and LPC and, at a higher hierarchical level, with theta. This result is corroborated by the topographical analysis, in which delta and LPC revealed a common topography in the posterior regions of the children group. These results taken together suggest that it exist a pattern of co-maturation between the delta rhythm and the LPC component.
In the time window of LPC there was an increase of ITC and ERSP-PT in the delta range. LPC was reconstructed by a linear combination of ERSP post-target and ITC. Therefore, the decrease of LPC with age could be partly due the amplitude decrease of delta oscillations in baseline contributing to the LPC decrease in amplitude in young adults. The fundamental role of baseline amplitude oscillations is confirmed by the maturational trend of increase with age of ITC and ERSP-PT, which would imply that the decrease of LPC with age is due to the reduction of delta baseline power.
There are two different possible explanations for the spatio-temporal pattern of co-maturation between posterior delta and the LPC component: i) As the LPC in the central cue Posner paradigm is partially produced by phase resetting of delta [22], the LPC maturation (decrease in amplitude) in the more posterior electrodes would be due to the decreasing power of delta with age. Alternatively or simultaneously, ii) it is possible that a common factor would be influencing the amplitude decrease in the EEG parameters: delta (and theta) band and posterior LPC. A natural candidate would be synaptic pruning [26,27].
The association of posterior delta maturation and LPC maturation was obtained through the correlations matrices, by the embedding of factor loadings of posterior LPC variables with delta variables in the PCA and by hierarchical clustering. Given the high variability across age of LPC and spectral power, a positive correlation between these two parameters, measured in different experimental times, would provide extra support for the hypothesis that LPC is constructed from spontaneous delta oscillations. It must be pointed out that LPC and spontaneous activity were measured in different times (several minutes apart); therefore, any correlation between these two parameters should be considered a stable state in the central nervous system, and not due to highly variable states like attention or arousal. Moreover, time-frequency analyses have been performed on P300- evoked response paradigms, in order to study potential correlations between changes in cerebral rhythms and the P300 component.
The existing relation between the P300 and the delta band can be seen in many ways: P300 amplitude relative to pre-stimulus EEG, in which the amplitude of the wave demonstrated an enhancement corresponding to the delta range [4]; the relationship between P300 ERP studies and the background EEG spectral power [13,14] and the phase-locking with stimulus, where it can be observed that the P300 is composed of phase synchronized oscillations (“phase-locked”) in the delta and theta frequency bands [28]. The P300 response was found to be associated with delta and theta synchronization [29,30] and with alpha desynchronization [31]. In our study we correlate the results obtained from a LPC ERPs study with the data obtained from the background EEG.
This association between delta maturation and LPC also points to the idea that cognitive functioning maturation indexed by LPC would be contingent on the maturation of the more basic function of the delta rhythm. For example, several studies have also indicated that EEG and the P300 component appear to interact during information processing tasks within subjects [13,19,32]. These findings suggest that understanding the relationship between background EEG activity and ERPs can provide insight into how electrophysiological measures reflect cognition. The obtained statistically significant phase resetting in children and young adults point out to the possibility that the co-maturation between LPC and delta is in fact partly due to the phase resetting process. The contribution of delta in LPC would be decreasing as the delta amplitude decrease with maturation.
The topographies of LPC can be reproduced by a model including the baseline delta power spatially filtered by ITC, plus the ERSP induced by the target. This model strongly suggests to fundamental role of delta rhythm maturation an explanatory condition for LPC maturation.
On the other hand, it is possible that the co-maturation of delta and LPC would be due to a common factor independently affecting the generators of LPC and delta. One of the most likely candidates is synaptic pruning. Synaptic pruning would be related to the decrease in electrophysiological synaptic activity. Hudspeth and Pribram [33] observed that through the development of cognitive functions, during puberty cerebral maturation progresses from posterior to frontal regions. Cerebral maturation shows progressive (axon myelinization) and regressive (synaptic pruning) phenomena [34,35]. Between childhood and adolescence, grey and white matters follow different developmental paths: grey matter decreases with age, possibly due to synaptic pruning [26, 27], while white matter increases with age, probably due to axon myelinization [36]. This pattern continues until the age of 20 [37]. Whitford et al. [38] suggested that the cause of the decline in the lower EEG frequencies in adolescents might be due to synaptic pruning.
It is possible to recapitulate and consider that synaptic pruning is affecting delta band and therefore, by the phase resetting process underlying LPC generation, also affecting LPC amplitude during development.
The conclusion can be drawn that a clear pattern of comaturation appears between delta power and posterior LPC amplitude. Given the pure correlational nature of the present study, it is difficult to claim any specific cause for this pattern. A dependence of LPC amplitude on basal delta or a common dependence on maturational factors can be suggested.
6. CONCLUSION
The results suggest that the delta band and LPC are closely associated in early ages when the brain begins to mature in more posterior regions. This co-maturation would depend on a common factor influencing both processes, like synaptic pruning, and/or an interdependency of both phenomena, as the LPC is partially constructed by phase resetting of the delta band.
REFERENCES
- Barriga-Paulino, C.I., Flores, A. and Gómez. C.M. (2011) Developmental of spontaneous EEG. Journal of Psychophysiology, 25, 143-158. doi:10.1027/0269-8803/a000052
- Matousek, M. and Petersén, I. (1973) Frequency analysis of the EEG in normal children and adolescents. In: Kellaway, P. and Petersén, I., Eds., Automation of Clinical Electroencephalography. Raven Press, New York, pp. 75- 102.
- Somsen, R.J.M., Klooster, B.J., Van der Molen M.W., Van Leeuwen, H.M.P. and Licht, R. (1997) Growth spurts in brain maturation during middle childhood as indexed by EEG power spectra. Biological Psychology, 44, 187- 209. doi:10.1016/S0301-0511(96)05218-0
- Basar, E., Basar-Eroglu, C., Rosen, B. and Schutt, A. (1984) A new approach to endogenous event-related potentials in man: Relation between EEG and P300-wave. International Journal of Neuroscience, 24, 1-21. doi:10.3109/00207458409079530
- Courchesne, E. (1978) Neurophysiological correlates of cognitive development: Changes in long-latency eventrelated potentials from childhood to adulthood. Electroencephalography and Clinical Neurophysiology, 45, 468- 482. doi:10.1016/0013-4694(78)90291-2
- Fuchigami, T., Okubo, O., Ejiri, K., Fujita, Y., Kohira, R. and Noguchi, Y. (1995) Developmental changes in P300 wave elicited during two different experimental conditions. Pediatric Neurology, 13, 25-28. doi:10.1016/0887-8994(95)00086-U
- Oades, R.D., Dittmann-Balcar, A. and Zerbin, D. (1997) Development and topography of auditory event-related potentials (ERPs): Mismatch and processing negativity in individuals 8 - 22 years of age. Psychophysiology, 34, 677-693. doi:10.1111/j.1469-8986.1997.tb02143.x
- Thomas, K.M. and Nelson, C.A. (1996) Age-related changes in the electrophysiological response to visual stimulus novelty: A topographical approach. Electroencephalography and Clinical Neurophysiology, 98, 294-308. doi:10.1016/0013-4694(95)00280-4
- Van der Stelt, O., Kok, A., Smulders, F.T., Snel, J. and Boudewijn Gunning, W. (1998) Cerebral event-related potentials associated with selective attention to color: developmental changes from childhood to adulthood. Psychophysiology, 35, 227-239. doi:10.1111/1469-8986.3530227
- Berman, S., Friedman, D. and Cramer, M. (1990) A developmental study of event-related potentials during explicit and implicit memory. International Journal of Psychophysiology, 10, 191-197. doi:10.1016/0167-8760(90)90034-B
- Flores, A., Gómez, C.M. and Meneres, S. (2010) Evaluation of spatial validity-invalidity by the P300 component in children and young adults. Brain Research Bulletin, 81, 525-533. doi:10.1016/j.brainresbull.2010.01.005
- Klimesch, W. (1995) The P300 wave and band power in the alpha and theta range. Psycoloquy, 6.
- Intriligator, J. and Polich, J. (1994) On the relationship between background EEG and the P300 event-related potential. Biological Psychology, 37, 207-218. doi:10.1016/0301-0511(94)90003-5
- Intriligator, J. and Polich, J. (1995) On the relationship between EEG and ERP variability. International Journal of Psychophysiology, 20, 59-74. doi:10.1016/0167-8760(95)00028-Q
- Klimesch, W., Schimke, H. and Pienert, C. (1995) Frequency components of the P300. Psycoloquy, in press..
- Digiacomo, M.R., Gómez, C.M. and Flores, A.B. (2007) Alpha reduction and event-related potentials, theta and gamma increase linked to letter selection. Neuroreport, 18, 729-733. doi:10.1097/WNR.0b013e3280c1e370
- Basar, E., Basar-Eroglu, C., Röschke, J. and Schütt, A. (1989) The EEG is a quasi-deterministic signal anticipating sensory-cognitive tasks. In: Basar, E. and Bullock, T.H., Eds., Brain Dynamics: Progress and Perspectives, Springer-Verlag, Berlin, 43-71.
- Jasiukaitis, P. and Hakerem, G. (1988) The effect of prestimulus alpha activity on P300. Psychophysiology, 25, 157-165. doi:10.1111/j.1469-8986.1988.tb00979.x
- Polich, J. (1997) EEG and ERP assessment of normal aging. Electroencephalography and Clinical Neurophysiology, 104, 244-256. doi:10.1016/S0168-5597(97)96139-6
- Pritchard, W.S., Brandt, M.E., Shappell, J., ODell, T. and Barrett, E.S. (1985) P300 amplitude/prestimulus EEG power relationships. Psychophysiology, 22, 210.
- Verleger, R. (1995) Memory-related EEG potentials: Slow negativities, priming positivity, recognition positivity, and Dm. Psycoloquy, 6.
- Digiacomo, M., Marco-Pallarés, J., Flores, A. and Gómez, C.M. (2008) Wavelet analysis of the EEG during the neurocognitive evaluation of invalidly cued targets. Brain Research, 1234, 94-103. doi:10.1016/j.brainres.2008.07.072
- Lagerlund, T.D., Sharbrough, F.W. and Busacker, N.E. (1997) Spatial filtering of multichannel electroencephalographic recordings through principal component analysis by singular value decomposition. Journal of Clinical Neurophysiology, 14, 73-82. doi:10.1097/00004691-199701000-00007
- Gorsuch, R.L. (1983) Factor analysis. 2nd Edition, L. Erlbaum Associates, Hillsdale.
- Tallon-Baudry, C., Bertrand, O., Delpuech, C. and Permier, J. (1997) Oscillatory gamma-band (30 - 70 Hz) activity induced by a visual search task in humans. Journal of Neuroscience, 17, 722-734.
- Shaw, P., Greenstein, D., Lerch, J., Clasen, L., Lenroot, R., Gogtay, N., Evans, A., Rapoport, J. and Giedd, J. (2006) Intellectual ability and cortical development in children and adolescents. Nature, 440, 676-679. doi:10.1038/nature04513
- Shaw, P., Kabani, N.J., Lerch, J.P., Eckstrand, K., Lenroot, R., Gogtay, N., Greenstein, D., Clasen, L., Evans, A., Rapoport, J.L., Giedd, J.N. and Wise, S.P. (2008) Neurodevelopmental trajectories of the human cerebral cortex. Journal of Neuroscience, 28, 3586-3594. doi:10.1523/JNEUROSCI.5309-07.2008
- Yordanova, J. and Kolev, V. (1998). Developmental changes in the theta response system: A single sweep analysis. Journal of Psychophysiology, 12, 113-126.
- Basar-Eroglu, C., Basar, E., Demiralp, T. and Schürmann, M. (1992) P300-response: Possible psychophysiological correlates in delta and theta frequency channels. A review. International Journal of Psychophysiology, 13, 161-179. doi:10.1016/0167-8760(92)90055-G
- Basar-Eroglu, C., Demiralp, T., Schürmann, M. and Basar, E. (2001) Topological distribution of oddball ‘P300' responses. International Journal of Psychophysiology, 39, 213-220. doi:10.1016/S0167-8760(00)00142-2
- Yordanova, J., Kolev, V. and Polich, J. (2001). P300 and alpha event-related desynchronization (ERD). Psychophysiology, 38, 143-152. doi:10.1111/1469-8986.3810143
- Mecklinger, A., Kramer, A.F. and Strayer, D.L. (1992) Event-related potentials and EEG components in a semantic memory search task. Psychophysiology, 29, 104- 119. doi:10.1111/j.1469-8986.1992.tb02021.x
- Hudspeth, W.J. and Pribram, K.H. (1992) Psychophysiological indices of cerebral maturation. International Journal of Psychophysiology, 12, 19-29. doi:10.1016/0167-8760(92)90039-E
- Giedd, J.N. (2004) Structural magnetic resonance imaging of the adolescent brain. Annuals of New York Academy of Sciences, 1021, 77-85. doi:10.1196/annals.1308.009
- Keshavan, M.S., Diwadkar, V.A., DeBellis, M., Dick, E., Kotwal, R., Rosenberg, D.R., Sweeney, J.A., Minshew, N. and Pettegrew, J.W. (2002) Development of the corpus callosum in childhood, adolescence and early adulthood. Life Sciences, 70, 1909-1922. doi:10.1016/S0024-3205(02)01492-3
- Sowell, E.R., Trauner, D.A., Gamst, A. and Jernigan, T.L. (2002) Development of cortical and subcortical brain structures in childhood and adolescence: A structural MRI study. Developmental Medicine & Child Neurology, 44, 4-16. doi:10.1017/S0012162201001591
- Paus, T., Collins, D.L., Evans, A.C., Leonard, G., Pike, B. and Zijdenbos, A. (2000) Maturation of white matter in the human brain: A review of magnetic resonance studies. Brain Research Bulletin, 54, 255-266.
- Whitford, T.J., Rennie, C.J., Grieve, S.M., Clark, C.R., Gordon, E. and Williams, L.M. (2007). Brain maturation in adolescence: Concurrent changes in neuroanatomy and neurophysiology. Human Brain Mapping, 28, 228-237. doi:10.1002/hbm.20273