Journal of Cancer Therapy
Vol.4 No.4A(2013), Article ID:30663,12 pages DOI:10.4236/jct.2013.44A008
iTorin1—An Active Site Inhibitor of mTOR, Suppresses Prostate Cancer Cell Growth Induced by Activated α2M-Macroglobulin Ligation of Cell Surface GRP78
![]()
Department of Pathology, Duke University Medical Center, Durham, UK.
Email: cristina.roscia@unibg.it
Copyright © 2013 Uma K. Misra, Salvatore V. Pizzo. This is an open access article distributed under the Creative Commons Attribution License, which permits unrestricted use, distribution, and reproduction in any medium, provided the original work is properly cited.
Received February 27th, 2013; revised March 28th, 2013; accepted April 4th, 2013
Keywords: α2-Macroglobulin; Torin1; Prostate Cancer Cells Proliferation; p-S6KT389; p-4EBP1; p-AktS473; Insulin
ABSTRACT
In this study, we reported the effect of the ATP binding site competitive inhibitor Torin1 on activated α2-macroglobulin (α2M*)-induced cell proliferation and activation of mTORC1 and mTORC2 signaling in prostate cancer cells. Torin1 significantly inhibited α2M*-induced cellproliferation as measured by protein and DNA synthesis. Translational activity, a major cellular response in malignant cells, is coordinately regulated by the mTORC1-S6-kinaseand mTORC1-4EBP1 axes. Torin1 significantly inhibited α2M*- and insulin-induced activation of mTORC1 as determined by phosphorylation of S6-kinaseat Thr389 and 4EBP1 at Thr37/46 compared to untreated cells employing Raptor immunoprecipitates. Torin1 also significantly inhibited α2M*- and insulin-induced upregulation of p-AktT308 and p-AktS473 in prostate cancer cells. The effect was comparable to that of insulin employed as a positive control. Finally, Torin1 inhibited α2M*- and insulin-induced activation of mTORC2 kinase assayas measured by phosphorylation of Akt at Ser473 in Rictor immunoprecipitates of prostate cancer cells.
1. Introduction
The ability of cancer cells to thrive in vivo depends on many factors among which are the repertoire of proteins modulating their environment. Human α2-macroglobulin (α2M) is synthesized by many tissuesand functions as a pan-proteinase inhibitor. When proteinases attack the “bait region” in each of the four α2M subunits, thiolesters rupture and the protein undergoes a very large conformational change exposing receptor recognition sites in each subunit [1]. In addition to proteinases, exposure of α2M to small primary amines or ammonia, by direct attack on the thiolesters, also induces a large conformationalchange exposing these receptor recognition sites [1]. These activated forms are designated α2M*. Although GRP78 (glucose regulated protein of Mr ~78,000) is primarily known as a resident endoplasmic reticulum chaperone, it appears on the cell surface of many types of malignant cells [2-9]. Binding of α2M* to tumor cell surface GRP78 causes its autophosphorylation [8,10] activating down stream pro-proliferative and anti-apoptotic signaling cascades including Ras/MAPK and PI 3-kinase/
Akt/mTOR [2-12]. It has, therefore, been suggested that upregulation of cell surface GRP78 is part of the aggressive phenotype in various cancers including prostate and melanoma [5]. Consistent with this hypothesis, autoantibodies against the NH2-terminal domain of GRP78 appear in the sera of prostate cancer and melanoma patients where they are a biomarker of aggressive behavior [13, 14]. These antibodies are agonists which bind to the same region of GRP78 where α2M* binds [15]. In contrast, monoclonal antibodies directed against the carboxyl-terminal domain of GRP78 are antagonists of α2M* and anti-GRP78-NH2-terminal domain antibodies in cell culture and mice [9-11,16,17]. Based on these and other observations, we hypothesize that activated α2M functions like a growth factor and cell surface-associated GRP78 as a growth factor-like receptor.
Akt is a Ser/Thr kinase expressed as isoforms, Akt1, Akt2, and Akt3, encoded by three different genes [18]. These isoforms are nearly identical in amino acid sequence; however, their relative expression differs in various mammalian tissues. Akt is the major downstream effector in the PI 3-kinase pathway and it regulates cell survival, proliferation, and metabolism. PI 3-kinase phosphorylates PIP2 to generate PIP3 which binds to Akt thus promoting its translocation to the plasma membrane where it is phosphorylated at Thr308 in the catalytic domain by PDK1 and Ser473 by mTORC2 in the hydrophobic domain [18,19]. Phosphorylation at both these positions is required for full activation of Akt1. Phosphorylation of Thr308 is indispensable for kinase activity, whereas phosphorylation at Ser473 in the hydrophobic motif domain enhances Akt kinase activity by about fivefold [20]. Akt1 is also phosphorylated co-translationally at Thr450 in the “turn” motif by mTORC2 [21]. The turn motif phosphorylation of Akt is essential for newly synthesized Akt to assume its proper folding and stability. Mutations of Ras which activate Akt, occur in ~30% of epithelial tumors and Akt gene amplification also occurs in a subset of human cancers. In addition, partial ablation of Akt is sufficient to inhibit the development of tumors in PTEN +/− mice [22,23]. In clinical specimens of prostate cancer the overexpression and activation of Akt1 is associated with high pre-operative prostate specific antigen (PSA) levels, higher Gleason grades, and shorter disease relapse times [22,23]. Immunohistochemical studies show a greatly enhanced staining of p-AktSer473 in poorly differentiated prostate cancer [24-26]. The disruption of mTORC2 by different genetic and pharmacological approaches has variable effects on Akt phosphorylation. Targeting mTORC2 by RNAi, homologous recombination, or long term rapamycin treatment results in downregulation of Akt phosphorylation at Ser473. RNAi or long term rapamycin treatment results in loss of Akt phosphorylation at Thr308, but this phosphorylation remains intact in mouse embryonic fibroblasts lacking the mTORC2 component mS1N1 [11].
Mammalian target of rapamycin (mTOR), an evolutionarily conserved Ser/Thr kinase, is a key regulator of Akt phosphorylation [27-29]. There is growing interest in targeting mTOR in the treatment of cancers such as prostate [29]. This goal may be complicated by the fact that mTOR is present in two physically and functionally distinct protein complexes designated as mTORC1 and mTORC2, respectively [see reviews 27-32]. These two complexes differ in their regulation, downstream targets, and sensitivity to the inhibitor rapamycin. mTORC1 is a homodimercontaining mTOR Raptor, and GβL which is sensitive to rapamycin. Activated mTORC1 promotes cell growth in part by directly phosphorylating the translational regulators S6-kinase (S6K) and eIF4E binding protein (4EBP) [27-33]. Akt-induced phosphorylation of PRAS40 and Deptor causes their dissociation from Raptor and promotes recruitment of its downstream substrates S6K1 and 4EBP [see reviews 27-33 and references therein]. Binding of Rheb·GTP to mTORC1 results in mTORC1 activation, while binding to Rheb·GDP in its inhibition. Phosphorylation of TSC2 by Akt1 inhibits its GTPase activity leading to increased GTP loading on Rheb and consequent increase in mTORC1 activity [see reviews 27-33 and references therein]. S6-kinase regulates mTORC1 through a negative feedback signaling pathway that phosphorylates IRS and inhibits PI 3-kinase and Akt activation. The mTORC2 complex, in addition to mTOR, contains Rictor, GβL, Deptor, Protor, and mSIN1 and is insensitive to acute rapamycin inhibition [see 27-33 and references therein]. However, prolonged mTORC2 exposure to rapamycin inhibits mTORC2 in some cell types [27-33]. Protor binds tightly to Rictor, but is not required for mTORC2 activity [27-29,32]. Both mTORC1 and mTORC2 are activated by growth factors including insulin and insulin-like growth factor [27-33]. However, the mechanisms by which growth factors activate mTORC2 are not clearly understood [27-33]. mTORC2 associates with ribosomes and this may serve as an upstream regulatory mechanism [34].
In a recent study of prostate cancer cells, we reported that binding of α2M* to cell surface GRP78 activates both mTORC1 and mTORC2 signaling as determined by phosphorylation of S6K (S6KT389), 4EBP1, and mTORC2 signaling as determined by phosphorylation of Akt at Ser473 [11]. Activation of mTOR in response to growth factors, nutrients, and energy signals leads to an increase in protein and lipid synthesis which is required for robust tumor growth. This feature of mTOR makes it an attractive target for cancer therapy [35]. First generation mTOR inhibitors form a complex with intracellular receptor FK506 binding protein 12 (FKBP12) which interferes with mTOR activity [35-39]. In monotherapy, rapalogs have antitumor activity with toxic effects. Rapalogs preferentially disrupt mTORC1 where as second generation small molecule mTOR kinase inhibitors target both mTORC1 and mTORC2 [35-39]. Both classes of agents reduce down stream mTOR functions in diverse carcinomas, lymphomas, and glioblastoma cell lines [35-39]. They inhibit phosphorylation of S6K and 4EBP1 by mTORC1 which alters the translation of certain mRNAs involved in the regulation of cell cycle progression. These agents also inhibit protein translation and cancer cell proliferation, induce G1 cell cycle arrest and apoptosis in some cell lines [35-39]. In recent years several second generation potent and selective ATP-competitive inhibitory of mTOR, such as Torin1 [39], PP242 [38], KU63794 [40], or WYE354 [41] have been developed. These inhibitors are being widely used as pharmacological probes of mTOR. Enzymatic and cellular assays showed that all four compounds are potent inhibitors of mTORC1 and mTORC2 with Torin exhibiting ~20-fold-greater potency for inhibition of mTORC1 relative to other inhibitors [38-41]. Torin1 also showed a sustained inhibition of mTOR at nM concentrations compared to other ATP binding site inhibitors [39]. Ourprevious studies demonstratethat ligation by α2M* to cell surface GRP78 promotes prostate cancer cell proliferation and survival by activating PI 3-kinase/Akt/mTOR signaling [11 and references therein]. Since mTOR isa master integrator of growth factors and cancer cell proliferation [27-32], we employed Torin1, an active site inhibitor of mTOR, to suppress α2M*-inducedproliferation and survival of prostate cancer cells. We show here that pretreatment of prostate cancer cells with nM concentrations of Torin1 significantly decreased α2M*-induced protein and DNA synthesis. Torin1 also inhibited mTORC1 signaling as determined by S6K and 4EBP1 phosphorylation in Raptor immunoprecipitates and mTORC2 inhibition as determined by phosphorylation of Akt at Ser473 in Rictor immunoprecipitates of prostate cancer cells pretreated with α2M* or insulin.
2. Experimental Methods and Procedures
2.1. Materials
Culture media were purchased from Invitrogen. Receptor-recognized α2M* was produced by reaction of α2M with methylamine as described previously [11]. Antibodies against, p-S6KT389, 4EBP1, p-4EBP1T37/46, Akt1, pAktT308, and p-AktS473 were purchased from Cell Signaling Technology (Danvers, MA). Antibodies against Raptor and Rictor were from Santa Cruz Biotechnology (Santa Cruz, CA). Anti-actin antibody was from Sigma (St. Louis, MO). 4EBP1 was from Stratagene. A GSTS6K construct was expressed and purified according to the protocol provided by Prof. Blenis (Harvard University Medical School). Antibodies against the carboxylterminal domain of GRP78 were from Aventa Biopharmaceutical Corp (San Diego, CA). [3H]Leucine (specific activity 115.4 Ci/mmol) [3H]Thymidine (specific activity 174 Ci/mmol) and [33P]-γ-ATP (specific activity 3000 Ci/mmol) were from Perkin-Elmer Life Sciences. All other materials were of analytical grade and were procured locally.
2.2. Prostate Cancer Cell Lines
In an earlier report, we studied two prostate cancer lines 1-LN and DU-145, which express GRP78 on their cell surface and PC-3 prostate cancer line, which expresses little GRP78 on its cell surface [7,11]. The highly metastatic 1-LN cell line was a kind gift of Dr. Philip Walther (Duke University Medical Center, Durham, NC). The 1-LN cell line was derived from a flank tumor model in which PC-3 cells were implanted in nude mice. The cells were obtained from a rare lymph node metastasis in these mice. Because thiscell line expresses a high level of GRP78 on the cell surface and none or very little LRP which also binds α2M*, we have extensively used this line for studying the role of cell surface GRP78 in cancer cell growth. This cell line is available to any investigator who wishes these cells. Depending on the experiments, these cells were grown either in 6, 12, 24, or 48-well plates to confluence in RPMI medium containing 10% fetal bovine serum, 2 mM glutamine, 12.5 units/ml penicillin, 6.5 µg/ml streptomycin and 10 nM insulin (RPMI-S) in a humidified CO2 (5%) incubator. At 90% confluency the medium was aspirated. The monolayers washed with ice-cold HHBSS, a fresh volume of medium added and the cells used for the experiments described below.
2.3. Determination of the Effects of α2M* on Protein Synthesis in 1-LN Cells
1-LN cells (300 × 103 cells/well) in 48 well plates were grown in RPMI-S medium in a humidified CO2 (5%) incubator at 37˚C. At about 90% confluence, the medium was aspirated a volume of RPMI-S was added followed by the addition of either buffer or α2M* (50 pM). To each well, was added [3H]leucine and cells were incubated overnight. In experiment where the effect of cell treatment with Torin1 on α2M*-induced protein synthesis was studied, Torin-1 was added (250 nM) 2 h before adding α2M* (50 pM) and [3H]lecine (2 µCi/ml). The reactions were terminated by aspirating the medium and monolayers washed thrice twice with ice-cold 5% TCA, followed by three washings with ice-cold PBS. Cells were lysed in a volume of 1 NaOH (40˚C/2h), protein was estimated and the lysates were counted in a liquid scintillation counter [7,11].
2.4. Determination of the Effects of α2M*-Induced DNA Synthesis in 1-LN Cells
1-LN cells (300 × 103 cells/well) in 48 well plates were grown in RPMI-S medium in a humidified CO2 (5%) incubator at 37˚C. At about 90% confluence, the medium was aspirated a volume of RPMI-S was added followed by the addition of either buffer or α2M* (50 pM). To each well, was added [3H] thymidine (2 µCi/ml) and cells were incubated overnight. In experiments where the effect of celltreatment with Torin1 on α2M*-induced DNA synthesis was studied, Torin1 (250 nM) was added 2h before adding α2M* (50 pM) and [3H]thymidine (2 µCi/ml). The reactions were terminated by aspirating the medium and monolayers washed twice with ice-cold 5% TCA, followed by three washings with ice-cold PBS. Cells were lysed in a volume of 1 NaOH (40˚C/2h), protein was estimated and the lysates were counted in a liquid scintillation counter [7,11].
2.5. Assay of S6-Kinase Phosphorylation to Determine mTORC1 Kinase Activity in Raptor Immunoprecipitates of Prostate Cancer Cells Treated with α2M*
α2M*-induced activation of mTORC1 kinase in prostate cancer cells was determined in Raptor immunoprecipitates of cells by assaying the phosphorylation of S6K1 and 4EBP1 as described earlier [11,42,43]. Briefly, prostate cancer cells (3 × 10⁶ cells/per well in 6-well plates) incubated overnight in RPMI-S medium were washed twice with ice-cold HHBSS and a volume of RPMI-S medium added to each well. After temperature equilibration, cell in the wells were exposed to either buffer, α2M* (50 pM/25 min) or insulin (200 nM/25 min) and incubated as above. Reactions were stopped by aspirating the medium and a volume of CHAPS lysis buffer (Buffer B) containing 40 mM HEPES(pH 7.5), 120 mM NaCl, 1 mM EDTA, 10 mM sodium pyrophosphate, 10 mMβ- glycerophosphate, 0.5 mM sodium orthovanadate, 0.3% CHAPS and a Roche Protease inhibitor cocktail table (1 tablet/10 ml) was added and cells lysed over ice for 15 min. The lysates were transferred to separate Eppendorf tubes, micro-centrifuged (1000 rpm/5 min/4˚C) and supernatants used for protein estimation and immunoprecipitation. Equal amount of lysate proteins (200 - 250 μg) were used for immunoprecipitation with Raptor antibodies (1:50 Santa Cruz cat# 81537), followed by the addition of 40 μl of protein A agarose and contents incubated with rotation overnight at 4˚C. Raptor immunoprecipitates were recovered by centrifugation (2000 rpm/5 min/4˚C) and used for S6K1 phosphorylation.
Raptor immunoprecpitates were washed once with lysis buffer containing 10 mM Tris·HCl, pH 7.2, 0.5% sodium deoxycholate, 0.1% NP-40, 100 mM NaCl, 1 mM EDTA, 1 mM sodium orthovanadate, 2 mM DTT, 10 μg/ml leupeptin and 5 μg pepstatin followed by washing with above buffer without NP 40 and containing 1M NaCl, and finally with buffer containing 50 mM Tris·HCl pH 7.2, 5 mM Tris·base, and 100 mM NaCl. The immunoprecipitates after each wash were recovered by micro-centrifugation (2500 rpm/5 min/4˚C). To these immunoprecipitates, 40 μl of reaction buffer containing 20 mM HEPES, pH 7.2, 10 mM MgCl2, 50 μM ATP and 3 μg substrate peptide were added. The reactions were started by adding 5 μCi of [33P]-γ-ATP. The contents were incubated for 15 min at 30˚C in a shaking water bath. The reactions were stopped by adding a volume of 4x sample buffer and tubes boiled for 5 min, centrifuged, electrophoresed in 12.5% gel transferred to membranes and membrane autoradiographed. Phosphorylated S6K substrate peptide bands were visualized and quantified as above. In experiments where the sensitivity of mTORC1 kinase in Raptor immunoprecipitates towards Torin1 was determined, the cells were pretreated with Torin1 (200 nM/2h) before stimulation with α2M* (50 pM/25 min/ 37˚C) or insulin (200 nM/20 min) and cell lysates processed as above. Other details for autoradiographic visualization of phosphorylation of S6-kinase substrate peptide were as above. We also determined α2M*-induced activation of mTORC1 kinase by assaying the phosphorylation of S6K1 in Raptor immunoprecipitates by Western blotting. Experimentation details were identical to those described above except that to Raptor immunoprecipitates isolated from cells treated as above, was added a volume of 4x sample buffer, tubes boiled, centrifuged, electrophoresed (12.5% gel), transferred to membrane, immunoblotted with anti-S6KT389 antibody andprotein bands quantified as above.
2.6. Determination of mTORC1 Kinase Activity in Raptor Immunoprecipitates towards 4EBP1 Phosphorylation
α2M*-induced phosphorylation of 4EBP1 in prostate cancer cells was determined inRaptor immunoprecipitates of 1-LN cells [11,42,43]. The cells (3 × 10⁶ cells/per well in 6 well plates) were incubated in RPMI-S medium overnight, washed twice with ice-cold HHBSS and a volume of RPMI-S medium added to each well. After temperature equilibration, cell in the wells were exposed to either buffer, α2M* (50 pM/25 min) or insulin (200 nM/25 min) and incubated as above. Reactions were stopped by aspirating the medium and a volume of CHAPS lysis buffer (Buffer B) was added and cells lysed over ice for 15 min. The lysates were transferred to separate Eppendorf tubes, micro-centrifuged (1000 rpm/5 min/4˚C) and supernatants used for protein estimation and immunoprecipitation. In separate experiments, equal amounts of lysate protein (200 - 250 μg) were immunoprecipitated with anti-Raptor antibodies (1:50), followed by the addition of 40 μl of protein G agarose and contents incubated with rotation overnight at 4˚C. Raptor immunoprecipitates were recovered by centrifugation (2000 rpm/5 min/4˚C) and washed twice with lysis buffer B and micro-centrifuged (2500 rpm/5 min/4˚C). Then the respective immunoprecipitates were suspended in 40 μl of kinase buffer containing 10 mM HEPES pH 7.4, 50 mM NaCl, 50 mM β-glycerophosphate, 01. mM EDTA, 1 mM DDT, 20 mM MnCl2, 200 μM ATP and 4 μg 4EBP1. The reactions were initiated by adding 5 μCi of [33P]-γ-ATP, tubes incubated in a shaking water bath for 15 min at 30˚C. The reactions were stopped by adding a volume of 4x sample buffer, tubes boiled for 5 min, and supernatants electrophoresed on 12.5% acrylamide gels transferred to membranes and membrane autoradiographed. The protein bands were quantified as above. In experiments where the sensitivity of mTORC1 kinase in Raptor immunoprecipitates towards Torin1 was determined, the cells were pretreated with Torin1 (250 nM/2h) before stimulation with α2M* (50 pM/25 min/37˚C) or insulin (200 nM/20 min) and cell lysates processed as above. Other details for autoradiographic visualization of phosphorylation of 4EBP1 substrate peptide were as above. We also determined α2M*-induced activation of mTORC1 kinase by assaying the phosphorylation of 4EBP1 in vivo in Raptor immunoprecipitates by Western blotting. Experimentation details were identical to those described above except that to Raptor immunoprecipitates isolated from cells treated as above, was added a volume of 4x sample buffer, tubes boiled, centrifuged, electrophoresed (12.5% gel), transferred to membranes, immunoblotted with anti-p-4EBP1 antibody and protein bands quantified as above.
2.7. Determination of α2M*-Induced Phosphorylation of Akt at Ser473 in Rictor Immunoprecipitates to Measure mTORC2 Activity 1-LN prostate cancer cells (3 × 10⁶ cells/well in 6 well plates) incubated overnight in RPMI-S medium were washed twice with ice-cold HHBSS and a volume of RPMI-S medium added to each well. After temperature equilibration, cells in the respective wells were exposed to either buffer, or α2M* (50 pM/25 min), or insulin (200 nM/25 min) and incubated as above [11,42,43]. Reactions were stopped by aspirating medium and a volume of CHAPS lysis buffer (Buffer B) was added and cells lysed over ice for 15 min. The lysates were transferred to separate Eppendorf tubes, centrifuged (1000 rpm/5 min/40˚C) and supernatants used for protein estimation and immunoprecipitation. Equal amounts of lysate protein (200 - 50 μg) were immunoprecipitated with antiRictor antibodies (1:50, Santa Cruz Cat # 81538), followed by the addition of 40 μl of protein A agarose, and the contents incubated with rotation overnight at 40°C. Rictor immunoprecipitates were washed with lysis buffer B containing 0.5 M NaCl and Tris·HCl (pH 7.4), supplemented with 1 mM DTT, 1 mM PMSF and1 mM benzamidine. The tubes were centrifuged at 2500 rpm for 5 min at 4˚C. To the immunoprecipitates, 40 μl of kinase buffer containing 50 mM Tris·HCl (pH 7.5), 10 mM MgCl2, 1 mM MgCl2, 1 mM DTT, 1 mM PMSF, 1 mM Benzamidine and 20 μl of leupeptin was added followed by the addition of 30 μl of AktSer473 kinase substrate (NH2-RRPHFPQ-FSYSA-COOH) in the respective tubes. In experiments where Torin1 was used, Rictor immunoprecipitates were pre-incubated with 20 nM of Torin for 20 min and then assayed for AktSer473 phosphorylation. The peptide (NH2-GGEEEEYFELVKKKK-COOH (ZAK 3 tide) served as the control. The reaction was initiated by adding 50 μM of ATP and 5 μCi of [33P]-γ-ATP in each tube and tubes incubated for 30 min at 30˚C in a shaking waterbath. The reaction was stopped by the addition of 5 μl of 0.5 M EDTA in each tube, the tubes centrifuged at 3000 rpm for 3 min, 40 μl of each supernatant applied on p81 phosphocellulose paper (Whatman, NJ) allowed to dry and papers washed four times each time by immersing them in 1 liter of 1M phosphoric acid for 3 min. The paper was rinsed with acetone and their radioactivity was counted in a liquid scintillation counter. In preliminary experiments the kinase activity of AktS473 kinase towards control ZAK 3 peptide were always 50% - 60% of buffer control. Hence control peptide activities are not being shown. We also determined the effect of Torin1 on α2M*- and insulin-induced phosphorylation of Akt at Thr308 and Ser473 residues in cell lysates in Western blotting. Cells incubated overnight in RPMI-S medium were treated as above. The reactions were terminated by aspirating the medium and cells lysed over ice in lysis buffer A for 15 min. The lysates transferred to new tubes, centrifuged (1000 rpm/5 min at 4˚C), equal amounts of lysate proteins electrophoresed in 10% gel, protein bands transferred to Hybond-P membranes and the respective membranes were immunoblotted with anti-p-AktThr308 and p-AktSer473 antibodies, respectively. The p-AktThr308 and p-AktSer473 protein bands were quantified in a Storm Phosphorimager [11,42,43].
2.8. Statistical Analysis
Statistical significance of the data was determined by Students “t” test. P Values of 0.05 are considered statistically significant.
3. Results
3.1. Torin1 Inhibits α2M*-Induced Protein and DNA Synthesis in 1-LN Prostate Cancer Cells
During embryogenesis and childhood, periods representing growth, development, and differentiation, significantly increased levels of α2M are seen in plasma [44]. While the liver produces α2M, it is also produced locally in tumor stromal tissues such as associated with tumor growth [7,45]. The circulating concentration of α2M is about 2 - 5 μM and its proteinase activated form may compose ~10% of this pool [1]. Various tumors including aggressive prostate cancer produce metalloproteinases as well as PSA which rapidly convert α2M to α2M* [7,44,45]. Therefore, it could be envisaged that under the conditions that exist in patients harboring prostate cancer, a substantial amount of α2M* is available to bind to cell surface GRP78 thus triggering mitogenic signaling and promoting cellular proliferation [7,11]. In our earlier studies we have shown that binding of α2M* to cell surface GRP78 in prostate cancer cells, causes upregulation of protein and DNA synthesis [3-12]. Ligation of cell surface GRP78 with α2M-NH2 or α2M-PSA also caused cellular proliferation in prostate cancer cells [7]. This cellular response is mediated by upregulation of pro-proliferation and pro-survival RAS·MAPK and PI 3-Akt/mTOR signaling in prostate cancer cells ligated with α2M*. Eukaryotic cells predominantly use Ras/ MAPK, and PI 3-kinase/Akt/mTOR signaling pathways for their survival and proliferation in both physiological and pathological environment. Pretreatment of cells with inhibitors of Ras/MAPK, PI 3-kinase/Akt/mTOR signaling pathways, down regulation of GRP78 gene expression by RNAi or pretreatment of cells with antibodies against the carboxyl-terminal domain of GRP78 significantly suppressed α2M*-induced increased protein and DNA synthesis [3-12]. Notably pretreatment of cells with antibodies directed against the carboxyl-terminal domainof GRP78 antibodies inhibited cell growth of prostate cancer cells and induced apoptosis and increased p53 levels [3-12,46-48]. In this study we have used the active site mTOR inhibitor Torin1 to study its effect on α2M*-induced cellular proliferation as evaluated by protein and DNA synthesis in 1-LN prostate cancer cells (Figures 1 and 2). Pretreatment of cells with Torin1 reduced α2M*-induced protein synthesis ~ twofold (Figure
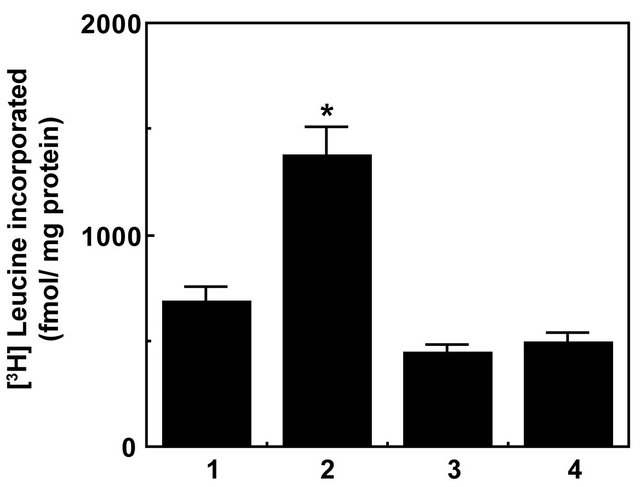
Figure 1. Inhibition of α2M*-induced protein synthesis by Torin-1 in prostate cancer cells.Bars in the diagram are: (1) buffer; (2) α2M* (50 pM); (3) Torin1 (250 nM/2h); and (4) Torin1 then α2M*. The incorporation of [3H]leucine into cell proteins is expressed as fmol incorporated/mg protein, and is the mean ± SE from three experiments. Values significantly different at the 5% level from α2M*-treated cells are marked with an asterisk (*).
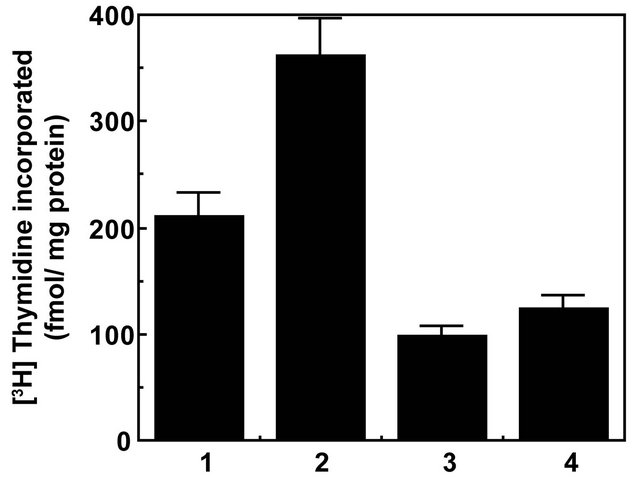
Figure 2. Torin1 inhibits α2M*-induced DNA synthesis in prostate cancer cell. The bars in the diagram are: (1) buffer; (2) α2M* (50 pM); (3) Torin1 (250 nM/2 h); and (4) Torin1 then α2M*. The incorporation of [3H]thymidine into cells is expressed as fmol incorporated/mg protein and is the mean ± SE from three experiments. Values significantly different from α2M* treated cells are marked with an asterisk (*).
1) and DNA synthesis ~1.8-fold, both statistically significant effects (Figure 2). Similar reductions in α2M*- induced increased protein and DNA synthesis were observed in cells pretreated with inhibitors of MAPK, PI 3-kinase and mTOR. Down regulation of cell surface GRP78 with either RNAi or pretreatment of cells with antibodies against the carboxyl-terminal domain of GRP78 also caused severe reductions in α2M*-induced protein and DNA synthesis which were comparable to those observed in Torin1 treated cells [3-12,46,48]. Since Torin1 inhibits both mTORC1 and mTORC2 complexes, one can suggest that like mTORC1, mTORC2 plays a role in cell proliferation. There is increasing evidence that mTORC2 plays an important role in promoting tumorigenesis. Many gliomas overexpress Rictor and forced expression of Rictor promotes mTORC2 assembly and activity and endows cancer cells with increased proliferative and invasive potential [32,49].
3.2. α2Mand Insulin-Induced Activation of mTORC1 and Phosphorylation of Its Downstream Effectors S6K1 and 4EBP1 Is Inhibited by Torin
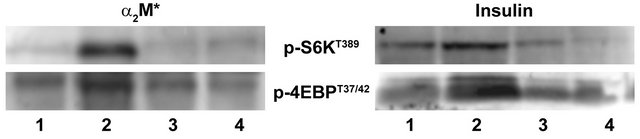
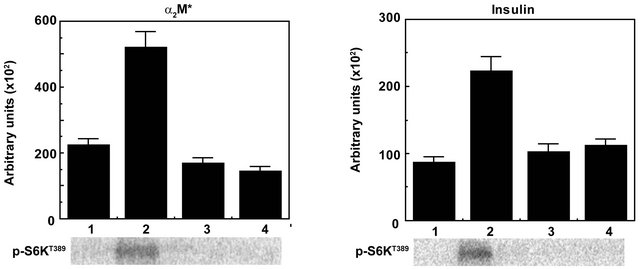
mTOR controlled protein biosynthesis is coordinately regulated by the mTORC1-4EBP1 axis [27-33]. The mTORC1-4EBP1 axis controls steps in initiation of cap-dependent translocation by assembling the eIF4E complexes [see 30-33 and references therein]. mTORC1 is activated by insulin, α2M*, and other growth factors via a PI-3-kinase-controlled pathway involving Akt-mediated phosphorylation of PRAS40 and Tsc1/2 and activation of Rheb·GTPase [see 27,28,29, and references therein]. The role of the mTORC1-S6K axis in translational control is less defined [30-33]. In response to mTORC1 activating stimuli, mTORC1 binds to eIF3 where it phosphorylates S6K and 4EBP1. mTORC1- mediated phosphorylation of 4EBP1 induces its dissociation from eIF4E and dissociation of S6K from eIF3. 4EBP1 dissociation enables binding of eIF4G to eIF4E and recruitment of eIF4A and formation of eIF4F complex composed of eIF4G and eIF4A. This complex then recruits 40S ribosomes and ternary complexes composed of eI4FE, met-tRNA and GTP to the 5’-cap to form the 48S translation pre-initiation complex. Upon mTORC1- mediated dissociation of S6K1 from eIF3, active S6K phosphorylates several substrates that function in translation initiation as well as other steps that drive protein synthesis [see 30,31 and references therein]. Deregulation of protein synthesis down stream of mTORC1 at the level of 4EBP1/eIF4E plays a role in tumor formation. Loss of 4EBP1/2 and concomitant activation of cap-dependent translation promotes cell cycle progression and cell proliferation [30,31]. 4EBP1/eIF4E also mediates the effect of Akt signaling in mRNA translation, cell growth and tumor progression. eIF4E affects proliferation and tumorigenesis by promoting the translation specific mRNAs coding pro-oncogenic proteins regulating cell survival, cell cycle progression, angiogenesis, energy metabolism, and metastasis [32]. Expression of eIF4E is elevated in a large number of malignancies including breast, colon, and prostate cancer [see 30-33]. Hyperactivation of eIF4E in cancer is consequence of upregulation of its expression and/or alterations in signaling pathways that are frequently impaired in cancer. eIF4E levels are highly elevated in human prostate cancer where they positively correlate with Gleason scores [50]. eIF4E binding protein 4EBP1/2 controls the activity of eIF4E by binding to the same site as eIF4G, thus preventing association of eIF4E with eIF4G and eIF4F complex assembly which reduces cap-dependent association of eIF4E with eIF4G and eIF4F complex assembly which reduces cap-dependent translation initiation. mTORC1 phosphorylates 4EBPs causing their dissociation from eIF4E [see 30-33]. Activation mTORC1 leads to phosphorylation of 4EBP1 on Thr37 and Thr46 which promotes its phosphorylation on Thr70 and Ser65 leading to its dissociation from eIF4E. In the preceding section we demonstrate that α2M*-induced cellular proliferation as measured by protein and DNA synthesis is strongly inhibited by the Torin1 (Figures 1 and 2). Since the mTORC1 complex controls protein biosynthesis by activating its direct downstream effectors S6K and 4EBP1 byphosphorylation, we next determined the effect of preincubating cells with Torin1 on α2M*-induced phosphorylation of S6Kand 4EBP1 in prostate cancer cell. Insulin is widely used in studies on mTORC1 and mTORC2 signaling in various contexts; therefore, we have used insulin as a positive control in these studies. Pretreatment of prostate cancer cells with Torin1 nearly abolished α2M*-induced phosphorylation of S6K at Thr389 and 4EBP1 at Thr37 and Thr46 as measured by Western blotting (Figures 3(a) and (b)). Pretreatment of cells with Torin1 also reduced insulin-dependent phosphorylation of S6K1at Thr389 and 4EBP1 at Thr37 and Thr46. We also evaluated the specificity of α2M*- and insulin-induced phosphorylation of S6K and 4EBP1 by Torin1 in Raptor immunoprecipitates by assay of mTORC1 kinase activity (Figure 4). Torin1 treatment completely blocked mTORC1 kinase activity as determined by autoradiographic analyses of S6K and 4EBP1 phosphorylation in α2M* and insulin-stimulated cells (Figures 4(a)-(d)). Rapamycin only partially inhibits the phosphorylation of 4EBP1 [35-41]. The presence of numerous negative feedback loops in mTOR pathway may contribute to limit the efficacy of rapalogs [35-41]. ATP-competitive inhibitors of mTOR block the phosphorylation of all known downstream targets of mTORC1 and mTORC2. These inhibitors impair cell growth and proliferation in vitro and tumor growth in vivo to a much greater degree than rapamycin [see 32]. In mTORC2 deficient cells active site inhibitors cause a greater reduction in proliferation than rapamycin. These inhibitors unlike rapamycin, completely block 4EBP1 phosphorylation which results in greater inhibition of cap-dependent translation. mTOR kinase inhibitor inducessignificantly broader transcriptional responses than
 (a) (b)
Figure 3. Inhibition of mTORC1 kinase as determined by phosphorylation of S6K at T389 and 4EBP1 at T37/42 by Torin in Raptor immunoprecipitates of 1-LN cells stimulated with α2M* or insulin by Western blotting. A representative immunoblot of p-S6KT389 and p-4EBP1T37/42 from three experiments is shown. The lanes in left panel are: (1) buffer; (2) α2M* (50 pM/25 min); (3) Torin1 (250 nM/2 h); and (4) Torin1 then α2M*. The lanes in right panel are: (1) Buffer; (2) Insulin (200 nM/15 min); (3) Torin1 (250 nM/2 h); and (4) Torin1 then insulin.
 (a)
(a)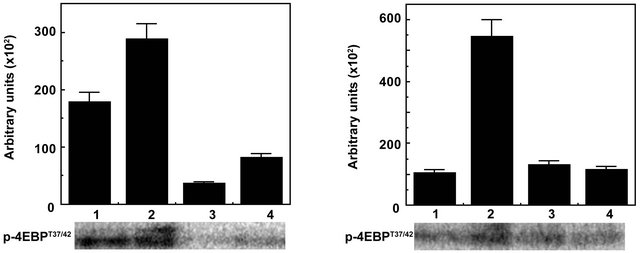 (b)
(b)
Figure 4. Inhibition of mTORC1 kinase by Torin in Raptor immunoprecipitates of 1-LN cells treated withα2M* and insulin by kinase assay. The bars in left panel are: (1) Buffer; (2) α2M* (50 pM/25 min); (3) Torin1 (250 nM/2h); and (4) Torin1 then α2M*. The bars in right panel are: (1) Buffer; (2) Insulin (200 nM/15 min); (3) Torin (250 nM/2 h); and (4) Torin then insulin. The incorporation of [33P]-γ-ATP into S6K and 4EBP1 in both panels are estimated by autoradiography is expressed in arbitrary units and is the mean ± SE from 3 - 4 experiments. A representative autoradiograph of p-S6K and p-4EBP1 from 3 - 4 experiments is shown below the respective bars diagram. Values significantly different from α2Mor insulin-treated cells at the 5% level are marked by an asterisk (*).
rapamycin. Many genes with roles in tumor biology and metabolism are only affected by complete mTOR inhibition [51].
3.3. Torin1 Inhibits α2M*- and Insulin-Induced Phosphorylation of Akt at Thr308 and Ser473 Residues in Prostate Cancer Cells
In our earlier reports we have shown that stimulation of prostate cancer cells with α2M*-promoted cell growth, cell proliferation and cell survival by activating Ras/ PI3-kinase/Akt/mTORC1 or mTORC2 signaling similar to that of insulin treatment [3-12]. Phosphorylation of Akt at Ser473 was inhibited by PI 3-kinase inhibitors but not that by acute treatment of rapamycin [3-12]. In view of the critical importance of AktS473 in cell proliferation and survival and ineffectiveness of rapamycin in inhibiting AktS473 phosphorylation, active site inhibitors of mTOR have been used and shown to completely inhibit phosphorylation of Akt on Thr308 and Ser473 sites [35-41]. In this study we have measured full activation of Akt by quantifying levels of p-AktThr308 and p-AktSer473 by Western blotting in prostate cancer cells pretreated with Torin1 prior to stimulation with α2M* or insulin (Figures 5(a)-(d)). We have also measured mTORC2 activation by phosphorylation of Akt on Ser473 residue in Rictor immunoprecipitates of 1-LN cells pretreated with Torin1 and stimulated with α2M* or insulin (Figure 6). Torin1 significantly inhibited α2M* or insulin-induced phosphoprotein levels of p-AktThr308 and p-AktSer473 (Figure 5) as well as mTORC2 activity as measured by kinase assay (Figure 6). These results are similar to those reported in literature on inhibition of malignant cell growth, cell proliferation and mTOR Torin. We conclude that like antibodies againstthe carboxyl-terminal domainof GRP78 (an upstream inhibitor) Torin1 (a downstream inhibitor) effectively inhibits α2M*-induced cellular growth and proliferation of prostate cancer cells exhibiting GPR78 on their cell surface.
4. Discussion
Human α2-macroglobulin (α2M) is a tetrameric protein consisting of four identical Mr ~ 189,000 subunits. It is a broad spectrum proteinase inhibitor expressed in all mammals. α2M is synthesized by many cells including hepatocytes and macrophages [1]. Tumors and their stroma also produce α2M and various proteinases. Prostate cancer stroma secretes a large amount ofα2M which is linked to tumor growth [see 7 and references therein]. The circulating concentration of α2M is proximately about 1 - 5 μM and its proteinase activated form, α2M*, may comprise ~10% of the α2M pool. Through coupling of GRP78 with several classes of G proteins, α2M* triggers pro-proliferative, pro-survival and pro-migratory signaling cascades in tumor cells [see 3-12]. In view of the pivotal importance of mTOR signaling in malignant cell proliferation and metastasis, we have studied the effect of Torin1 on α2M*-induced cellular proliferation in 1-LN prostate cancer cells. The salient point of this study are: (1) Torin1 inhibited α2M*-induced 1-LN prostate cancer cell growth as determined by protein and DNA synthesis; (2) Torin1 inhibited α2M*-induced mTORC1 activation as measured by levels of p-S6KT389 and p-4EBP1T37/42 by immunoblotting and mTOR kinase assays; (3) Torin1 inhibited α2M*-induced increased phosphorylation of Akt1 at Thr308 and Ser473 as measured by immunoblotting; and (4) Torin1 inhibited α2M*-induced activation of mTORC2 as measured by phosphorylation of Akt at Ser473 by kinase assay of Rictor immunoprecipitates.
Genetic and pharmacological studies have shown that mTORC1 activation promotes cell proliferation and the mTOR pathway is important in cancer pathogenesis [see 29-33]. Many components of PI 3-kinase signaling pathway upstream of mTORC1 and mTORC2 are mutated in human cancers. The loss of p53 also promotes mTORC1 activation. Hyperactivation of mTOR signaling frequently occurs in cancer, therefore targeting mTOR is one of the most attractive anticancer therapeutic strategies in the treatment of cancer. Rapamycin and rapalogs are first generation inhibitors of mTOR [35-41, 52]. Second generation mTOR inhibitors are small molecule that target the kinase domain of mTOR and inhibit both mTORC1 and mTORC2 complexes. In recent years several potent and selective ATP-competitive mTOR inhibitors such as Torin1 [39], PP242 [38], KU63794 [40], and WYE354 [41] have been developed. Enzymatic and cellular assays show that all four compounds are potent inhibitors of mTORC1 and mTORC2, with Torin1 exhibiting ~20 fold greater potency for inhibition of mTORC1 relative to other inhibitors. Torin1 also shows a sustained inhibition of mTOR at nM concentrations compared to others and very few off target effects [53]. Many gliomas overexpress Rictor and over expression of Rictor promotes mTORC2 assembly and activity endowing cancer cells with increased proliferative and invasive potential [32,49].
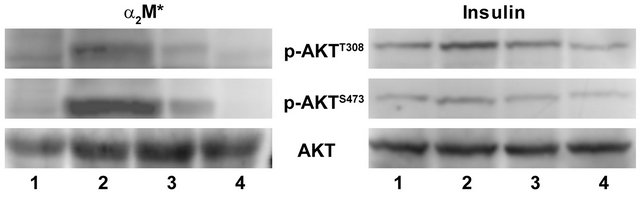
Figure 5. Inhibition ofα2M* and insulin-induced phosphorylation of Akt at T308 and S473 residues by Torin in 1-LN cells by Western blotting. The treatment of cells is as in Figures 3 and 4. A representative immunoblot of Akt phosphorylated at T308 and S473 from 3 - 4 experiments is shown.
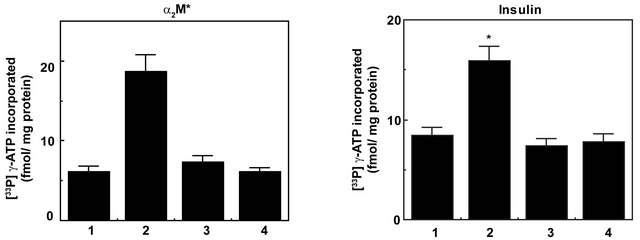
Figure 6. A bar diagram showing Torin1 inhibition of mTORC2 activation in α2M* or insulin stimulated 1-LN prostate cancer cells as determined by phosphorylation of Akt at S473 by kinase assay. The treatment of cells is as in Figure 5. The activation of mTORC2 is expressed as fmol [33P]-γ-ATP incorporated/mg protein and is the mean ± SE from 3 - 4 experiments. Values significantly different from treated cells at the 5% level are marked with an asterisk (*).
We have previously demonstrated that either α2M* generated in the local environment of prostate cancer or an auto-antibody against the α2M* binding site in GRP78 trigger pro-proliferative and anti-apoptotic signaling cascades [7]. Studies by Arap et al. and in our laboratory demonstrate that the occurrence of these auto-antibodies in the serum of patients with prostate cancer correlate with a poor disease outcome [14,15]. More recently we have demonstrated that α2M* activates both mTORC1 and mTORC2 pathways [11]. This leads us to conclude that inhibitors which target only mTORC1 may not be significantly effective in treating prostate cancer.
REFERENCES
- J. P. Hart and S. V. Pizzo, “α-Macroglobulins and Kunins,” In: R. W. Coleman, A.W. Clowes, S. Z. Goldhuber, V. J. Marder and J. N. George, Eds., Hemostasis and Thromboses, Basic Principles, and Clinical Practice, 5h Edition, Chapter 21, Williams and Wilkins, Lippincott, pp. 395- 407.
- U. K. Misra, M. Gonzalez-Gronow, G. Gawdi, J. P. Johnson and S. V. Pizzo, “The Role of GRP78 in Alpha- 2-Macroglobulin-Induced Signal Transduction. Evidence from RNA Interference That the Low Density Lipoprotein Receptor Related Protein Is Associaetd with but Not Necessary for GRP78-Mediated Signal Transformation,” The Journal of Biological Chemistry, Vol. 277, No. 44, 2002, pp. 42082-42087. doi:10.1074/jbc.M206174200
- U. K. Misra and S. V. Pizzo, “Potentiation of Signal Transduction Mitogenesis and Cellular Proliferation upon Binding of Receptor-Recognized Forms of Alpha-2-Macroglobulin to 1-LN Prostate Cancer Cells,” Cell Signal, Vol. 16, No. 4, 2004, pp. 487-496. doi:10.1016/j.cellsig.2003.09.010
- U. K. Misra, M. Gonzalez-Gronow, G. Gawdi, F. Wang and S. V. Pizzo, “A Novel Receptor Function for the Heat Shock Protein GRP78: Silencing of GRP78 Gene Expression Attenuates Alpha-2-M*-Induced Signaling,” Cell Signal, Vol. 16, No. 8, 2004, pp. 929-938. doi:10.1016/j.cellsig.2004.01.003
- U. K. Misra, R. Deedwania and S. V. Pizzo, “Binding of Activated Alpha-2-Macroglobulin to Its Cell Surface Receptor GRP78 in 1-LN Prostate Cancer Cells Regulates PAK-2-Dependent Activation of LIMK,” The Journal of Biological Chemistry, Vol. 280, No. 28, 2005, pp. 26278- 27286. doi:10.1074/jbc.M414467200
- U. K. Misra, R. Deedwania and S. V. Pizzo, “Activation and Cross-Talk between Akt NFkB and Unfolded Protein Response Signaling in 1-LN Prostate Cancer Cells Consequent to Ligation of Cell Surface-Associated GRP78,” The Journal of Biological Chemistry, Vol. 281, No. 19, 2006, pp. 13694-13707. doi:10.1074/jbc.M511694200
- U. K. Misra, S. Payne and S. V. Pizzo, “Ligation of Prostate Cancer Cell Surface GRP78 Activates a Pro-Proliferative and Anti-Apoptotic Feedback Loop: A Role for Secreted Prostate Specific Antigen,” The Journal of Biological Chemistry, Vol. 286, No. 2, 2011, pp. 1248-1259. doi:10.1074/jbc.M110.129767
- U. K. Misra, T. Sharma and S. V. Pizzo, “Ligation of Cell Surface-Associated Glucose Regulated Protein 78 by Receptor-Recognized Forms of Alpha-2-Macroglobulin: Activation of p21-Activated Protein Kinase-2-Dependent Signaling in Murine Peritoneal Macrophages,” The Journal of Immunology, Vol. 175, No. 4, 2005, pp. 2225- 2233.
- U. K. Misra, Y. Mowery, S. Kaczowka and S. V. Pizzo, “Ligation of Cell Surface GRP78 with Antibodies Directed against Its Carboxyl Terminal Domain Upregulates p53 Activity and Promotes Apoptosis,” Molecular Cancer Therapeutics, Vol. 8, No. 5, 2009, pp. 1350-1362. doi:10.1158/1535-7163.MCT-08-0990
- U. K. Misra and S. V. Pizzo, “Ligation of Cell Surface GRP78 with Antibodies Directed against the Carboxyl Terminal Domain of GRP78 Suppresses Ras/MAPK and PI-3K/Akt Signaling, While Promoting Caspase Activation in Human Prostate Cancer Cells,” Cancer Biology & Therapy, Vol. 9, No. 2, 2010, pp. 142-152. doi:10.4161/cbt.9.2.10422
- U. K. Misra, and S. V. Pizzo, “Receptor-Recognized 2-Macroglobulin Binds to Cell Surface-Associated GRP78 and Activates mTORC1 and mTORC2 Signaling in Prostate Cancer Cells,” PloS One, Vol. 7, No. 12, 2012, Article ID: e51735. doi:10.1371/journal.pone.0051735
- U. K. Misra and S. V. Pizzo, “Modulation of Unfolded Protein Response in Prostate Cancer Cells by Carboxyl Terminal Domain of GRP78,” Apoptosis, Vol. 15, No. 2, 2010, pp. 173-182. doi:10.1007/s10495-009-0430-y
- P. J. Mintz, J. Kim, K. A., Do, X. Wang, R. G. Zinner, M. Cristofanilli, M. A. Arap, W. K. Hong, P. Troncoso, C. J. Logethetis, R. Pasqualini and W. Arap, “Fingerprinting the Circulating Repertoire of Antibodies from Cancer Patients,” Nature Biotechnology, Vol. 21, No. 1, 2003, pp. 57-63.doi:10.1038/nbt774
- M. A. Arap, J. Lahdenranta, J. Mintz, P. J. Hajitou, A. S. Sarkis, W. Arap and R. Pasqualini, “Cell Surface Expression of the Stress Response Chaperone GRP78 enables Tumor Targeting by Circulating Ligands,” Cancer Cell, Vol. 6, No. 3, 2004, pp. 275-284. doi:10.1158/0008-5472.CAN-06-1721
- M. Gonzalez-Gronow, M. Cuchacovich, C. Llanos, C. Urzua, C. G. Gawdi and S. V. Pizzo, “Prostate Cancer Cell Proliferation in Vitro Is Modulated by Antibodies against Glucose-Regulated Protein 78 Isolated from Patient Serum” Cancer Research, Vol. 66, No. 23, 2006, pp. 11424-11431. doi:10.1158/0008-5472.CAN-06-1721
- M. Gonzalez-Gronow, S. V. Pizzo and U. K. Misra, “GRP78 (BiP): A Multifunctional Cell Surface Receptor,” In: B. Henderson and A. G. Pockley, Eds., Cellular Trafficking of Cell Stress Proteins in Health and Diseases, Springer Science Business Media, Dordrecht, 2013, pp. 229-242.
- G. de Ridder, R. Ray and S. V. Pizzo, “A Murine Monoclonal Antibody Directed against the Carboxyl-Terminal Domain of GRP78 Suppresses Melanoma Growth in Mice,” Melanoma Research, Vol. 22, No. 3, 2012, pp. 225-235. doi:10.1097/CMR.0b013e2835312fd
- E. Fayard, G. Xue, A. Parcellier, A. L. Bozulic and B. A. Hemmings, “Protein Kinase B (PKB/Akt) a Key Mediator of the PI 3-K Signaling Pathway,” Current Topics in Microbiology and Immunology, Vol. 346, 2010, pp. 31-56. doi:10.1007/82_2010_58
- D. D. Sarbassov, D. A. Guertin, S. M. Ali and D. M. Sabatini, “Phosphorylation and Regulation of Akt/PkB by the Rictor-mTOR Complex,” Science, Vol. 307, No. 5712, 2005, pp. 1098-1101. doi:10.1126/science.1106148
- M. Andjelkovic, M. D. R. Alessi, R. Meier, A. Fernandez, N.-J. Lamb, M. Frech, P. Cron, P. Cohen P, J. M. Lucocq and B. A. Hemmings, “Role of Translocation in the Activation and Function of Protein Kinase B,” The Journal of Biological Chemistry, Vol. 272, No. 50, 1997, pp. 31515- 31524. doi:10.1074/jbc.272.50.31515
- V. Facchinetti, W. Ouyang, H. Wei, N. Soto, A. Lazorchak, C. Gould, C. Lowry, A. C. Newton, Y. Mao, R. Q. Miao, W. C. Sessa, J. Qin, P. Zhang, B. Su and E. Jacinto, “The Mammalian Targeted Rapamycin Complex 2 Targeted Rapamycin Complex-2 Controls Folding and Stability of Akt and Protein Kinase C,” EMBO Journal, Vol. 27, No. 14, 2008, pp. 1932-1943. doi:10.1038/emboj.2008.120
- M. L. Chen, P. Z. Xu, X. D. Peng, W. S. Chen, G. Guzman, X. Yang, A. DiCristofano, P. P. Pandolfi and N. Hay, “The Deficiency of Akt Is Sufficient to Suppress Tumor Development in Pten +/− Mice,” Genes & Development, Vol. 20, No. 12, 2006, pp. 1569-1574. doi:10.1101/gad.1395006PMid:16778075
- S. N. Malik, M. Brattian, D. M. Ghosh, D. A. Troyer, T. Prihoda, R. Bedolla and J. I. Kreisberg, “Immunohistochemical Demonstration of Phospho-Akt in High Gleason Grade Prostate Cancer,” Clinical Cancer Research, Vol. 8, No. 4, 2002, pp. 1168-1171.
- Y. Liao, R. Grobholz, R. U. Abed, L. Trojan, M. S. Michel, P. Angel and D. Mayer, “Increase of Akt/PKB Expression Correlates with Gleason Pattern in Human Prostate Cancer,” International Journal of Cancer, Vol. 107, No. 4, 2003, pp. 676-680. doi:10.1002/ijc.11471
- G. Ayala, T. Thompson, G. Yang, A. Frolov, A. R. Li, P. Scardino, M. Ohori, T. Wheeler and W. Harper, “High Levels of Phosphorylated Form of Akt-1 in Prostate Cancer and Non-Neoplastic Prostate Tissues Are Strong Predictors of Biochemical Recurrence,” Clinical Cancer Research, Vol. 10, No. 19, 2004, pp. 6572-6578. doi:10.1158/1078-0432.CCR-04-0477
- J. I. Kreisberg, S. Malik, T. J. Prihoda, R. G. Bedolla, D. H. Troyer, S. Kreisberg and P. M. Ghosh, “Phosphorylation of Akt (Ser473) Is an Excellent Predictor of Poor Clinical Outcome in Prostate Cancer,” Cancer Research, Vol. 64, No. 15, 2004, pp. 5232-5238. doi:10.1158/0008-5472.CAN-04-0272
- R. Zoncu, A. Efeyan and D. M. Sabatini, “mTOR from Growth Signal Integration to Cancer Diabetes and Aging,” Nature Reviews Molecular Cell Biology, Vol. 12, No. 1, 2011, pp. 21-35. doi:10.1038/nrm3025
- J. L. Yecies and B. D. Manning, “mTOR Links Oncogenic Signaling to Tumor Cell Metabolism,” Journal of Molecular Medicine, Vol. 9, No. 1, 2011, pp. 221-228. doi:10.1007/s00109-011-0726-6
- C. A. Sparks and D. A. Guertin, “Targeting mTOR: Prospects for mTOR Complex 2 Inhibitors in Cancer Therapy,” Oncogene, Vol. 29, No. 26, 2010, pp. 3733-3744. doi:10.1038/onc.2010.139
- G. Magnuson, B. Ekim and D. C. Fingar, “Regulation and Function of Ribosomal Protein S6-Kinase (S6K) within mTOR Signaling Network,” Biochemical Journal, Vol. 441, No. 1, 2012, pp. 1-21. doi:10.1042/BJ20110892
- O. Larsson, B. Tian and N. Sonenberg, “Toward a Genome-Wide Landscape of Translational Control,” Cold Spring Harbor Perspectives in Biology, Vol. 5, No. 1, 2013, p. a0132302. doi:10.1101/cshperspect.a012302
- M. Laplante and D. M. Sabatini, “mTOR Signaling in Growth Control and Disease,” Cell, Vol. 149, No. 2, 2012, pp. 274-293. doi:10.1016/j.cell.2012.03.017
- X. M. Ma and J. Blenis, “Molecular Mechanisms of mTOR-Mediated Translational Control,” Nature Reviews Molecular Cell Biology, Vol. 10, No. 5, 2009, pp. 307- 318. doi:10.1038/nrm2672
- V. Zinzalla, V. D. Stracka, D. W. Oppliger and M. N. Hall, “Activation of mTORC2 by Association with the Ribosome Cell,” Cell, Vol. 144, No. 5, 2011, pp. 757-768. doi:10.1016/j.cell.2011.02.014
- J. Dancey, “mTOR Signaling and Drug Development in Cancer,” Natural Reviews. Clinical. Oncology, Vol. 7, No. 4, 2010, pp. 209-219. doi:10.1038/nrclinonc.2010.21
- A. Gomez-Pinillos and A. C. Ferrari, “mTOR Signaling Pathways on mTOR Inhibitors in Cancer Therapy,” Hematology/Oncology Clinics of North America, Vol. 26, No. 3, 2012, pp. 483-505. doi:10.1016/j.hoc.2012.02.014
- S. A. Wander, B. Hennessy and J. M. Slingerland, “Next Generation mTOR Inhibitors in Clinical Oncology: How Pathway Complexity Informs Therapeutic Strategy,” The Journal of Clinical Investigation, Vol. 121, No. 4, 2011, pp. 1231-1241. doi:10.1172/JCI44145
- M. E. Feldman, B. Apsel, B. A. Uotilla, R. Loewith, Z. A. Knight, D. Ruggero and K. M. Shokat, “Active-Site Inhibitors of mTOR Target Rapamycin-Resistant Outputs of mTORC1 and mTORC2,” PloS Biology, Vol. 71, No. 2, 2009, p. e38.
- C. Thoreen, S. A. Kang, J. W. Chang, Q. Liu, J. Zhang, Y. Gao, L. J. Reichling, Sim T., D. M. Sabatini and N. S. Gray, “An ATP Competitive Mammalian Target of Rapamycin Inhibitor Reveals Rapamycin-Resistant Functions of mTORC1,” The Journal of Biological Chemistry, Vol. 284, No. 12, 2009, pp. 8023-8032. doi:10.1074/jbc.M900301200
- J. M. Garcia-Martinez, J. Moran, R. G. Clarke, R. G. A. Gray, S. C. Cosulich, C. M. Chresta and D. R. Alessi, “KU-0063794 Is a Specific Inhibitor of the MammalianTarget of Rapamycin (mTOR),” Biochemical Journal, Vol. 421, No. 1, 2009, pp. 29-42. doi:10.1042/BJ20090489
- K. Yu, L. Toral-Barza, C. Shi, W. G. Zhang, J. Lucas, B. Shor, J. Kim, J. Verheijen, K. Curran, D. J. Malwitz, D. C. Cole, J. Ellingboe, S. Ayral-Kaloustian, T. S. Mansour, J. J. Gibbons, R. T. Abraham, P. Nowak and A. Zask, “Biochemical Cellular and in Vivo Activity of Novel ATP Competitive and Selective Inhibitors of the Mammalian Targeted Rapamycin,” Cancer Research, Vol. 69, No. 15, 2009, pp. 6232-6246.
- U. K. Misra and S. V. Pizzo, “Epac1-Induced Cellular Proliferation in Prostate Cancer Cells Is Mediated by B-Raf-ERK and mTOR Signaling Cascades,” Journal of Cellular Biochemistry, Vol. 108, No. 4, 2009, pp. 998- 1011. doi:10.1002/jcb.22333
- U. K. Misra and S. V. Pizzo, “Upregulation of mTORC2 Activation by the Selective Agonist of Epac-8-CPT-2MecAMP in Prostate Cancer Cells: Assembly of a Multiprotein Signaling Complex,” Journal of Cellular Biochemistry, Vol. 113, No. 5, 2012, pp. 1488-1500. doi:10.1002/jcb.24018
- W. Borth, “Alpha-2-Macroglobulin, a Multifunctional Binding Protein with Targeting Characteristics,” FASEB, Vol. 6, No. 15, 1992, pp. 3345-3353.
- A. Otto, J. Bar and G. Birkenmeier, “Prostate-Specific Antigen Forms Complexes with Human Alpha-2-Macroglobulin and Binds to the Alpha-2-Macroglobulin Receptor/LDL Receptor-Related Protein,” The Journal of Urology, Vol. 159, No. 1, 1998, pp. 297-303. doi:10.1016/S0022-5347(01)64085-0
- U. K. Misra, S. Kaczowska and S. V. Pizzo, “Inhibition of NF-Kappa B1 and NF-Kappa B2 Activation in Prostate Cancer Cells Treated with Antibody against Car-boxylTerminal Domain of GRP78: Effected p53 Upregulation,” Biochemical and Biophysical Research Communications, Vol. 392, No. 4, 2010, pp. 538-542. doi:10.1016/j.bbrc.2010.01.058
- U.K. Misra and S.V. Pizzo, “Modulation of the Unfolded Protein Response in Prostate Cancer Cells by AntibodyDirected against the Carboxyl Terminal Domain of GRP78,” Apoptosis, Vol. 15, No. 2, 2010, pp. 173-182. doi:10.1007/s10495-009-0430-y
- U. K. Misra and S. V. Pizzo, “AFT-Alpha Inhibit Antibody-Induced Activation of p53 and p20-Apoptotic Signaling in 1-LN Prostate Cancer Cells,” Biochemical and Biophysical Research Communications, Vol. 391, No. 1, 2010, pp. 272-276. doi:10.1016/j.bbrc.2009.11.048
- J. Masri, A. Bernath, J. Martin, O. D. Jo, R. Vartanian, A. Funk and J. Gera, “ mTORC2 Activity Is Elevated in Gliomas and Promotes Growth and Cell Motility via Overexpression of Rictor,” Cancer Research, Vol. 67, No. 24, 2007, pp. 11712-11720. doi:10.1158/0008-5472.CAN-07-2223PMid:18089801
- L. Furic, L. Rong, O. Larsson, I.-H. Kohmakpayi, K. Yoshida, A. Brueschke, E. Petroulakis, E. Robichand, N. Pollak, M. Gaboury, P. D. Pondolfi, F. Saad and N. Sonenberg, “eIF4E Phosphorylation Promotes Tumorigenesis and Is Associated with Prostate Cancer Progression,” Proceedings of the National of Academy of Sciences of USA, Vol. 107, No. 32, 2010, pp. 14134-14139.
- X. Wang, Z. Hu, J. Hu, J. Du and W. E. Mitch, “Insulin Resistance Accelerates Muscle Protein Degradation: Activation of Ubiquitin-Proteosomes Pathway by Defects in Muscle Cell Signaling,” Endocrinology, Vol. 147, No. 9, 2006, pp. 4160-4168. doi:10.1210/en.2006-0251 doi:10.1210/en.2006-0251PMid:16777975
- D. Benjamin, M. Colombi, C. Moroni and M. N. Hall, “Rapamycin Passes the Torch: A New Generation of mTOR Inhibitors,” Nature Reviews, Drug Discovery, Vol. 10, No. 11, 2011, pp. 868-880.
- Q. Liu, S. Kirubakaran, W. Hur, M. Niepel, K. Westover, C. Thoreen, J. Wang, J. Ni, M. P. Patricelli, K. Vogel, S. Riddle, D. L. Waller, R. Traynor, T. Sanda, Z. Zhao, S. A. Kang, J. Zhao, K. A. T. Look, P. K. Sorger, D. N. Sabatini and N. S. Gray, “Kinome-Wide Selectivity Profiling of ATP-Competitive Mammalian Target of Rapamycin (mTOR) Inhibitors and Characterization of Their Binding Kinetics,” The Journal of Biological Chemistry, Vol. 287, No. 13, 2012, pp. 9742-9752.