Positioning
Vol.4 No.2(2013), Article ID:31527,10 pages DOI:10.4236/pos.2013.42020
New Technology Going Up from the GPS Measurements, Known W0 and Its Possible Utilization in Praxis
![]()
1Institute of Geodesy, Faculty of Civil Engineering, Brno University of Technology, Brno, Czech Republic; 2National Hydrocarbons Corporation, Yaoundé, Cameroon.
Email: vatrt.v@fce.vutbr.cz, pospisil.l@fce.vutbr.cz, jploule@yahoo.com
Copyright © 2013 Viliam Vatrt et al. This is an open access article distributed under the Creative Commons Attribution License, which permits unrestricted use, distribution, and reproduction in any medium, provided the original work is properly cited.
Received December 5th, 2012; revised January 4th, 2013; accepted January 18th, 2013
Keywords: VTT Technology; Gravity Method; Density Deviation; Western Carpathians; Central African Rifts
ABSTRACT
New height precise Earth Geopotential Model EGM08 made it possible to develop the value of the geoidal geopotential W0. This value is independent on Earth’s tides and others disturbances, therefore it can be used as basic quantity for many applications. Value W0 represents mean sea surface. W0 was developed from data of satellite altimetry which monitores actual ocean’s surface. This value is one of the four fundamental geodetic constants. This value has been accepted worldwide and is included to the International Earth Rotation and Reference Systems Service Conventions (IERS Conventions) 2003, 2007. This value defines in principle parameters of level ellipsoid  which best fit to the surface defined by W0. The body of this level ellipsoid produces normal gravity. We developed other important parameters for determination of the density deviations (VTT technology), i.e. values of normal gravity ge at the equator and gp at the pole on the elipsoid E0 and the value of parameter β. All parameters above used for development of VTT technology are supplied by GPS/leveling data that enable to create so-called density deviation maps at any place in the World. In comparison with gravity anomalies, the density deviations represent more precise density anomalous places in the Earth’s crust. A construction of density deviation map is applied at two from geologically different regions—the Western Carpathians and the Central African Rifts.
1. Introduction
Relationship between Gravity survey versus VTT method is simply displayed by Figure 1. By gravity measurements are registered sum effects of all mass bellow measured points (including complete Earth). VTT method— based on GPS (Global Positioning System) Data and leveled highs—is able to distinguish density condition in measured area and is more sensitive on anisotropy of rock complex in layer to 10 - 15 km. Application of VTT is most effective at large unknown spaces and in combination with Magnetic and Gravity Data.
Basic parameters used for determination of Density deviation: Earth components—angular velocity rotation, gravity constant and precise dimension of the Earth, defined spatial position of points gained from GPS, levelling mean sea level and processing SW.
Result of VTT technology are values of density deviation (parameter), that reflex of the percentage of deviation of our parameter from the same parameter defined for ideal Earth body, defined particularly by its angular velocity rotation, gravity constant and dimension and by us defined and developed substitute Earth body (knowhow). Our parameters of chosen and defined part of Earth body (that is component of know-how) we define by spatial position gained from GPS, leveling mean sea level and SW (know-how), that enable automatic (machinecontrolled) processing of area.
Integral part of SW (know-how) is utilization of the special data calculated from actual tracks different geodetical and geophysical satellites. All used satellite, including GPS, have origin of coordinates relating to Earth center. These data such enabled find out density deviation value at points of GPS measurements. Herewith VTT is unique, up to now unknown and at other institutes un-discovered technology, that offers more favorable information about Earth gravity field as it is given by classic gravity anomalies. A specially for depth interval 10 - 15 km is VTT relatively very sensitive on the densely anomalous masses. In addition the VTT method is economically very effective in comparing with

Figure 1. Simplified model of the Earth and schema of gravity mapping by GRACE Satellite.
gravity method and produce not only the same information as gravity method but also new information that classic methods don’t provide.
The development of the VTT technology was based on the assistance and work of professional teams of scientific and research and development workers in branches of mathematics, mathematical analyses and theoretical mathematics at the Brno University Technology and Geofyzika Brno. The further participating branches were geophysics, geodesy, and physics of atmosphere and last but not least software engineering.
The method VTT was tested and applied on the many localities of different parts of the World, e.g. Carpathians, Central African Rifts, Guinea Bay, Middle East, North Sea, Siberia or Arctic areas. For puprposes of this contribution two parts have been chosen—the West Carpathians and Central African Rifts.
2. The VTT Method—Satellite Measurements Result in Density Anomalies
2.1. Using of Geopotential Models and Satellite Altimetry for Development of Geoidal Potential Value  and Technology VTT
New height precise Earth Geopotential Model EGM08 made possible to developed the value of the geoidal geopotential . This value is independent on Earth’s tides and others disturbances, therefore it can by used as basic quantity for many applications. Value
  represents mean sea surface which is monitored by satellite altimetry. This value is the one of four fundamental geodetic constants. We used data of satellite altimetry Jason 1 for development
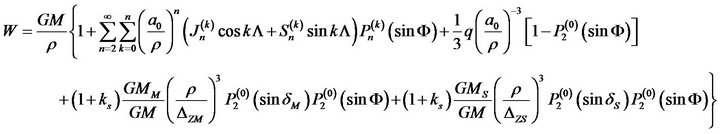
 . The geopotential at any point we can compute by Formula (1):
where —Legender’s function;
 — Stokes coefficients (they describe of Earth gravity); n,k —degrees and order of geopotential model; GM—geocentric gravity constant, w—velocity of Earth station;
 —coefficient in potential of centrifugal power, a0—optional linear factor for standardization of Stokes parameters to dimensionless values:

where dk0 is the Kronecker’s delta and  geocentric spherical coordinates of Earth’s body mass element dm.
|
|
It could seem that for computation of  it is necessary the knowledge of mass distribution in body of Earth. Fortunately by second Green’s identity it is possible the exact computation
  from Earth’s gravity.
Other constant and quantities it is possible find in special literature.
We determine value W0 by formula of Gauss-Listing geoid (Figure 2).
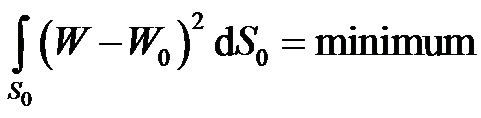 (2)
(2)
Here W is geopotential value at so-called topographical (non level) sea surface S0, dS0 is element its surface. Application (1), (2) and satellite altimetry data we obtained numerical value
 (3)
(3)
This value has been accepted worldwide and is included to the IERS Conventions 2003, 2007. This value defines in principle parameters of level ellipsoid  (Figure 1) which best fit to the surface defined by W0. The body this level ellipsoid produces normal gravity. We developed parameters the Earth’s level ellipsoid in three tide systems (see Table 1). For each ellipsoids they was used too geocentric gravity constant
 , angular velocity of the Earth’s
  and second degree zonal harmonic J2 (Table 1).
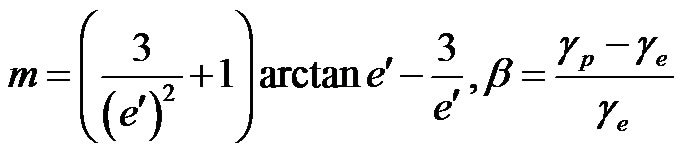
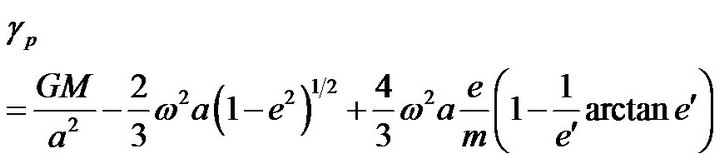
We developed then other important parameter for VTT technology application (Table 2), i.e. values of normal

Figure 2. Gauss-Listing geoid and level ellipsoid.

Table 1. Numerical value parameters for definition of tide systems Mean, Tide-Free (TF) and Zero.
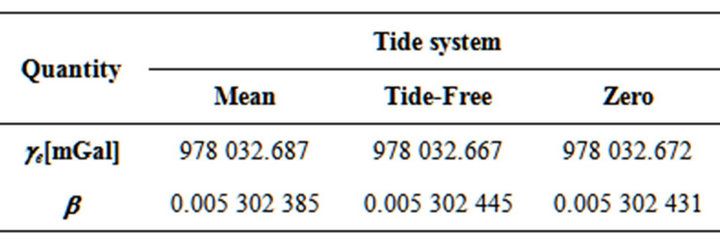
Table 2. Numerical values normal gravity ge at the equator and coeficient b for three tide systems on the ellipsoid E0.
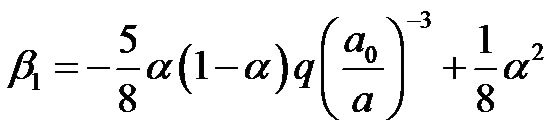
gravity ge at the equator and at the pole on the elipsoid E0 and values of parametrs b1 :
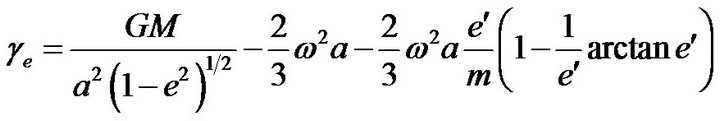 (4)
(4)
 (5), (6)
 (7)
(7)
 (8)
(8)
Coefficient b1 in formula for normal gravity on the ellipsoid E0 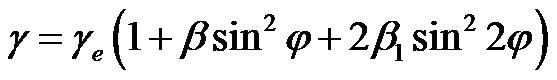 is practically the same in all three tide systems, i.e.
 .
.
All parameters above was used for development of VTT technology. Except parameters above we used GPS/leveling data. Basic product this VTT technology is the so-called density deviations of Earth Crust in comparing with “Normal Crust” defined on the base of the normal gravity formula. Density deviation can be determined in any place of a select territory, where the highs are known. Definition and process of the density deviations determination is in this time not here described. A utilization of the density deviation see below.
3. VVT Technology versus Gravity Method
Relationship between Gravity survey versus VTT method is simply displayed by Figure 1.
By gravity measurements are registered sum effects of all mass bellow measured points (including of complete Earth). VTT method—based on GPS Data—is able to distinguish density condition in measured area and is more sensitive on anisotropy of rock complex in layer to 10 - 15 km. Application of VTT is most effective at large unknown spaces and in combination with geophysical data, mainly Magnetic and Gravity Data!
If we studied a relation of the gravity anomaly values with density deviations (at identical points), in our case on geologically complicated territory of the Eastern Slovakia, where we obtained interesting correlation in linear function
 (9)
(9)
or more exactly function
 (10)
(10)
This correlation is changed place to place, and differs and depends on the type of “Normal Crust” in mentioned place.
This analytic functions predicate to possibilities of solution of the direct or inverse task of DD anomalies by simply geometric bodies as sphere, cylinder or thin plate. The approach is just on the basis of correlation between gravity anomaly and density deviations DD. Mentioned density deviation it is possible to re-computed to density model laying in the Upper Crust and to confront with its gravity effects. It is possibility this process of solution to repeats and iterate to optimal result.
This formula enable to solve also relation ship to porosity if there correct determinate depth of anomalous density horizon.
The Normal gravity field of the ellipsoid in the outer halfspace is wholly determined by its size, shape, mass and rotated velocity; on the inner structure it do not depends. Gravity anomaly is defined , where g is measured gravity, gn is normal gravity field of the Earth. As it is visible that determination of the Δg, a specially its interpretation is depended on correct determination of the density model of the “Normal Earth”. The way to solution of the distribution of the density in the “Normal Earth” can be done through “Normal geophysical models” of plate tectonic boundaries/units (Island arc, continent, ocean, rift etc. [1]).
VTT parameters of chosen and define part of Earth body are defined:
• by spatial position gained from GPS• leveling mean sea level and
• SWs that enable automatic (machine-controlled) processing of area.
VTT utilize knowledge about correct form of the Earth and knowledge about precise distribution of the density masses of the Earth.
Integral part of SWs is utilization of the special data calculated from actual tracks different geodetical and geophysical satellites. VTT is sensitive on the masses up to 10 - 15 km. Bellow this horizon is measured parameter influenced by masse of the all Earth, in comparing with gravity anomalies where the Law of superposition of masses is base condition.
Basic parameters used for determination of Density deviation: Earth components—angular velocity rotation, gravity constant and precise dimension of the Earth, defined spatial position of points gained from GPS, leveling mean sea level and processing SWs.
Result of VTT technology are values of density deviation (parameter), that reflex of the percentage of deviation of our parameter from the same parameter defined for ideal Earth body, defined particularly by its angular velocity rotation, gravity constant and dimension and by us defined and developed substitute Earth body (knowhow). Our parameters of chosen and define part of Earth body (that are component of know-how) we define by spatial position gained from GPS, leveling mean sea level and SWs (know-how), that enable automatic (machine-controlled) processing of area.
Integral part of SWs (know-how) is utilization of the special data calculated from actual tracks different geodetical and geophysical satellites.
All used satellite, including of GPS, have origin of coordinates relate to Earth center. These data such enabled find out density deviation value at points of GPS measurements. Herewith VTT is unique, up to now unknown and at other institutes un-discovered technology, that offer more favorable information about Earth gravity field as it is given by classic gravity anomalies. A specially for depth interval 10 - 15 km is VTT relatively very sensitive on the densely anomalous masses in upper crust. In addition the VTT methods are economically very effective in comparing with gravity method and produce not only the comparable and partly the same information as gravity method but also new information that classic methods don’t provide.
3.1. Examples
3.1.1. The Western Carpathians
VTT method was tested during last 10 years on the most territories of the Central Europe. Specially the Western Carpathian area offers the checking of the method from many viewpoint. We concentrated on the Vienna and Eastern Slovakia basin areas to confirm the easy identification of the anomaly mass by VTT. It was confirmed very good correlation between negative anomaly by VTT and recognized thicknesses of the Neogene sediments [2] (Figure 3). The same is evident on the Eastern side of the Western Carpathians, in area of outer Flysch belt. In this area the extreme thickness of the Flysch sedimentary complexes cause regional negative density deviations anomalies through all Flysch belt. It is consistent not only with seismic data and wells but with very dense net of Magnetotelluric data, too [2] and [3]. On the other hand the gravity data in the same area create effect of positive anomaly that is explained by the elevation of the Epi-Variscan platform [4]. This example of discrepancy of both mentioned method.
It is possible to watch similar situation in the area of the Vienna basin where the comparison of the gravity
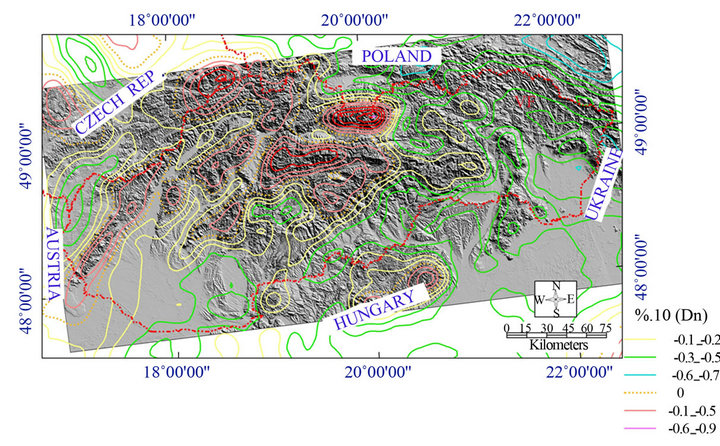
Figure 3. Simplified map of density deviation (DD) from the Western Slovakia area. Blue color represents value—0.3 kg·dm−3. Most of the Tertiary basins show large density deficit in comparing with gravity maps. VF—area of Eastern Slovakia Flysch.
anomaly map for the reduction density 2.67 kg·dm−3 with DD anomaly map show nearly the same features with local exceptions (Figure 4). One of this is in area of the Bílé Karpaty Mts., where in case of gravity map it visible more positive effect so-called “Drietoma gravity high” [5]. On the other hand the DD map shows absolutely different structural feature—expressive necking of anomaly DD and moving the positive anomaly to the area of the state border. Well correlation is in the area so call “Hodonín-Gbely horst” and on whole Vienna basin (Figure 4). It isn’t needful to emphasize a reason of this data and importance for mapping of the hydrocarbon prospective structures.
The quality of the DD anomaly map is depended on the density and accuracy of the GPS/leveling. Similarly like gravity measurement it is possible to obtain information along profiled measurement (see below). The huge VTT advantage is presently large accessibility of the height data. It make possible—like in case of satellite data—to construct of the map without terrain measurement expenses namely on the each part of the world.
3.1.2. Central African Rift Systems
During the initial phases of continental disruption in Late Jurassic and Early Cretaceous times, narrow marine troughs developed at the sites of the future continental margins, and faulting and flexing in the basement brought about the formation of the East African Rift System. At the same time, basic and alkaline igneous activity was widespread.
In Cretaceous times the continents began to move apart, and since that time Africa has remained a major land mass, the only orogenic activity being that on the extreme NW corner of the continent, in the Atlas belt, which is of Alpine age. Fluviatile and lacustrine sediments accumulated in a number of interior basins, while thin cover sequences were laid down on the continental margins in some regions.
The West and Central African Rift System (WCARS, Figure 5) is made up of a series of landlocked basins formed in response to simultaneous, lateral, mainly mechanical divergence between discrete crustal blocks of the Gondwana super-continent in Late Jurassic to Early Cretaceous times.
The method VTT was tested and applied in two subrifts that belongs to the most prospective areas in the Central African Rift system. First is El Fula (Abu Gabra) basin belongs to Muglad Rift, and second is located between Termit and Doba basins in Makari-Zina sub basin, part of Logone Birni Rift—Both basins belong to very prospective parts of rift systems.
The proven recoverable reserves for the Sudan rift system are now estimated to be about 1.4 billion barrels, but large areas of these basins are relatively unexplored.
Makari-Zina basin has been explored last year by pioneer exploration well (Zina-IX) encountered an 18-meter net thickness of reservoir sandstones impregnated with liquid hydrocarbons. A specially during preparing and also in final stage of processing and interpretation of geophysical data the VTT technology has been utilized, too.
3.1.3. El Fula Sub-Rift (Abu Gabra Rift)
Most segments of the Sudan rifts were never invaded by marine waters. Hence, all the proven source rocks are lacustrine in origin, and principally occur within the Aptian-Albian Abu Gabra Formation. TOC’s (Total organic carbon) average 1.3% with a range of 1% to 5% [6]. The Abu Gabra Formation reaches a maximum thickness of about 2 km.
The Abu Gabra source interval is overlain by the sandrich Albian-Cenomanian Bentiu Formation that serves as
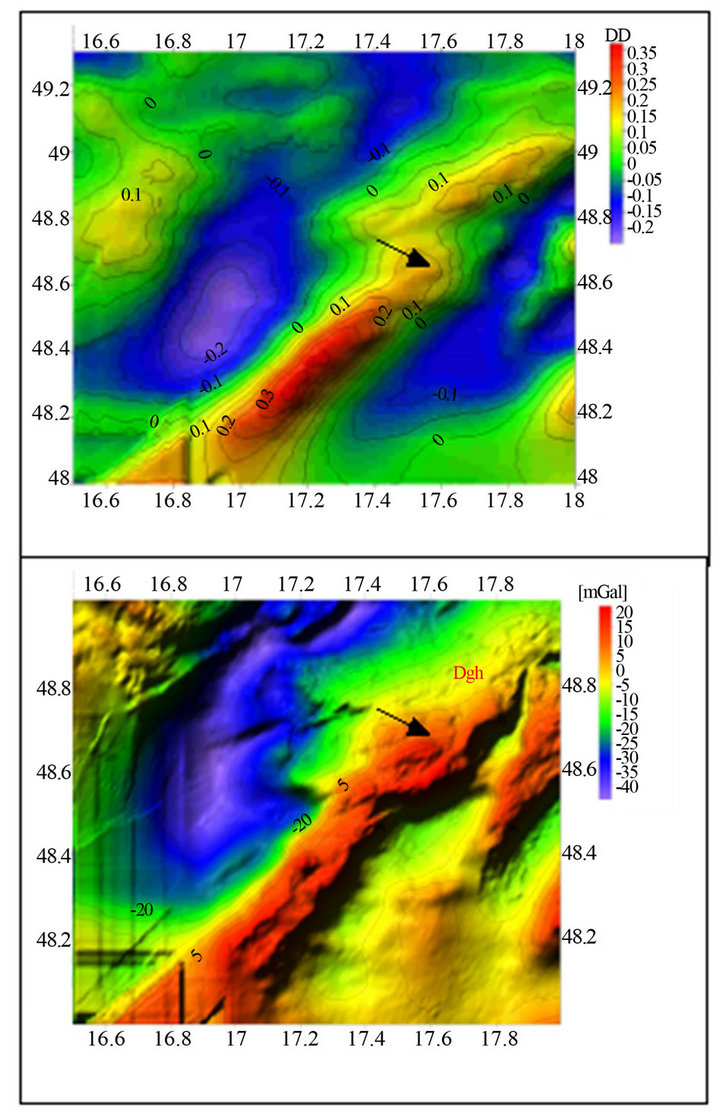
Figure 4. Density Deviation anomaly map (top) and gravity anomaly map (botom) from the Vienna Basin. Arrows indicate so-called the Hodonín-Gebely horst. Dgh is so-called “Drietoma gravity high”.
one of the most important reservoirs in the Sudanese basins. Oil has also been discovered in siliciclastic reservoirs interbedded with the Early Cretaceous source intervals, and in overlying sandstones as young as the Paleocene.
The first well to recover oil, Unity-1, was drilled by Chevron in 1978 in the Muglad Basin (Figure 5). This was followed by significant discoveries at Abu Gabra-1 (1979) and Unity-2 (1980), and later fields were also found in the Melut Basin. The proven recoverable reserves for the Sudan rift system are now estimated to be about 1.4 billion barrels, but large areas of these basins are relatively unexplored.
Most of prospective areas, verified by possitive wells, correlate well with Density deviation anomalies with anomaly levels between −0.01 to −0.06 kg/dm−3. For the purposes of the interpretation of Satellite gravity and VTT data is valuable usually correlation between positive local gravity anomaly and negative density deviation anomalies, which identify the hidden positive structure of half-grabens.
VTT and Gravity data, usually supplied by Magnetic data, too, can be analyzed at profile (Figure 6) or map (Figures 7(a) and (b)).
Geophysical profile An Nuhud-Shaq Al Khadir area indicates well correlation VTT with Gravity anomalies (GA) in crystalline area of En Nuhud. Differences at 100 to 120 km, where higher thickness in central part of basin was identificated, better map DD anomalies. Relative positive anomaly delimits places with hidden volcanic masses −(+) VTT anomalies on the left side (15 km and 100 km).
Great advantage of both methods is immediately available maps from any place on the Earth, without space limitation. The Resolution of Gravity map is below 2 km, for VTT method depends on the density measured GPS data or leveled highs.
For commercial purposes can be offer the Promotion Data Package that contain following basic maps: Density deviation map, Satellite Bouguer anomaly map, Residual and Regional Gravity maps, 2nd Derivation Gravity map, Horizontal gradient map. Next type of maps can be order extra.
3.1.4. Logone Birni Basin (LBB)
Geofyzika’s acquisition Program started in 1997 year with 2D seismic survey, combined with the gravity measurements. The aim of project was build file of seismic data, which will be offered and sold to foreign investors. Logone Birni Basin is at the intersection of the West African Rift System and the Central African Rift System. It is a part of the generally named Chad Basin. It is near of the very profitable Doba Basin where the giant Doba oil field has been discovered. In the region of the Chad Basin more than 15 oil and gas discoveries have been found. A pipeline is under construction for evacuating the Doba oil production to Kribi terminal in Cameroon.
More as 1000 km 2D reflection seismic profile were measured. Evaluation of the seismic data was realized with support of the Ministry of Environment of Czech Republic. Processed Grav/Mag Data and unified Remote Sensing map were created for the surrounding area. On the several examples will be demonstrated the shallow and very prospective horizons in the two parts of Logone Birni Basin.
During the preparing and projection part the VTT method has bee first time used for chosing and testing perspectivity of LBB area.
Even though the rvity method has been preferred VTT offer some information on the southern part of rift. After VTT data there was certain discrepancy with gravity data (Figure 8). After gravity map regional low was interpreted the as continuation of the Cretaceous basin, but negative DD anomaly suggested very deep source of
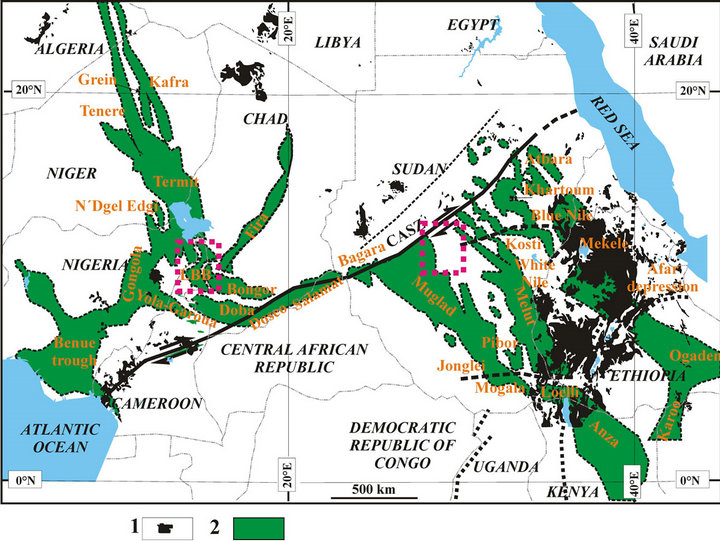
Figure 5. Location of the main Central African Mesozoic rifts system. Dashed line—interpreted hidden important rift boundaries, doted line—Tertiary active rifts. Red squares—area of interest.
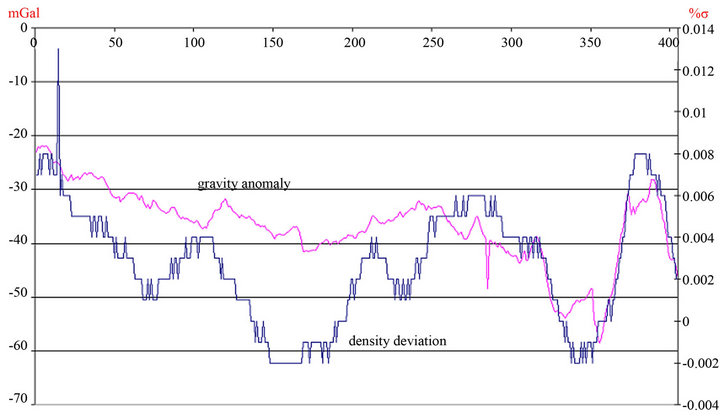
Figure 6. Kordofan Province: Profile An Nuhud-Shaq Al Khadir area. Result: VTT indicate well correlation with Gravity anomalies (GA) in crystalline area of En Nuhud, (right side) but higher thickness in central part of basin is better separated by −(+) VTT anomalies at section. DD curve indicate a places with hidden volcanic masses on the left side (positive anomaly).
negativ density anomaly. Later realized seismic sections confirmed existence of a crystalline complex (the Granite complex), with high velocities has been identified on the base of the shallow well.
In 2004 the highs from measured gravity point have been used for more detail analyses of the Major part of Logone Birni Basin (Zina Basin). The results have bee correlated with geophysical data (Figure 9). Hihg positive density contrast well correlate with large amonts of Cretaceous basalt volcanic complex found by seismic reflection measurements. The map DD (colored image) a gravity anomaly map at Figure 9 give severel food for thought where look for prospective places and structures. Negative Density Contrast combined with gravity positive local anomalies is obsarvable at several localities inside of basin. At one (left side) the first positive well Zina XI was successful drilled.
4. Conclusions
Advantages of the new VTT method in comparison with Gravity method are following:
• VTT is based on different principles as Gravity method (measuring highs only)
• VTT can use previously prepared data (surface level-
 (a)
(a) (b)
(b)
Figure 7. (a) Bouguer anomaly map constructed from profile-measured data, with location of the profile at Figure 6; (b) Density deviation map constructed from the same data, with location of the profile presented at Figure 6.

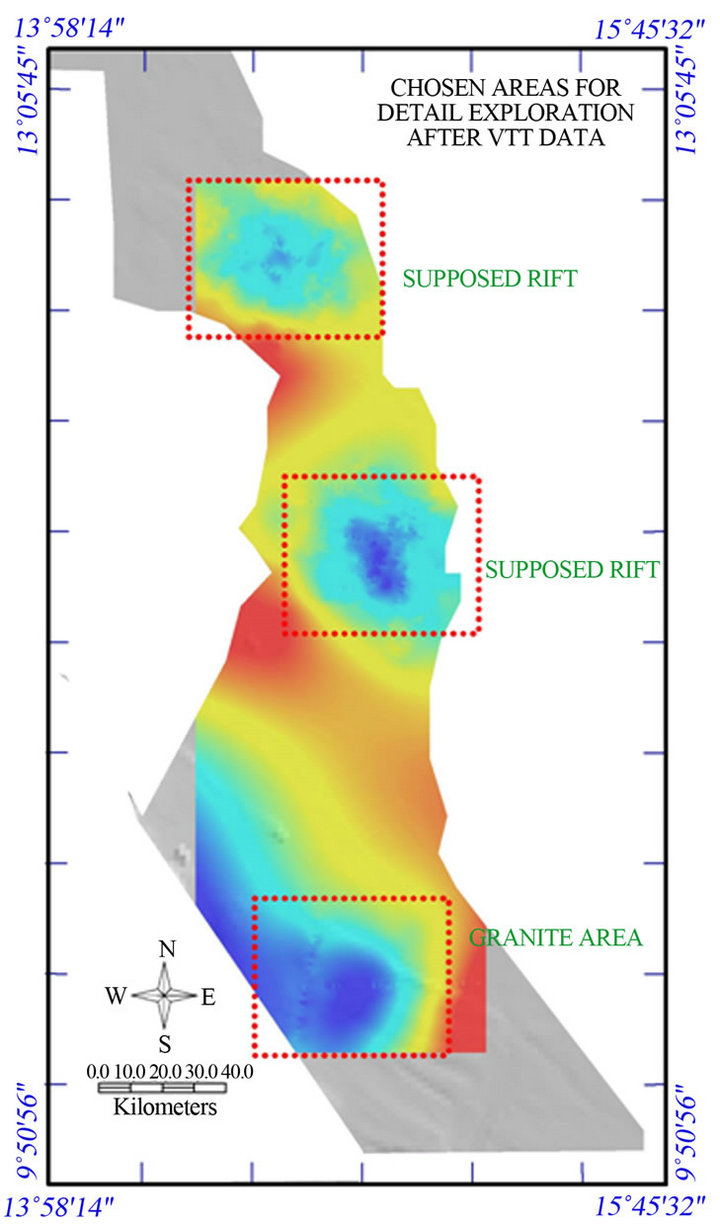
Figure 8. Comparation of the Gravity and Density deviation maps from the Logone Birni Basin (The Northern Cameroon). The differences are clearly visible at bottom of figure, where granite type of gravimetric anomaly (left) is differ in compering with DD anomaly, In comparing with gravity anomaly DD anomaly signalize wide and deep densly anomaly source in south part of basin.

Figure 9. Deatail map of the Central part of Logone Birni basin (Zina sub-basin). The Gravity map is represented by isolines, DD anomalies are colored.
ling net, local altitudinal net, GPS measurement). Such data are not suitable for Gravity method, which requires the measurement of gravity at points or profiles
• VTT is maping density condition in area but often reveals the areas with anomalous masses, which are not detected by Gravity method;
• Gravity method requires high density of measurement points (about 1 point/500 m). VTT needs only 1 point per 10 × 10 km for the same predicative results;
• VTT is able to distinguish density condition in measured area and is more sensitive on anisotropy of rock complex in layer to 10 - 15 km;
• above mentioned facts make VTT much more cheaper, faster then Gravity method (ground measurements, airborne GRAV/MAG measurements are more effective)
• in comparing with Gravity method you obtained not only distribution of anomaly masses but also their deficite over “normal Earth” that enable to determine hiden sediments or masses with anomalous density (+/−)
• VTT based on satellite technology enables in combination with other satellite data to;
• map large unknown (“virgin”) areas very rapidly and with low cost expenditures;
• VTT is especially developed on mapping and evaluation oceanic or sea territories;
w Determined density parameter enables to distinguish any sedimentary basin structures, granite body and in combination with other geophysical method also basic or of iolite complexesw VTT in combination with gravity method is able to distinguish redundancy or diminution of masses in area, and solve the inverse task.
On example from very tectonicaly and structuraly complicated area of the Western Carpathians there is possibility to introduce more details with application, interpretated data and effects of both methods (VTT/Gravity method).
5. Acknowledgements
This work was supported by Grant No. BD 12000020 of the Brno University of Technology.
REFERENCES
- J. Mikuška and L. Pospíšil, “Gravity Problem of the Malé Karpaty Mts,” Proceedings of the Workshop on Tectonic Problems of the Malé Karpaty Mts, 1984, pp. 71-78.
- V. Vatrt and L. Pospíšil, “Method for Determination of the Density Deviations on the Base of GPS Data,” Annual Conference and Exhibition of EAGE, Amsterdam, 6-10 June 2009.
- M. Stefaniuk, M. Wojdyla, C. C. Ostrowski and P. Targosz, “Integrated Magnetotelluric and Gravity Survey; Case Studies from the Polish Outer Carpathians,” 19th IAGA WG 1.2 Workshop on Electromagnetic Induction in the Earth, Beijing, 23-29 October 2008.
- I. Hrusecky, D. Plasienka and L. Pospíšil, “Identification of the North European platform below the Eastern Part of the Western Carpathian Flysch Belt,” In: J. Golonka and F. J. Picha, Eds., The Carpathians and Their Forehand, Geology and Hydrocarbon Resources, AAPG Memoir 84, 2006, pp. 717-727. doi:10.1306/985625M843082
- L. Pospíšil, J. Janků and D. Vass, “Contribution of the Remote Sensing to Understanding of the Western Carpatian Building (Western Part),” Mineralia Slovaca, Vol. 16, No. 2, 1984, pp. 121-137.
- T. J. Schull, “Rift Basins of Interior Sudan: Petroleum Exploration and Discovery,” AAPG Bulletin, Vol. 72, No. 10, 2002, pp. 1128-1142.