Journal of Geographic Information System
Vol.09 No.03(2017), Article ID:77147,18 pages
10.4236/jgis.2017.93022
Accuracy Assessment and Comparative Analysis of IDW, Spline and Kriging in Spatial Interpolation of Landform (Topography): An Experimental Study
Maduako Nnamdi Ikechukwu*, Elijah Ebinne, Ufot Idorenyin, Ndukwu Ike Raphael
Department of Geoinformatics and Surveying, University of Nigeria, Nsukka, Nigeria

Copyright © 2017 by authors and Scientific Research Publishing Inc.
This work is licensed under the Creative Commons Attribution International License (CC BY 4.0).
http://creativecommons.org/licenses/by/4.0/


Received: March 28, 2017; Accepted: June 20, 2017; Published: June 23, 2017
ABSTRACT
It is practically impossible and unnecessary to obtain spatial-temporal information of any given continuous phenomenon at every point within a given geographic area. The most practical approach has always been to obtain information about the phenomenon as in many sample points as possible within the given geographic area and estimate the values of the unobserved points from the values of the observed points through spatial interpolation. However, it is important that users understand that different interpolation methods have their strength and weaknesses on different datasets. It is not correct to generalize that a given interpolation method (e.g. Kriging, Inverse Distance Weighting (IDW), Spline etc.) does better than the other without taking into cognizance, the type and nature of the dataset and phenomenon involved. In this paper, we theoretically, mathematically and experimentally evaluate the performance of Kriging, IDW and Spline interpolation methods respectively in estimating unobserved elevation values and modeling landform. This paper undertakes a comparative analysis based on the prediction mean error, prediction root mean square error and cross validation outputs of these interpolation methods. Experimental results for each of the method on both biased and normalized data show that Spline provided a better and more accurate interpolation within the sample space than the IDW and Kriging methods. The choice of an interpolation method should be phenomenon and data set structure dependent.
Keywords:
Spatial Interpolation, IDW, Kriging, Spline and Modeling Elevation

1. Introduction
Interpolation aims at finding the values of a function  for an
  between different
  values
  at which the values of
  are given. The given values
 (1)
(1)
can be obtained from a mathematical function or from an empirical function modelled from observations or experiments [1] . Spatial interpolation therefore aims at estimating values of a spatial phenomenon or function (temperature, elevation, etc.) at unobserved/estimated points, given values of the phenomenon at observed/estimated points.
Spatial interpolation has continued to be an important tool for estimating continuous spatial environmental variables for effective decision making. Many modeling tools including Geographic Information System offer the earth and environmental scientist the ability to carry out spatial interpolation routinely to generate useful spatial continuous data for all kinds of analysis [2] . Interpolation becomes very useful and essential in scenarios where, the resolution, orientation, or cell size of a discretized surface varies from what is needed. It is also employed when continuous surface is represented by a data model different from what is desired, and when data spread does not cover an area of interest totally [3] . Spatial interpolation methods give a means of predicting values of an environmental parameter at unmeasured location using data from point measurements within the sample space [4] . In an ideal situation, a finite set of inputs establishes variations in an environmental parameter and they exactly conform to an established physical law. If a relationship is established, the values of the desired parameter can be correctly estimated. The relationship between target variable and the physical environment cannot be modeled exactly because of its complexity [5] . This is due to a lack of sufficient knowledge of: (a) the complete list of inputs into the model (b) the relationship needed to determine the output from these inputs and (c) the importance of the random part of the system. Estimating a model using field measurement of the parameter of interest then becomes the only way [6] .
For a sample of a target variable , denoted as
  (where
  is the location context,
  are the coordinates in geographical space and
  is the number of observations), the geographical domain of interest can be denoted as A. Consideration is given to only samples
  that realizes a process
  [6] .
[6] .
According to Mitas and Mitasova [7] , the choice of suitable interpolation methods for different phenomena and dataset presents many difficulties. The complexity of the modeled fields, diverse spatial data sampled non-optimally, presence of significant discontinuities, and noises are common challenges. In addition, datasets obtained from diverse sources with different accuracies are usually very large . Reliable interpolation methods suitable for GIS applications should meet some necessary requirement such as accuracy and predictive power, dimensional formulation, direct estimation of derivatives, applicability to large datasets, 3 + computational efficiency, and ease of use.
Currently, it is difficult to find a method that fulfils all the above-mentioned requirements for a wide range of georeferenced data. Therefore, the right choice of the most adequate method with appropriate parameters for applications is paramount. Different methods produce different spatial representations in different datasets; also, in-depth knowledge of the phenomenon in question is necessary in evaluating which of the interpolation methods produces results closest to reality. The use of an unsuitable method or inappropriate parameters can result in a distorted model of spatial distribution, leading to potentially wrong decisions based on misleading spatial information. A wrong interpolation results becomes very critical when the estimates are inputs for simulations, as small error or distortion can cause models to produce false spatial patterns [7] .
While external factors e.g. data density, spatial distribution of sample data, surface type, sample size and sampling design, etc. [4] may affect the performance of an interpolation method, an understanding of the mathematical formulation of these methods will provide some information on their suitability for terrain modeling.
This paper attempts to examine the accuracy of spatial interpolation methods in modeling landform (topography) in relation to their mathematical formulation. The experimental study of this work employs an area comprising a slope and a plain as landform-adaptability test area and focuses on the comparative analysis of three commonly used interpolation methods of Kriging, Spline, and Inverse Distance Weighting, IDW. The following section summarizes the theoretical and mathematical basis of different known interpolation methods including the three interpolation methods in question. Section 3 introduces the accuracy analysis methods used in this paper while Section 4 presents the experimental analysis. Section 5 discusses the results and Section 6 concludes.
2. Mathematical and Theoretical Concept of IDW, Spline and Kriging
Different spatial interpolation methods have been developed in different domain for different applications. According to [6] , many standard linear models are special cases of a more general prediction model. Tobler’s first Law of Geography, everything is related to everything else, but near things are more related than distant things [8] forms the general principle of many interpolation methods. Some of the methods are only suitable for continuous data fields that assume normal distribution of the dataset. Spatial Interpolation methods could be classified into two major groups:
a) Mechanical/deterministic/non-geostatistical methods; these include among other methods, Inverse Distance Weighting (IDW) and Splines.
b) Linear statistical/stochastic/geostatistical methods; which include Kriging among others [4] , [6] .
2.1. Inverse Distance Weighting (IDW)
This method assumes that the value at an unknown location can be approximated as a weighted average of values at points within a certain cut-off distance, or from a given number of the closest points (typically 10 to 30). Weights are usually inversely proportional to a power of distance [9] which, at an un-sam- pled location s, leads to an estimator as contained in Equation (2) below.
 (2)
(2)
where p is a parameter (typically = 2) [7] . IDW is a method that is easy to use and readily available; it frequently does not produce the local shape implied by data and produces local extrema at the data points [7] . Some modifications have given rise to a class of multivariate blended IDW surfaces and volumes [9] . The assumption for IDW is that measured points closer to the unknown point are more like it than those that are further away in their values. The weight is given as:
 (3)
(3)
where  is the distance between
  and
and , p is a power parameter, and n is the number of measured points used for the estimation. The main factor affecting the accuracy of IDW is the value of the power parameter [10] . Weights diminish as the distance increases, especially when the value of the power parameter increases, so nearby samples have a heavier weight and have more influence on the estimation, and the resultant spatial interpolation is local [10] . The choice of power parameter and neighborhood size is arbitrary [11] . The most popular choice of p is 2 and the resulting method is often called inverse square distance or inverse distance squared (IDS). The power parameter can also be chosen based on error measurement (e.g., minimum mean absolute error), resulting in optimal IDW [2] . The smoothness of the estimated surface varies directly with the power parameter, and it is found that the estimated results become less satisfactory when p is 1 and 2 compared with when pis 4 [12] . IDW is referred to as “moving average” when pis zero [13] , “linear interpolation” when pis 1and “weighted moving average” when pis not equal to 1 [3] .
2.2. Spline
Splines belong to a group of interpolators called Radial Basis Functions (RBF). Methods in this group include Thin-Plate Spline (TPS), Regularized Spline with Tension, and Inverse Multi-Quadratic Spline [14] . These models use mathematical functions to connect the sampled data points. They produce continuous elevation and grade surfaces while limiting the bending of the surface produced to a minimum. RBF models are best employed in smooth surfaces for which the available sample data size is large as their performance is less than optimum for surfaces with appreciable variations spanning short ranges.RBF does not force estimates to maintain the range of the sampled data in these models like in IDW [14] . Spline functions are the mathematical equivalents of the flexible ruler cartographers used, called splines, to fit smooth curves through several fixed points. It is a piecewise polynomial consisting of several sections, each of which is fitted to a small number of points in such a way that each of the sections join up at points referred to as break points. This has the advantage of accommodating local adjustments, if there is a change in the data value at a point, and is preferable to a simple polynomial interpolation because more parameters can be defined, including the amount of smoothing [3] . Splines are normally fitted using low order polynomials (i.e. second or third order) constrained to join up. They may be two-dimensional (e.g. when smoothing a contour line) or three dimensional (when modeling a surface). The smoothing spline function also assumes the presence of a measurement error in the data that needs to be smoothed locally [3] . Among the many versions and modifications of spline interpolators, the most widely used technique is the thin-plate splines [15] as well as the regularized spline with tension and smoothing [7] .
2.2.1. Regularized Spline with Tension
For regularized spline with tension and smoothing, the prediction is given by:
 (4)
(4)
where a1 is a constant and R(vi) is the radial basis function given by:
 (5)
(5)
and
 (6)
(6)
where  is the exponential integral function,
  is the Euler constant,
  is the generalized tension parameter and
  is the separation between the new and interpolation point. The coefficients
  and
and  are obtained by solving the system,
 (7)
(7)
 (8)
(8)
where are positive weighting factors for a smoothing parameter at each location [7] . The tension parameter
  determines the distance over which the given points influence the resulting surface, while the smoothing parameter controls the vertical deviation of the surface from the sample locations. The use of an appropriate combination of tension and smoothing produces a surface that correctly fits the empirical knowledge about the expected variation [7] .
2.2.2. Thin Plate Spline
Wahba and Wendelberger [16] formulated thin plate splines (TPS), previously called Laplacian smoothing splines, for modeling climatic data [4] . A basic solution to the bi-harmonic equation, has the form
 (9)
(9)
where r is the distance between sample points and un-sampled locations [17] .
The relation below approximates the surface with minimum bend
 (10)
(10)
where the terms  model the linear portion of the surface defining a flat plain that best fits all control points using least squares, the last term models the bending forces due to m sampled points,
  are control points coefficients and
  is the separation of sampled point
  and location
 . The unknowns
  and
and  are evaluated using the relation
 (11)
(11)
where
 (12)
(12)
and V is a vector of point heights. K is a matrix of the distance between sampled points and P is a matrix of the sampled points coordinates.  is obtained by calculating the inverse of L or solving EQ.11 with V replaced with the matrix of the heights of sampled points H padded with zeros [18] . Once the unknowns are evaluated, one can compute EQ.10 to determine the heights of unknown points.TPS computes a smoothing factor by limiting the Generalized Cross Validation function, GVC, making for a comparatively sturdy model as limiting the GVC improves the accuracy of estimations and is less reliant on the accuracy of the model itself. TPS gives a determination of spatial accuracy [7] .
2.2.3. Inverse Multi-Quadratic Spline
The relation below gives the inverse multi-quadratic spline function
 (13)
(13)
where  is the Euclidean distance between control points
  and the unknown point
  [15] . The surface is modelled by the function
 (14)
(14)
where the weights  are selected to ensure exact estimations at each data point such that
 (15)
(15)
and is computed by the relation
 (16)
(16)
where z is replaced by a vector of sampled data values, F is a square function matrix given by,
 (17)
(17)
The estimation function generated with these weights is smooth and exact at sampled data points [19] .
Splines have been widely seen as highly suitable for estimation of densely sampled heights and climatic variables [7] , [15] . Among its disadvantages, the inability to integrate larger amounts of auxiliary maps in modeling the deterministic part of change as well as the arbitrary selection of the smoothing and tension parameters have been widely criticized [7] . Predictions obtained from splines therefore are largely dependent on decisions like the order of polynomial used, number of break points, etc. taken by the user. Splines may also be modeled not to be exact to avoid the generation of excessively high or low values common with some exact splines [3] . Unlike the IDW methods, the values predicted by RBFs are not constrained to the range of measured values, i.e., predicted values can be above the maximum or below the minimum measured value [14] .
2.3. Kriging
Kriging, synonymous to geostatistical interpolation, began in the mining industry as a means of bettering ore reserve estimation in the early 1950’s [6] . Mining engineer D. G. Krige and statistician H. S. Sichel formulated it. After almost a decade, French mathematician G. Matheron derived the formulas, establishing the entire field of linear geostatistics [11] . Kriging is founded on a concept of random functions with the surface or volume assumed one realization of a random function with a known spatial covariance [7] .
Regionalized variable theory assumes that the spatial variation of any variable can be expressed as the sum of the following three components:
a) A structural component having a constant mean or trend.
b) A regionalized variable, which is the random but spatially correlated component.
c) A random but spatially uncorrelated noise or residual component.
d) Mathematically, for a random variable z at x, the expression is
 (18)
(18)
where  is a structural function modeling the structural component,
 is the spatially auto-correlated stochastic residual from
  (the regionalized variable), and
  is random noise which is normally distributed with an average of zero and a variance
  [3] .
[3] .
Ordinary Kriging
Ordinary Kriging (OK) is a standard version of Kriging where predictions are based on the model,
 (19)
(19)
where  is the fixed stationary function or global average, and
  is the stochastic but spatially correlated part of the variation. Predictions are made as
 (20)
(20)
where  is the vector of kriging weights (
 ) and z is the vector of n samples at primary locations. Kriging, in a way, is an improvement of the inverse distance interpolation where the key problem of inverse distance interpolation (the determination of how much importance is given to each neighbor) is addressed in such a way that the estimated weights account for the true spatial autocorrelation structure. The novelty Kriging has in the analysis of point data is the derivation and plotting of the semi-variance differences between the neighboring values [6] .
Assuming stationarity, one can estimate a semi-variogram,  , for data
 , defined as
 (21)
(21)
where h is the distance between point  and
and  [21] . This relates to the spatial covariance
  by,
by,
 (22)
(22)
where  is the semi-variogram value at infinity(sill) [7] . The Ordinary Kriging (OK) weights are evaluated by multiplying the covariances,
 (23)
(23)
where C is the covariance matrix derived for an n x n samples matrix with one additional row and column added to ensure the sum of weights is equal to one, and  is the vector of the covariances at a new location [6] . The covariance at a distance of zero
 is by definition the mean residual error [6] . Experimental variograms usually have some characteristic features among which are:
1) Low values of h have small variance with variance increasing in direct proportion to h, leveling off at a certain point to form the sill.
2) At distances less than the range (the distance at which the variance levels off), points closer together are more likely to have similar values than points further apart while at distances greater than the range, points have no influence upon themselves. The range therefore gives an idea of how large the search radius needs to be for a distance-weighted interpolation.
3) The semivariance when h is zero has a positive value referred to as the nugget and indicates the amount of non-spatially autocorrelated noise [3] .
The semivariance displayed in an experimental variogram is modeled by a mathematical function depending on the shape of the experimental variogram. A spherical model is used when the variogram has a classic shape, an exponential model when the approach to the sill is more gradual. A Gaussian model is used when the nugget is small and the variation is very smooth, and a linear model when there is no sill. A variogram containing a trend that has to be modeled separately is increasingly steep with larger values of h. If the nugget variance is large and the variogram shows no tendency to gradually vanish with smaller values of h, or the distance between observations is larger than the range (i.e. sample points are too far apart to influence one another), then interpolation is not reasonable and the best estimate is the overall mean of the observations. Anoise-filled variogram showing no particular pattern may mean that the observations are too few. A variogram that dips at distances greater than the range to create a hole effect shows the sample space may be too small to reflect some long wave-length variation in the data [3] . The interpolated surface is constructed using statistical conditions of unbiasedness and minimum variance [7] . Three important requirements for Ordinary Kriging are:
(i) The trend function is fixed
(ii) The variogram is invariant in the entire area of interest
(iii) The target variable is (approximately) normally distributed.
These requirements are often not met and constitute a serious disadvantage of Ordinary Kriging [6] . However, a major benefit of the various forms of kriging (and other stochastic interpolation methods) is that estimates of the model’s prediction errors can be calculated, incorporated in the analysis, and plotted along with the predicted surface. Such error information is an important tool in the spatial decision making process [14] .
3. Accuracy Assessment Methodology
The accuracy evaluation indices commonly used include, the Mean Error (ME), Mean Absolute Error (MAE), Mean Squared Error (MSE) and Root Mean Squared Error (RMSE). For n observations, p predicted value, and o observed value these indices are evaluated using the expressions listed below:
 (24)
(24)
 (25)
(25)
 (26)
(26)
 (27) [4]
ME is used for determining the degree of bias in the estimates often referred to as the bias [10] . Since positive and negative estimates counteract each other, the resultant ME tends to be lower than the actual error prompting caution in its use as an indicator of accuracy [4] . RMSE provides a measure of the error size, but is sensitive to outliers as it places a lot of weight on large errors [4] . MSE suffers the same drawbacks as RMSE. Whereas MAE is less sensitive to extreme values [20] and indicates the extent to which the estimate can be in error [21] . MAE and RMSE are argued to be similar measures and they give estimates of the average error, but do not provide information about the relative size of the average difference and the nature of differences comprising them [20] . Of course, cross-validation is used together with these measurements to assess the performance of the interpolation methods [4] . In this paper the ME and RMSE (available on the software used) are used to evaluate the performances of the IDW, Spline and Kriging interpolation methods considered in the experimental analysis part of this study. Cross validation is performed as further test of prediction accuracy.
4. Experimental Analysis
The study area as described in Figure 1 and Figure 2 is an expanse of land measuring about twenty-one (21) hectares located in Ikot Ukapon latitude  and longitude
  in the North-Eastern part of Akwa Ibom state of Nigeria. The area is largely hilly with a plain covering about twenty (20%) percent of its total area. Orthometric height data, obtained from the Office of the State Surveyor General, consist of four hundred and sixty-two (462) randomly sampled points spread across the area collected through field survey using a Kolida K9-T series differential GPS.
Data so obtained from the field samples was in Microsoft Excel .xls format. The lowest elevation of the area is 27.018m while the highest elevation is 98.719m above mean sea level. Preliminary data exploration using ESRI’s ArcGIS (version 9.3) shows the data is not normally distributed as shown by distribution parameters in Table 1.

Figure 1. Map of the studying area showing the distribution of data points within the study area.
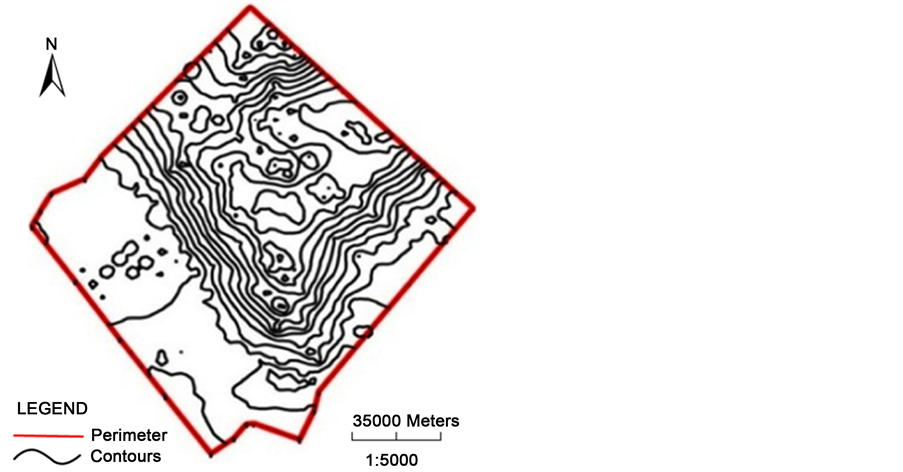
Figure 2. The contour map of the studying area.

Table 1. Distribution parameters of the biased elevation data.
4.1. IDW Method
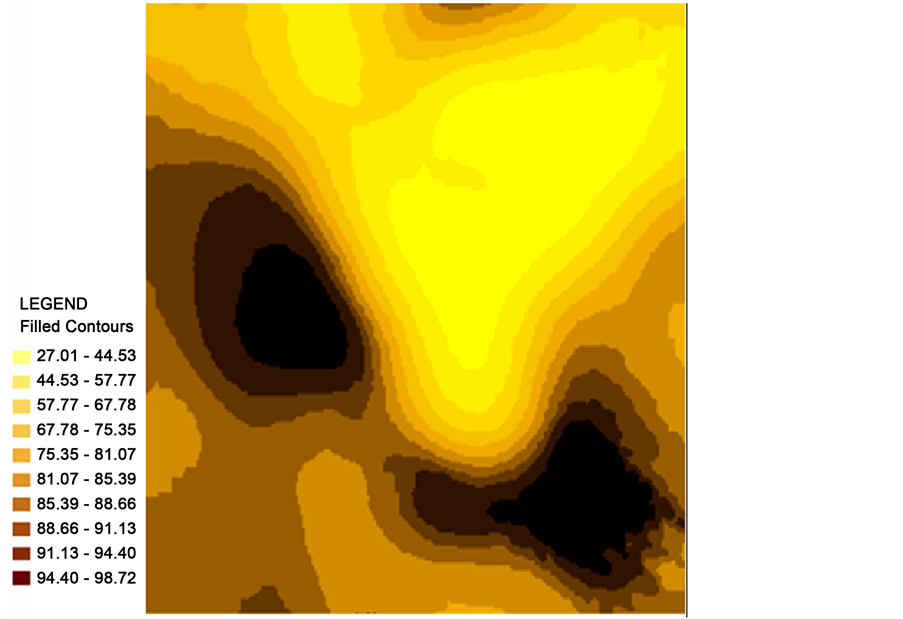
The following contour fill surface shown in Figure 3, is generated for IDW interpolation with power, p of 2, smoothing factor of 0.5and neighborhood size of 15 for the biased data.
4.2. Spline Method
Regularized Spline interpolation, implemented as Radial Basis Function(RBF), with order 2 gives the contour fill map in Figure 4 for power = 2, smoothing factor = 0.5 and neighborhood size = 15.
4.3. Kriging
Kriging works on the assumption that the data set is normalized, therefore, we carried out Box-Cox normalization on the data before implementing Kriging interpolation.

Figure 3. IDW contour fill map.

Figure 4. The regularized Spline contour fill map.
The data was divided into a training and test subsets in a ratio of 80:20 using the Geostatistical Analyst tool in ArcGIS and optimal parameter values (generated by ArcGIS and sets the best possible value for each parameter) used for predictions on the training subset. The test subset was then used with these optimal parameters for validation. The data distribution parameters after Box-Cox normalization is as shown in Table 2.
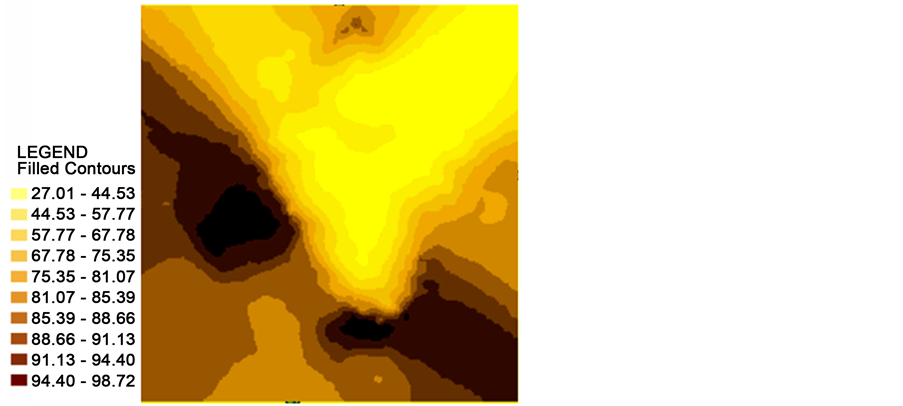
The contour fill maps generated using Kriging with the Gausian model and
Table 2. Distribution parameter of data after normalization using Box-Cox with transformation.
Spherical model respectively for auto-calculated values for nugget, sill, mid- range, a lag size of 54.401, and lag number = 12 are as shown Figure 5(a) and Figure 5(b).
The maps for IDW, Spline and Kriging after the optimal validation of the data are shown in Figures 6(a)-(c).
5. Result and Discussion
From the prediction errors tabulated in Table 3 and Table 4, the level of bias in estimation is lowest for Kriging and highest for IDW as indicated by the respective MEs. This presence of bias is expected, as the height data was not random as shown in Table 1. Box-Cox normalization of the data did not result in a normal distribution either (see Table 2), this means the data was very biased. This scenario is frequently encountered in practice as field collection of elevation data usually focuses on capturing perceived changes in elevation rather than on randomness. The bias for the validated data however, is highest for Kriging and lowest for Spline likely because of the reduction in the number of samples used for validation. A better measure of the error in prediction, the RMSE, is lowest for Spline and highest for Kriging for both prediction and validation shown in Table 3 and Table 4. This indicates an elevation model that is closer to what is on ground for Splines. However, outside the areas where interpolation data where obtained, Spline produces unreliable predictions. It is therefore not suitable for cases where data outside the captured area is desired (extrapolation). IDW produces a model that is better than that of Kriging but not as good as the Spline model. Its predictions outside the captured area are also better than that of Kriging and Spline. This does not imply Kriging is not suitable for terrain modeling or will not perform better than both IDW and Spline. Kriging assumes normal distribution of data and models the spatial distribution of a geographical event as a realization of a function that is random. Its predictions therefore are dependent on the data satisfying the statistical criteria of unbiasedness and minimumvariance. Its mathematical formulation makes it unsuitable for data that
 (a)
(a)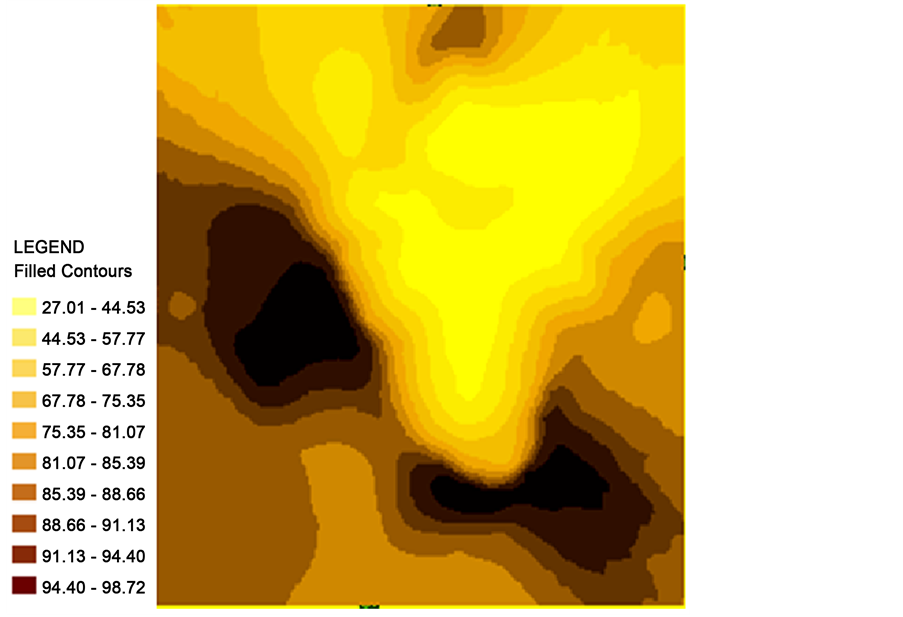 (b)
(b)
Figure 5. (a) and (b) depicts the Kriging contour fill map after Box-Cox normalization created with Gaussian model and with spherical model respectively.
 (a)
(a) (b)
(b) (c)
(c)
Figure 6. (a) Inverse Distance Weighted (IDW) Prediction Map; (b) Spline; (c) Ordinary Kriging Prediction Map.
Table 3. Prediction errors for the three interpolation methods at optimal parameters.
ME is the mean prediction error and RMSE is the root mean square standardized error of prediction.
Table 4. Prediction errors after validation.
ME is the mean prediction error and RMSE is the root mean square standardized error of prediction.
is not normally distributed or difficult to normalize. Splines on the other hand use a physical model varying in accordance to the variation in the elastic properties of the estimation function. It tends to do well with modeling physical phenomena such as terrain. IDW uses a linear combination of values at captured event locations, assigns weights by an inverse function of the separation between the event location to be estimated and points captured to estimate values of the unknown location. Though weights are specified arbitrarily, ArcGIS software provides an optimal weight management function that assigns a weight that is most suitable for points within the captured data set. Predictions are influenced by this weight assignment but are more reliable in terms of error than what is obtained using Kriging. It is acknowledged that the Kriging does very well with covariate data such as temperature data, but the data has to be captured as randomly as possible. This is often not achieved. A good knowledge of the data used as well as the strengths and weaknesses of the available interpolation methods is necessary in deciding on a method to use for interpolation for a given purpose.
6. Conclusion
In this study, Spline provides a more accurate model and result for the elevation data obtained directly from field survey that was not homogenously randomized and not normalized. From the interpolation result we obtained, Spline method outside the data area also reaffirms that predictions by RBFs are not constrained to the range of measured values, i.e., predicted values can be above the maximum or below the minimum measured value. Tan and Xu [22] concluded from their experiment on terrain modeling using data from a digitized map that IDW gave a better model in terms of accuracy than Spline or Kriging. This is most likely due to means from which the test data were acquired. Their test data were digitized from a contour map and were homogenously distributed. The knowledge of the source of data may therefore be of importance in the choice of interpolation method.
Cite this paper
Ikechukwu, M.N., Ebinne, E., Idorenyin, U. and Raphael, N.I. (2017) Accuracy Assessment and Comparative Analysis of IDW, Spline and Kriging in Spatial Interpolation of Landform (Topography): An Experimental Study. Journal of Geographic Information System, 9, 354- 371. https://doi.org/10.4236/jgis.2017.93022
References
- 1. Kreyszig, E. (2003) Advanced Engineering Mathematics. 8th Edition, John Wiley and Sons (Asia) Pte., Ltd., Singapore.
- 2. Collins, F.C. and Bolstad, P.V. (1996) A Comparison of Spatial Interpolation Techniques in Temperature Estimation. Proceedings of the 3rd International Conference/Workshop on Integrating GIS and Environmental Modeling, National Center for Geographic Information and Analysis, Santa Barbara, Santa Fe, NM; Santa Barbara, CA.
- 3. Burrough, P.A. and McDonnell, R.A. (1998) Principles of Geographical Information Systems. Oxford University Press, Oxford.
- 4. Li, J. and Heap, A.D. (2008) A Review of Spatial Interpolation Methods for Environmental Scientists. Geoscience Australia, Record 2008/23, 137.
- 5. Heuvelink, G.B.M. and Webster, R. (2001) Modeling Soil Variation: Past, Present, and Future. Geoderma, 100, 269-301.
https://doi.org/10.1016/S0016-7061(01)00025-8 - 6. Hengl, T. (2009) A Practical Guide to Geostatistical Mapping.
http://spatial-analyst.net/book/ - 7. Mitas, L. and Mitasova, H. (2005) Spatial Interpolation. In: Longley, P.A., Goodchild, M.F., Maguire, D.J. and Rhind, D.W., Eds., Geographic Information Systems: Principles, Techniques, Management and Applications, 2nd Edition, Vol. 1, Part 2, Chapter 34.
http://www.geos.ed.ac.uk/~gisteac/gis_book_abridged/ - 8. Tobler, W.R. (1970) A Computer Model Simulation of Urban Growth in the Detroit Region. Economic Geography, 46, 234-240.
https://doi.org/10.2307/143141 - 9. Watson, D.F. (1992) Contouring: A Guide to the Analysis and Display of Spatial Data. Pergamon, Oxford.
- 10. Isaaks, E.H. and Srivastava, R.M. (1989) Applied Geostatistics. Oxford University Press, New York.
- 11. Webster, R. and Oliver, M. (2001) Geostatistics for Environmental Scientists. John Wiley & Sons, Ltd., Chichester, 271.
- 12. Ripley, B.D. (1981) Spatial Statistics. John Wiley & Sons, New York, 252.
https://doi.org/10.1002/0471725218 - 13. Brus, D.J., et al. (1996) The Performance of Spatial Interpolation Methods and Choropleth Maps to Estimate Properties at Points: A Soil Survey Case Study. Environmetrics, 7, 1-16.
https://doi.org/10.1002/(SICI)1099-095X(199601)7:1<1::AID-ENV157>3.0.CO;2-Y - 14. United States Environmental Protection Agency (EPA) (2004) Developing Spatially Interpolated Surfaces and Estimating Uncertainty. EPA-454/R-04-004, EPA Publication, NC.
- 15. Hutchinson, M.F. (1995) Interpolating Mean Rainfall Using Thin Plate Smoothing Splines. International Journal of Geographical Information Systems, 9, 385-403.
https://doi.org/10.1080/02693799508902045 - 16. Wahba, G. and Wendelberger, J. (1980) Some New Mathematical Methods for Variational Objective Analysis Using Splines and Cross-Validation. Monthly Weather Review, 108, 1122-1145.
https://doi.org/10.1175/1520-0493(1980)108<1122:SNMMFV>2.0.CO;2 - 17. Belongie, S. (2016) Thin Plate Spline. Retrieved online from MathWorld—A Wolfram Web Resource, created by Eric W. Weisstein.
http://mathworld.wolfram.com/ThinPlateSpline.html - 18. Lombaert, H. (2006) Manual Registration with Thin Plates.
http://step.polymtl.ca/~rv101/thinplates/ - 19. Smith, T.E. (2016) Notebook on Spatial Data Analysis.
http://www.seas.upenn.edu/~ese502/#notebook - 20. Willmott, C.J. (1982) Some Comments on the Evaluation of Model Performance. Bulletin American Meteorological Society, 63, 1039-1313.
https://doi.org/10.1175/1520-0477(1982)063<1309:scoteo>2.0.co;2 - 21. Nalder, I.A. and Wein, R.W. (1998) Spatial Interpolation of Climatic Normals: Test of a New Method in the Canadian Boreal Forest. Agricultural and Forest Meteorology, 92, 211-225.
https://doi.org/10.1016/S0168-1923(98)00102-6 - 22. Tan, Q. and Xu, X. (2014) Comparative Analysis of Spatial Interpolation Methods. Sensors and Transducers, 165, 155-163.