Journal of Geographic Information System
Vol. 5 No. 1 (2013) , Article ID: 27926 , 12 pages DOI:10.4236/jgis.2013.51008
GIS as an Efficient Tool to Manage Educational Services and Infrastructure in Kuwait
1Civil Engineering Department, College of Engineering, Kuwait University, Kuwait City, Kuwait
2Geoinformatics Center, Kuwait Institute for Scientific Research (KISR), Kuwait City, Kuwait
3National Authority for Remote Sensing and Space Sciences (NARSS), Cairo, Egypt
Email: gamily@gmail.com
Received November 19, 2012; revised December 20, 2012; accepted January 22, 2013
Keywords: Kuwait; Education; GIS; Infrastructure; Land Use Planning; Land Reservation
ABSTRACT
The State of Kuwait Ministry of Education (MoE) has clearly defined land use standards for the location of public schools, and an inventory of reserved lands for future facilities. Unless, there is a geographical efficient tool to manage and plan the education system in a rapidly developing country such as Kuwait there will be huge deficit in such services. Geographic Information Systems (GIS) was used to fill in this gap and effectively evaluate and analyze their facilities and unoccupied lands to ensure they continue to meet the population and future needs of Kuwaiti students. This paper utilized the GIS to inventory, map, and analyze MoE facilities and unoccupied land reservations with a goal of improved planning and decision making. Unfortunately, the initial spatial analysis of the data showed huge percent of districts that have no schools failing to meet the minimum standard of the MoE including kindergartens, primary schools, intermediate schools for girls, intermediate schools for boys, secondary schools for girls and secondary schools for boys at 72%, 71%, 48%, 43%, 54%, and 55% respectively. Such critical results will enable the decision makers to prioritize the immediate action of relocation the schools or widen the services and accessibility. Moreover, the analysis of the data showed a critical and immediate need to reserve land for five districts where they are heavily populated and lacked reserved land. However, based on long term land use plans, there is an urgent need to relocate some land and reserve others to meet the future urbanization plans and population growth.
1. Introduction
Overpopulation growth in developing countries always put excessive pressure on government for facility management. Key element is the education and allocation of the school within the urbanized areas to meet the community needs. Unless there is a tool to help decision makers for relocating of schools according to the standardized criterion, it will be mysteries planning. The Kuwait school system includes a diverse range of students and inventory of schools. The Kuwait Ministry of Education (MoE) is the body responsible for administering public schools including, special needs, religious schools, and adult literacy education [1]. MoE also oversees and regulates the private schools operating within Kuwait. MoE property holdings include school facilities and administration facilities, as well as unoccupied land parcels that have been reserved throughout the Kuwait urban area for future facilities to meet the future needs of over population growth.
To foster the use of new geographic information tools for effective planning of the school within the Kuwaiti populated area, the Kuwait National Educational Atlas Project for Services and Infrastructure (NEASI)—phase 1 was initiated. This project was a challenge to support the decision and policy makers in MoE with inventorying, mapping, managing, and analyzing existing school facilities, and land use planning for the unoccupied lands that reserved for future school facilities. MoE had defined land use standards for the placement of public schools, and an inventory of reserved lands for future facilities. The NEASI phase 1 project was a two-year joint mission conducted by MoE and the Kuwait Institute for Scientific Research (KISR) to: inventory, map, and analyze MoE facilities and unoccupied land reserved for future education construction.
Prior to the NEASI project, MoE lacked the ability to evaluate its entire inventory of facilities and unoccupied lands against their established criteria in a spatial context. The NEASI project identified five functions that Geographic Information Systems (GIS) technology could improve: 1) document and map MoE land holdings and their uses, including those that are unoccupied and/or awaiting development, school sites and administrative sites; 2) document and organize buildings and maintenance activities data; 3) integrate student and staff records (non-spatial) with geographical data sets; 4) develop educational indicators and educational land use planning tools to improve decision making in Kuwait. This paper focuses on the land use analysis and planning aspect of the project.
GIS school mapping has much been used in the last two decades for educational planning [2]. GIS database provides comprehensive framework and organization of spatial and non-spatial data to efficiently help decision makers and planners. It apparently provides a mapping tool for the relationships between the distribution of schools and the school age population within the populated areas [3]. It is an efficient tool in managing and planning the accessibility to the educational schools.
In this paper, challenge was to develop GIS system for the MoE for planning and a decision making tool for immediate and future planning of the educational zones in Kuwait.
2. Study Area Description
The State of Kuwait is a small country located on the Arabian Gulf, and is bordered by Saudi Arabia and Iraq. Urban settlement is concentrated along the southern edge of the Kuwait Bay and along the western edge of the Arabian Gulf. An estimated three (3) million people live in Kuwait with about one third are at school age [1].
The administrative hierarchy of Kuwait is starting form the largest scale of governorate through districts to the smallest area of blocks. The Kuwait Educational Zones are formed by blocks. The study area is made up of all contiguous districts and blocks in Kuwait with an urban designation. As such, the districts of Kabd and Failaka Island were not included in the analysis.
3. Materials and Methods
As the case of many developing countries, the availability of geographical data for Kuwait is limited and there is not yet a national GIS database. Therefore, the major political boundaries of governorates, districts, and blocks were developed. This was using analog map sheets that were converted into GIS format. However, the detailed scale of parcel boundaries and street centerlines were obtained electronically from the Kuwait Municipality and the Kuwait Ministry of Public Works respectively. The map projected and alignment of both datasets were handled using the GIS package.
The remaining data required for analysis, such as demographical data and schools, was developed from available analog and digital sources, and then manual field data collection was conducted to complete and verify the features and attributes. This included capturing all of the individual buildings, and parcels owned by MoE. As MoE had multiple, sometimes conflicting, and missing data sources it was necessary to field verification of the school building and parcels. Records were maintained at individual school facilities, and they were also kept at the MoE administrative offices. School facility, student, and teacher records were developed at the building level, and land use/land holdings were developed at the parcel level.
Prior of developing the GIS database user needs assessment process was carried out to identify the spatial and non-spatial data needs of the MoE for managing and planning the educational facilities. This task focused on data needs analysis and GIS requirements analysis to identify applications that will be built to utilize the geodatabase [4-6]. Figure 1 provides a block diagram illustrating the project development methodology to inventory, map and analyze MoE facilities and infrastructure.
ArcGIS package was used to develop the GIS database and publish on web-based services. The overall architecture of the developed system is shown in Figure 2 [7]. In addition to the SDSS for site suitability and education indicators, custom NEASI tools and applications were developed based on the requirements analysis. It was customized to provide users with easy to understand interface [7-12]. The NEASI applications and customizations were developed using: C#.net 2008 Version 3.5, ArcGIS Server, and ArcObjects API. The ArcGIS Server ADF template was used to configure the map and related components. The system is developed to provide various service tools including:
• Tools and functions to explore, and display information available in the geodatabase.
• The unoccupied land tool supports the user in locating available unoccupied lands that belong to MoE, based on administrative reference such as governorates, districts, and urban blocks.
• Tool for map production to generate an easy costumed map layouts including map title, map scale, map legend and north direction arrow.
• Search tool to search and locate schools based on school names, school stages, and/or administrative units.
• Documentation and reporting tool to provide life link of the school records. The uploaded documents can be retrieved by other users if they have permission to see and download such documents.
• Tools for updating the attribute or spatial data sets from the field using the web application.
The GIS database was validated on site using series of data capture sheets prepared for each district. The data capture sheets mapped and classified all MoE properties. The field data team visited each site to verify, update or
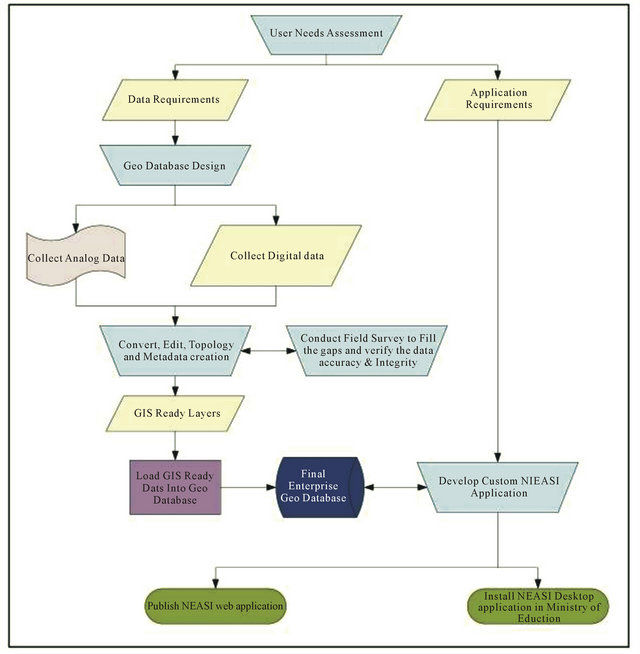
Figure 1. NEASI block diagram of the GIS processes.
collect new descriptions of the properties. The benefit of this task was two-fold because it resulted in high accuracy data and provided a training opportunity for MoE personnel. Figure 3 shows an example of a data capture sheet that prepared and used by KISR project team and MoE personnel to collect data.
4. Results
The GIS analysis was firstly to evaluate the locations of existing public schools to determine if the existing schools were located consistent with the MoE general placement standards. The analysis was conducted for public kindergarten, primary, intermediate, and secondary schools. The general placement standards for school stages are as follows:
• Schools should be located inside urban/residential districts.
• Each block should contain one (and only one) kindergarten, and one (and only one) primary school.
• Each district should contain one (and only one) intermediate girl’s school, and one (and only one) intermediate boy’s school.
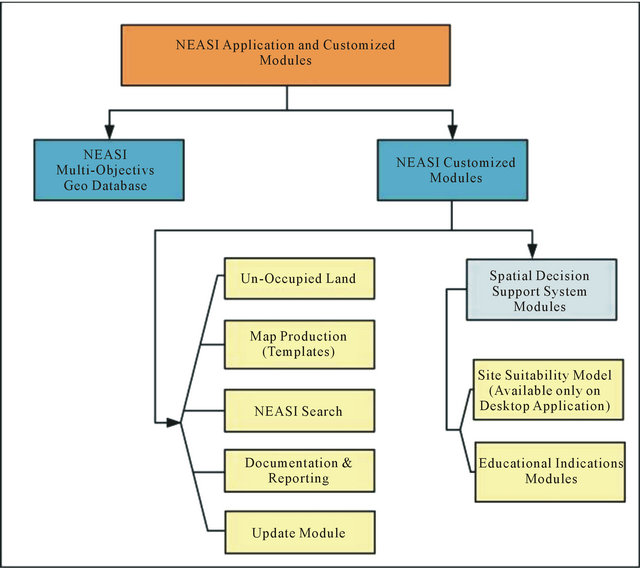
Figure 2. The architecture of the GIS system of MoE.

Figure 3. Example of the field data capture sheet.
• Each district should contain one (and only one) secondary girl’s school, and one (and only one) seconddary boy’s school.
MoE mapped and attributed 815 public schools in which 212 are kindergartens, 259 primary schools, 207 intermediate schools, and 137 secondary schools. The spatial visualization of these schools within the territory of each block aided decision makers to analyze the distribution of the schools according to the MoE standard.
4.1. Kindergartens
Actually, there are about 707 blocks in the Kuwaiti urbanized area. The general standard of both the kindergartens and primary schools is one school per block. The GIS analysis of these two types of schools showed effecttively the gaps where blocks are out of education services. The actual placement of kindergartens revealed that only 28% of urbanized blocks contain kindergartens; in which 26% meet the MoE standards and contain only one kindergarten and 2% contain 2 kindergartens per block, and 1 block contained 3 kindergartens. Conversely, the analysis alarmed seriously that 72% of all urban blocks do not contain any kindergartens. Such results show the effectiveness of GIS analysis to alarm the decision makers and policy planners to take an immediate action to resolve this problem. Table 1 lists the relationship between the number of blocks and distribution number of kindergartens. Figure 4 provides the spatial distribution of the kindergartens schools within the educational zones in Kuwait.
Table 1. Distribution of public kindergartens.

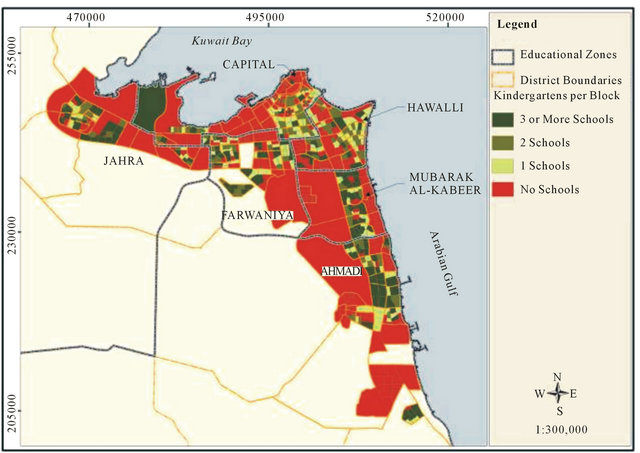
Figure 4. Kuwait public kindergartens.
4.2. Primary Schools
The spatial analysis of the distribution of primary schools per block was nearly similar to the kindergartens. 71% of the urban blocks have no primary schools. However only 29% of the urban blocks have primary schools; in which 23% has just one school per block. More impressively, 44 blocks were recorded with more than one school up to 5 schools per block in a single block. Table 2 lists the statistical records of these schools per urban blocks. It is apparently that GIS analysis has shown how much missplanning of primary and kindergartens schools location along the populated community (Figure 5). This effectively could help MoE decision makers to take an immediate action towards the services and distribution of primary schools and the urgent needs for either establishing new schools or relocation of others to provide complete services and easy accessibility to the community.
4.3. Intermediate Schools
The Kuwaiti educational system for intermediate school is established to be for gender segregation, which means that there are girls and boys schools. The basic standard is one intermediate school per district per gender. Analytical study of the girl’s intermediate school has clearly shown that about 48% of the districts had no girl’s intermediate school. The rest of about 52% has variable
Table 2. Distribution of public primary schools.
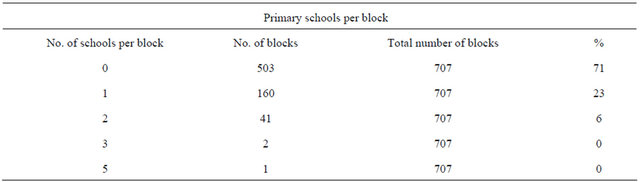
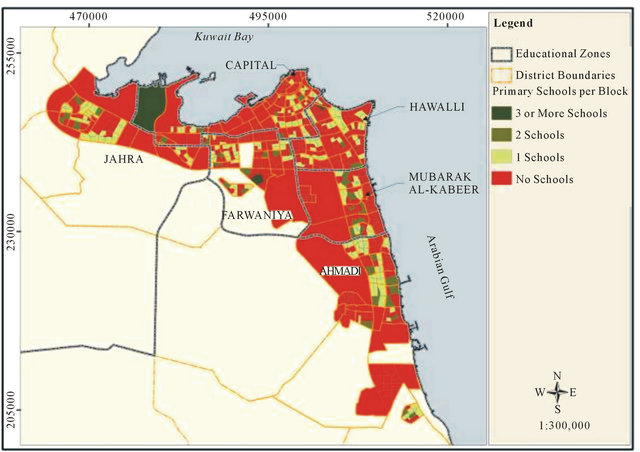
Figure 5. Kuwait public primary schools.
number one or more school. 25% of the districts met the MoE standards and had only one school, 20% of the districts had 2 schools, 6% had 3 schools, and only 1% had 6 girl’s intermediate schools. Table 3 lists the statistic of the intermediate girl’s school. However, Figure 6 shows the spatial distribution of these kinds of schools.
Complementary to the intermediate school system is the boy’s intermediate schools, which are distributed to accommodate the boys of the intermediate school age. Better than the girl’s school, only 43% of the districts had no school for boys and 57% had one school or more. Similar to the girls, 25% of the districts met the MoE requirements and had only 1 school. However, 32% had more than 1 school for boys distributed as 19% with 2 schools per district, 6% had 3 schools per district, 6% had 4 schools per district, and there was a single district with 5 boy’s intermediate schools. Table 4 lists the statistics of the intermediate boy’s schools within the Kuwait districts. Figure 7 shows the graphical distribution of these schools.
4.4. Secondary Schools
Secondary school is the final level that qualifies students to the university and similar to the intermediate schools, the Kuwait educational system is based on segregation of secondary school per district per gender. The geographical analysis of the girl’s secondary schools shows that high percentage of 54% districts that have no girl’s secondary school. Only 47% of the districts have one or
Table 3. Distribution of public girl’s intermediate schools.

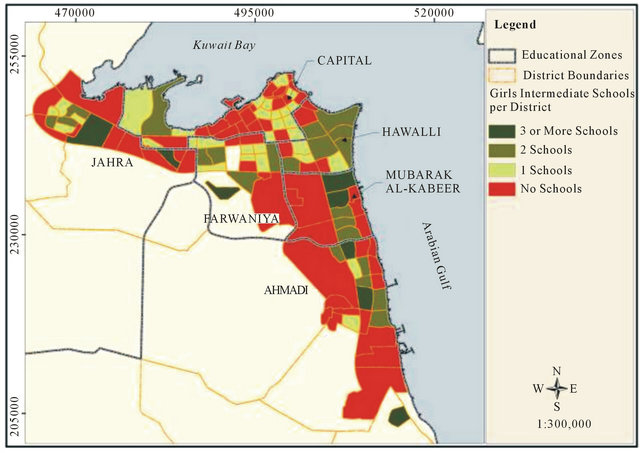
Figure 6. Kuwait public girl’s intermediate schools.
Table 4. Distribution of public boy’s intermediate schools.

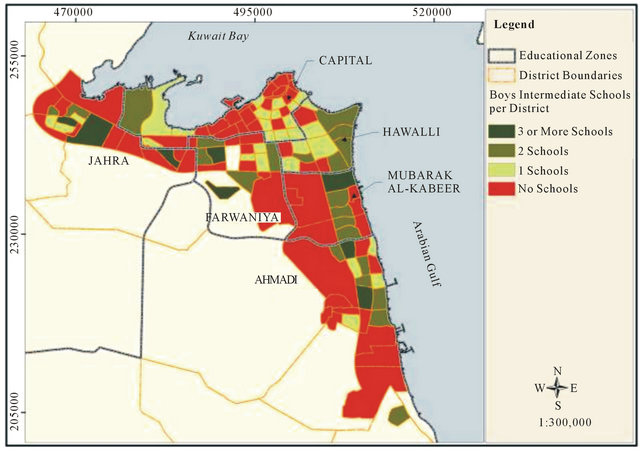
Figure 7. Kuwait public boy’s intermediate schools.
more school in which 33% have met the general standards of 1 school per district. The rest of 13% was shown that 12% have 3 schools and 1% have 3 girl’s secondary schools. Table 5 lists the statistics of the girl’s secondary school. Figure 8 presents the graphical distribution of these schools along the Kuwaiti urbanized districts.
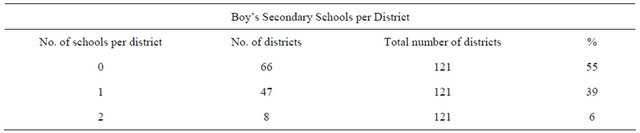
Complementary to the girl’s secondary school system is the boy’s secondary schools which are distributed to accommodate the boys of the secondary school age. Similar to the girls, about 55% of the districts have no schools. The remaining 45% of the districts have one or more schools, in which 39% met the standard of 1 boy’s secondary school per district and only 6% have 2 schools.
None of the districts contained more than 2 boy’s seconddary schools. Table 6 lists the statistics of the boy’s secondary schools. Figure 9 presents the spatial distribution of this type of schools within the Kuwait districts.
5. Future Planning
MoE has an inventory of 268 unoccupied parcels in reserve for future educational facilities to meet the future demands for population growth. These parcels are distributed throughout the 707 urban blocks in Kuwait. Table 7 provides a summary of the relationship between the existing public school and the land reserved for future
Table 5. Distribution of public girl’s secondary schools.

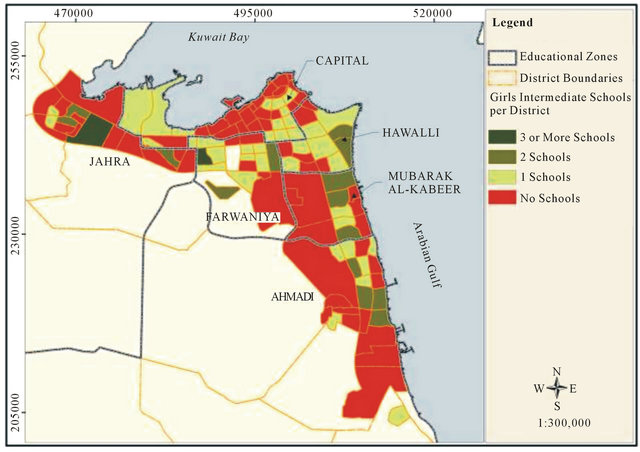
Figure 8. Kuwait public girl’s secondary schools.
Table 6. Distribution of public boy’s secondary schools.
school facilities. 25% of all urban blocks in Kuwait have at least one parcel in reserve for future educational facilities. This includes blocks that already have one or more schools and blocks that have no schools. Conversely, there are 75% of all urban blocks in Kuwait that have no land in reserve for future educational facilities. The data available for analysis did not distinguish residential from commercial and industrial classes, or population at the block level, within the urbanized area. This is may be one of the main reasons that increase the percentage of districts and blocks that have not schools of different stages.
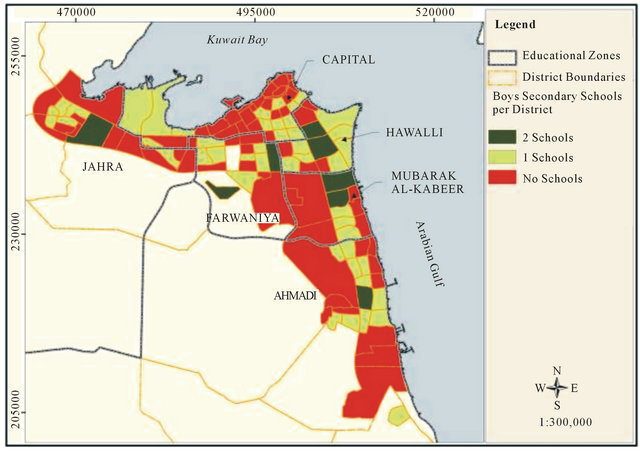
Figure 9. Kuwait public boy’s secondary schools.
Table 7. Summary of unoccupied lands.

GIS has enabled an improved understanding for the immediate needs of MoE to indentify urban residential blocks which had no unoccupied land in reserve. This, indeed, spatially prioritizes to the education policy makers to develop an action plan for the immediate requirements as well both medium and long term. Figure 10 presents the spatial distribution of these reserved parcels along the Kuwait urban area.
6. Conclusions
Kuwait is a developing country that has a rapid urbanization growth rate of 2.1, which requires an efficient planning mechanism for infrastructure to meet such rapid growth. MoE has faced such challenge and made a commendable job of managing and planning educational land uses until now, using the tools and information available. GIS technology was efficiently used to locate the number of schools at all levels per blocks and therefore to clearly evaluate the districts that failed to meet the MoE standard of single school per block. Unfortunately, 72% of the districts lack the existence of kindergarten schools, which require an urgent plan to resolve such critical problem. This kind of school at such younger age might require re-planning of allocating more than one school per block to ease the accessibility; only 12% achieved such high standard. This was also the case of the primary school where about 71% of the districts lack to host single primary school.
However, more detailed information is needed about future development, especially residential to more accurately plan for educational land reservations. If the detailed land use designations of the Kuwait Master Plan data were converted to GIS and incorporated into the
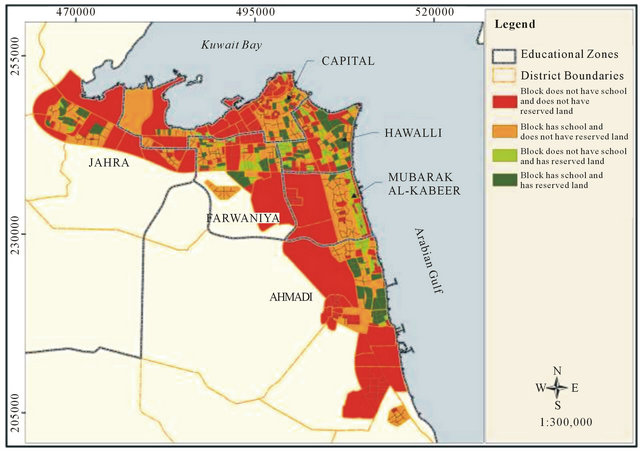
Figure 10. Distribution of unoccupied land reserves.
analysis GIS tools, the model would be enhanced to propose ultimate solution in a time dimension. For example, the existing model has shown a critical need to reserve additional land in residential blocks in Kuwait for preexisting development and to secure additional lands for the blocks and districts designated for future residential development. As more GIS data is developed and disseminated for Kuwait, the ability to model and analyze educational land use will be improved
7. Acknowledgements
The authors would like to express their appreciation and gratitude to the Ministry of Education (MoE) and Kuwait Institute for Scientific Research (KISR) for jointly funding the NEASI (SP001S) project. Further, we would like to thank the members of steering and technical committees for their continued support. Special thanks are due to the project team from MoE and KISR Geoinformatics Center.
REFERENCES
- Central Intelligence Agency, “World Fact Book,” 2012. https://www.cia.gov/library/publications/the-world-factbook/geos//ku.html
- D. J. Maguire, M. F. Goodchild and D. W. Rhind, “Geographical Information Systems: Principles and Applications,” Longman, Harlow, 1991.
- S. J. Hite, “GIS-Generated School Mapping Materials of Two Counties in Hungary Prepared for Françoise Caillods,” International Institute for Educational Planning, Paris, 2006.
- H. W. Calkins, “Local Government GIS Development Guides,” 1996. http://www.archives.nysed.gov/a/records/mr_pubGIS03.shtml
- R. Laurini and D. Thompson, “Fundamentals of Spatial Information Systems,” Academic Press, London, 1992.
- I. Heywood, S. Cornelius and S. Carver, “An Introduction to Geographical Information Systems (Third Edition),” Pearson Education Limited, Harlow, 2006.
- H. El-Gamily, A. Al-Othman and S. Al-Fulaij, “The National Educational Atlas for Services and Infrastructure-Phase 1,” Final Report, Kuwait Institute for Scientific Research, Safat, 2011.
- R. J. Shavelson, L. M. McDonnell and J. O. Rand, “What Are Educational Indicators and Indicator Systems?” Practical Assessment, Research and Evaluation, Vol. 2, No. 11, 1991.
- C. Acedo, M. Uemura, C. J. Thomas, Y. Nagashima and K. L. Ngow, “Education Indicators for East Asia and Pacific,” World Bank Report, Washington DC, 1999.
- European Commission Education and Culture DG Brussels, “Key Education Indicators on Social Inclusion and Efficiency,” Final Report, 2005-4751/001-001 EDU-ETU, Brussels, 2006.
- UNESCO Institute for Statistics, “Education Indicators Technical Guidelines,” UNESCO, Paris, 2009.
- I. Attfield, M. Tamiru, B. Parolin and A. DeGrauwe, “Improving Micro-Planning in Education through a Geographical Information System: Studies on Ethiopia and Palestine,” UNESCO Publishing, Paris, 2002.