Natural Science
Vol.5 No.4(2013), Article ID:30241,7 pages DOI:10.4236/ns.2013.54063
Spectroscopic measurement of Stark broadening parameter of the 636.2 nm Zn I-line
![]()
1Department of Physics, Laboratory of Lasers and New Materials, Faculty of Science, Cairo University, Giza, Egypt; *Corresponding Author: elsherbinia@yahoo.com
2Department of Physics, Collage of Science, AL-Imam Muhammad Ibn Saud Islamic University (AIMSIU), Al Riyadh, KSA
3Department of Laser and Opto-Electronic Engineering, University of Technology, Baghdad, Iraq
4College of Applied Medical Sciences, King Saud University, Riyadh, KSA
5The National Institute of Laser Enhanced Sciences, Cairo University, Giza, Egypt
Copyright © 2013 Ashraf M. EL Sherbini et al. This is an open access article distributed under the Creative Commons Attribution License, which permits unrestricted use, distribution, and reproduction in any medium, provided the original work is properly cited.
Received 10 February 2013; revised 12 March 2013; accepted 30 March 2013
Keywords: Stark Broadening Parameter; LIBS; OES; ZnO; Zinc Lines
ABSTRACT
In this article we will present an attempt to measure the Stark broadening parameter of the Zn I-line at 636.23 nm utilizing the optical emission spectroscopy (OES) technique, taking into consideration the possibility of existence of self absorption. This method is standing on comparison of the Lorentzian FWHM and spectral line intensity of the unknown Stark broadening parameter line (Zn I-636.23 nm—in our case) to a well known Stark parameter line (e.g. Zn I-lines at 472.2, 481 and 468 nm) at a reference electron density of 2.7 × 1017 cm−3 and temperature of 1 eV. We have utilized the emission spectral data acquired from well diagnosed plasma produced by the interaction of Nd: YAG laser at wavelength of 1064 nm with ZnO nanomaterial target in open air. The results indicates that the Stark broadening of the Zn I-line at 636.23 nm is centered at 5.06 ± 0.03 Å with a 25% uncertainty at the given reference plasma parameters. The knowledge of the Stark broadening parameter of the 636.23 nm line may be important in the diagnostics of the laser plasma experiments especially in the absence of the Hα-line.
1. INTRODUCTION
The measurement or/and the calculation of the Stark broadening parameter of emission spectral lines is of prime importance in different fields e.g. plasma diagnostics, modeling and investigation of interstellar atmosphere [1,2].
Different plasma sources were employed e.g. the gasdriven shock tubes [3], wall-stabilized arcs [4-10], lowpressure pulsed arcs [11] and plasma jets [12]. In these investigations, temperature and electron density values were at the ranged of 0.85 - 2.2 eV and 1016 - 1017 cm−3, respectively.
The Stark profiles of atomic lines in plasma are produced under the action of the low-frequency fields of ions and/or under the action of high-frequency fields of electrons [13-15].
The contribution of the high frequency micro field electrons to line broadening was assumed as a collision broadening which is the most important effect of distant non-adiabatic encounters and was treated in terms of perturbation theory [14]. These moderated fields act not to split the upper emitting state, but it rather acts to broaden the emitted line. It was shown earlier that this effect leads to inhomogeneous broadening of spectral line i.e. the emitted line become of Lorentzian shape on contrast to other broadening mechanisms e.g. Doppler effect which leads to a homogeneous broadening [15].
In order to investigate the Stark broadening parameter of any spectral line, a source of light as well as a suitable analytical technique should be employed. One of the promising light sources is the plasma produced via laser interaction with matter in what is called LIBS (Laser Induced Breakdown Spectroscopy) or laser ablation.
Two measurable parameters are utilized to describe the thermodynamical state of the plasma; namely plasma electron density and temperature. Both quantities can be measured spectroscopically via a reliable optical technique called optical emission spectroscopy (OES). In this technique, one has to assume that the emitted light from the plasma is sufficiently influenced by the plasma parameters. In normal laboratory plasmas excited via laser ablation, the plasma is characterized by a density in the range around 1017 cm–3 and temperatures of around 1 eV which indicate the existence of the plasma in local thermodynamical equilibrium (LTE) regime [16].
The emitted spectra from plasma contain a wealth of information that are stored in the emitted line shape as well as the continuum radiation often appeared under the emitted lines. The relative spectral radiance (in the units of counts per sec) of some emitted lines can be related to the plasma temperature while the Lorentzian full width of the line at half of the maximum spectral radiance (FWHM) is usually contains information about electron density and/or ion density [14-16].
In the measurements of the Stark broadening parameters, certain criteria should be fulfilled and are summarized as following [17]:
• The plasma source must be well diagnosed (i.e. is of well known electron density and temperature), homogeneous and appear quasistatic during the period of observation;
• The electron density and temperature should be measured independently of the investigated line;
• Other broadening mechanisms should be calculated and compared to the Lorentzian FWHM;
• The investigated spectral line should be optically thin.
However, the condition imposed on the optical depth of line raises the following question; what if the line is optically thick! In this article, we shall take the optical depth of the line into consideration.
The Zn I-lines are of interest and have been observed in many stellar plasma as well as the solar spectra [18]. The Stark broadening parameter of the Zn I-triplet lines at 468, 472.2, 481, 328.23, 330.23, and 334.5 nm can be found at different tables as measured and/or calculated according to different models and extensively collected and reviewed at references, see for example [17-19].
For unknown reason and after a careful revision of the different tables, the Stark broadening parameter of the Zn I-line at 636.23 nm was found not found either theoretically predicted or experimentally measured.
In this article we shall present a simple and straightforward method to measure experimentally the Stark broadening parameter of the Zn I-line at 636.23 nm. This is in order to use this line to measure the electron density of the plasma produced by laser interaction with a nano as well as bulk ZnO material whereas the Hα-line [20-22] may not any longer be appeared, especially in the interaction of laser with nanomaterials.
2. THEORETICAL BASIES
For a well resolved, optically thin spectral line, the spectral radiance  over line labeled (k), centered at wavelength
  as a result of a transition from upper state of energy Ek, and having a statistical weight of gk and a transition probability of Am can be expressed as [16]:
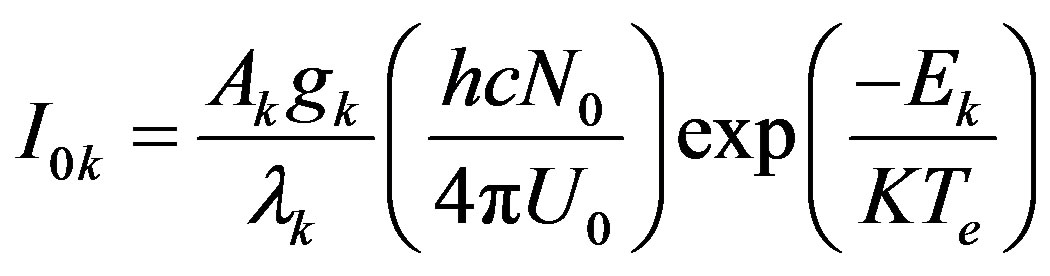 (1)
(1)
 Is the population density of the ground state per unit statistical weight (U0 is the partition function of the ground state, h and c having their usual meaning,
  is plasma electron temperature. If this line is subjected to certain absorption, its spectral intensity should decreases to
 . The amount of decrease was quantified by the coefficient of self absorption
  [16]:
[16]:
 (2)
(2)
where  is the optical depth of a homogeneous plasma slap [16]. Eq.2 indicates that
  varies from unity in case of pure optically thin line to the limit of zero in case of completely self absorbed line [22].
Not very recently, the author was suggested that the same physical quantity  can be expressed in terms of the ratio
  of the Lorentzian full width at half of the maximum (FWHM) components of the same spectral line with and without absorption [22]:
 (3)
(3)
 is the plasma electron density as measured from the suspected line (labeled-k) and
  is the electron density as derived from the optically thin Hα- line (which should appeared in the same emission spectrum under the same experimental condition). Eq.3 also indicates that
  is in the range from zero in the case of completely absorbed line to unity in the case of perfectly optically thin line.
As an extension to the previous work, we shall define the ratio of the self absorption coefficients of two lines labeled (k & u), one at the transition wavelength (k) with known Stark broadening parameter and the other at wavelength labeled (u) with unknown Stark parameter as . Consequently, the term
  in Eq.3 would be canceled, and with the help of the expression
  plugged in Eq.3, the relative self absorption coefficients should read:
 (4a)
(4a)
After a rearrangement to Eq.4a we can get  in terms of
  as;
as;
 (4b)
(4b)
The ratio  of the Lorentzian FWHM of both lines (labeled-u, k, respectively) can be measured experimentally with fair precision via fitting of the emitted spectral line profiles to the Voigt line shape [15,16, 22]. On the other hand, the
  ratio can be expressed, with the help of Eq.2 for the two lines k & u as:
 (5a)
(5a)
The term  is the experimentally measured relative spectral radiance at the lines centers (in the units of counts/sec), while the term
  is the well known theoretical relative intensity of the two lines which can be expressed as:
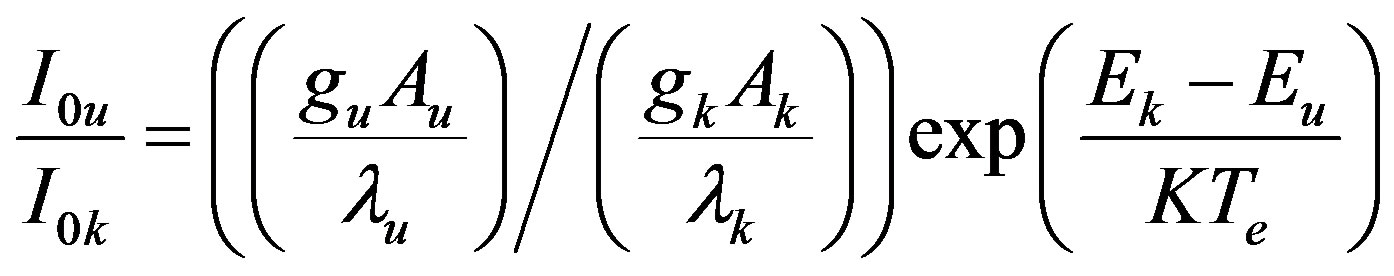 (5b)
(5b)
After combining Eqs.5a and b then substitute in Eq. 4b, the unknown Stark broadening parameter coefficient  can be expressed as;
 (6)
(6)
With the measurement of the relative Lorentzian FWHM of the two different lines  together with their spectral intensities at the lines centers
 , one can evaluate the Stark broadening of the unknown line
  in terms of the well known parameter
and other known atomic quantities.
It is worth noting that the term  is unity if both lines are originated from the same upper state, otherwise, it should be taken into consideration with a rough knowledge of
3. EXPERIMENTAL SETUP
In this article we shall utilize the data gained from the interaction of the high peak power Nd: YAG laser with nano and bulk targets in open air and was published earlier at Ref [21]. The experimental setup is shown in Figure 1 and described in details in a previous publication [21]. The irradiation system comprises an Nd: YAG laser able to deliver an energy of 650 mJ/pulse at the fundamental wavelength 1064 nm, at constant duration of 5 ns.
The detection system consists of an SE-200 echelle type spectrograph equipped with time gated Andor iStar®-ICCD camera. The emitted light from plasma is spatially integrated and collected at the entrance hole of spectrograph via a 25 μm quartz fiber, positioned, with the help of precise xyz-translational stage holder, at 15 mm from the laser-plasma axis. In this article we have utilized the acquired data resulted from the plasma generated from the nano ZnO target only. The relative spectral response of the camera-MCP (Micro channel plate) and spectrograph including optical fiber over the entire wavelength window from 200 to 1000 nm was measured using a Deuterium-Halogen lamp (type, DH-2000-CAL). The processing of the experimental data was carried out using home-made routine built under the MATLAB7® package [23].
4. RESULTS AND DISCUSSION
Before the application of Eq.6, one has to choose the
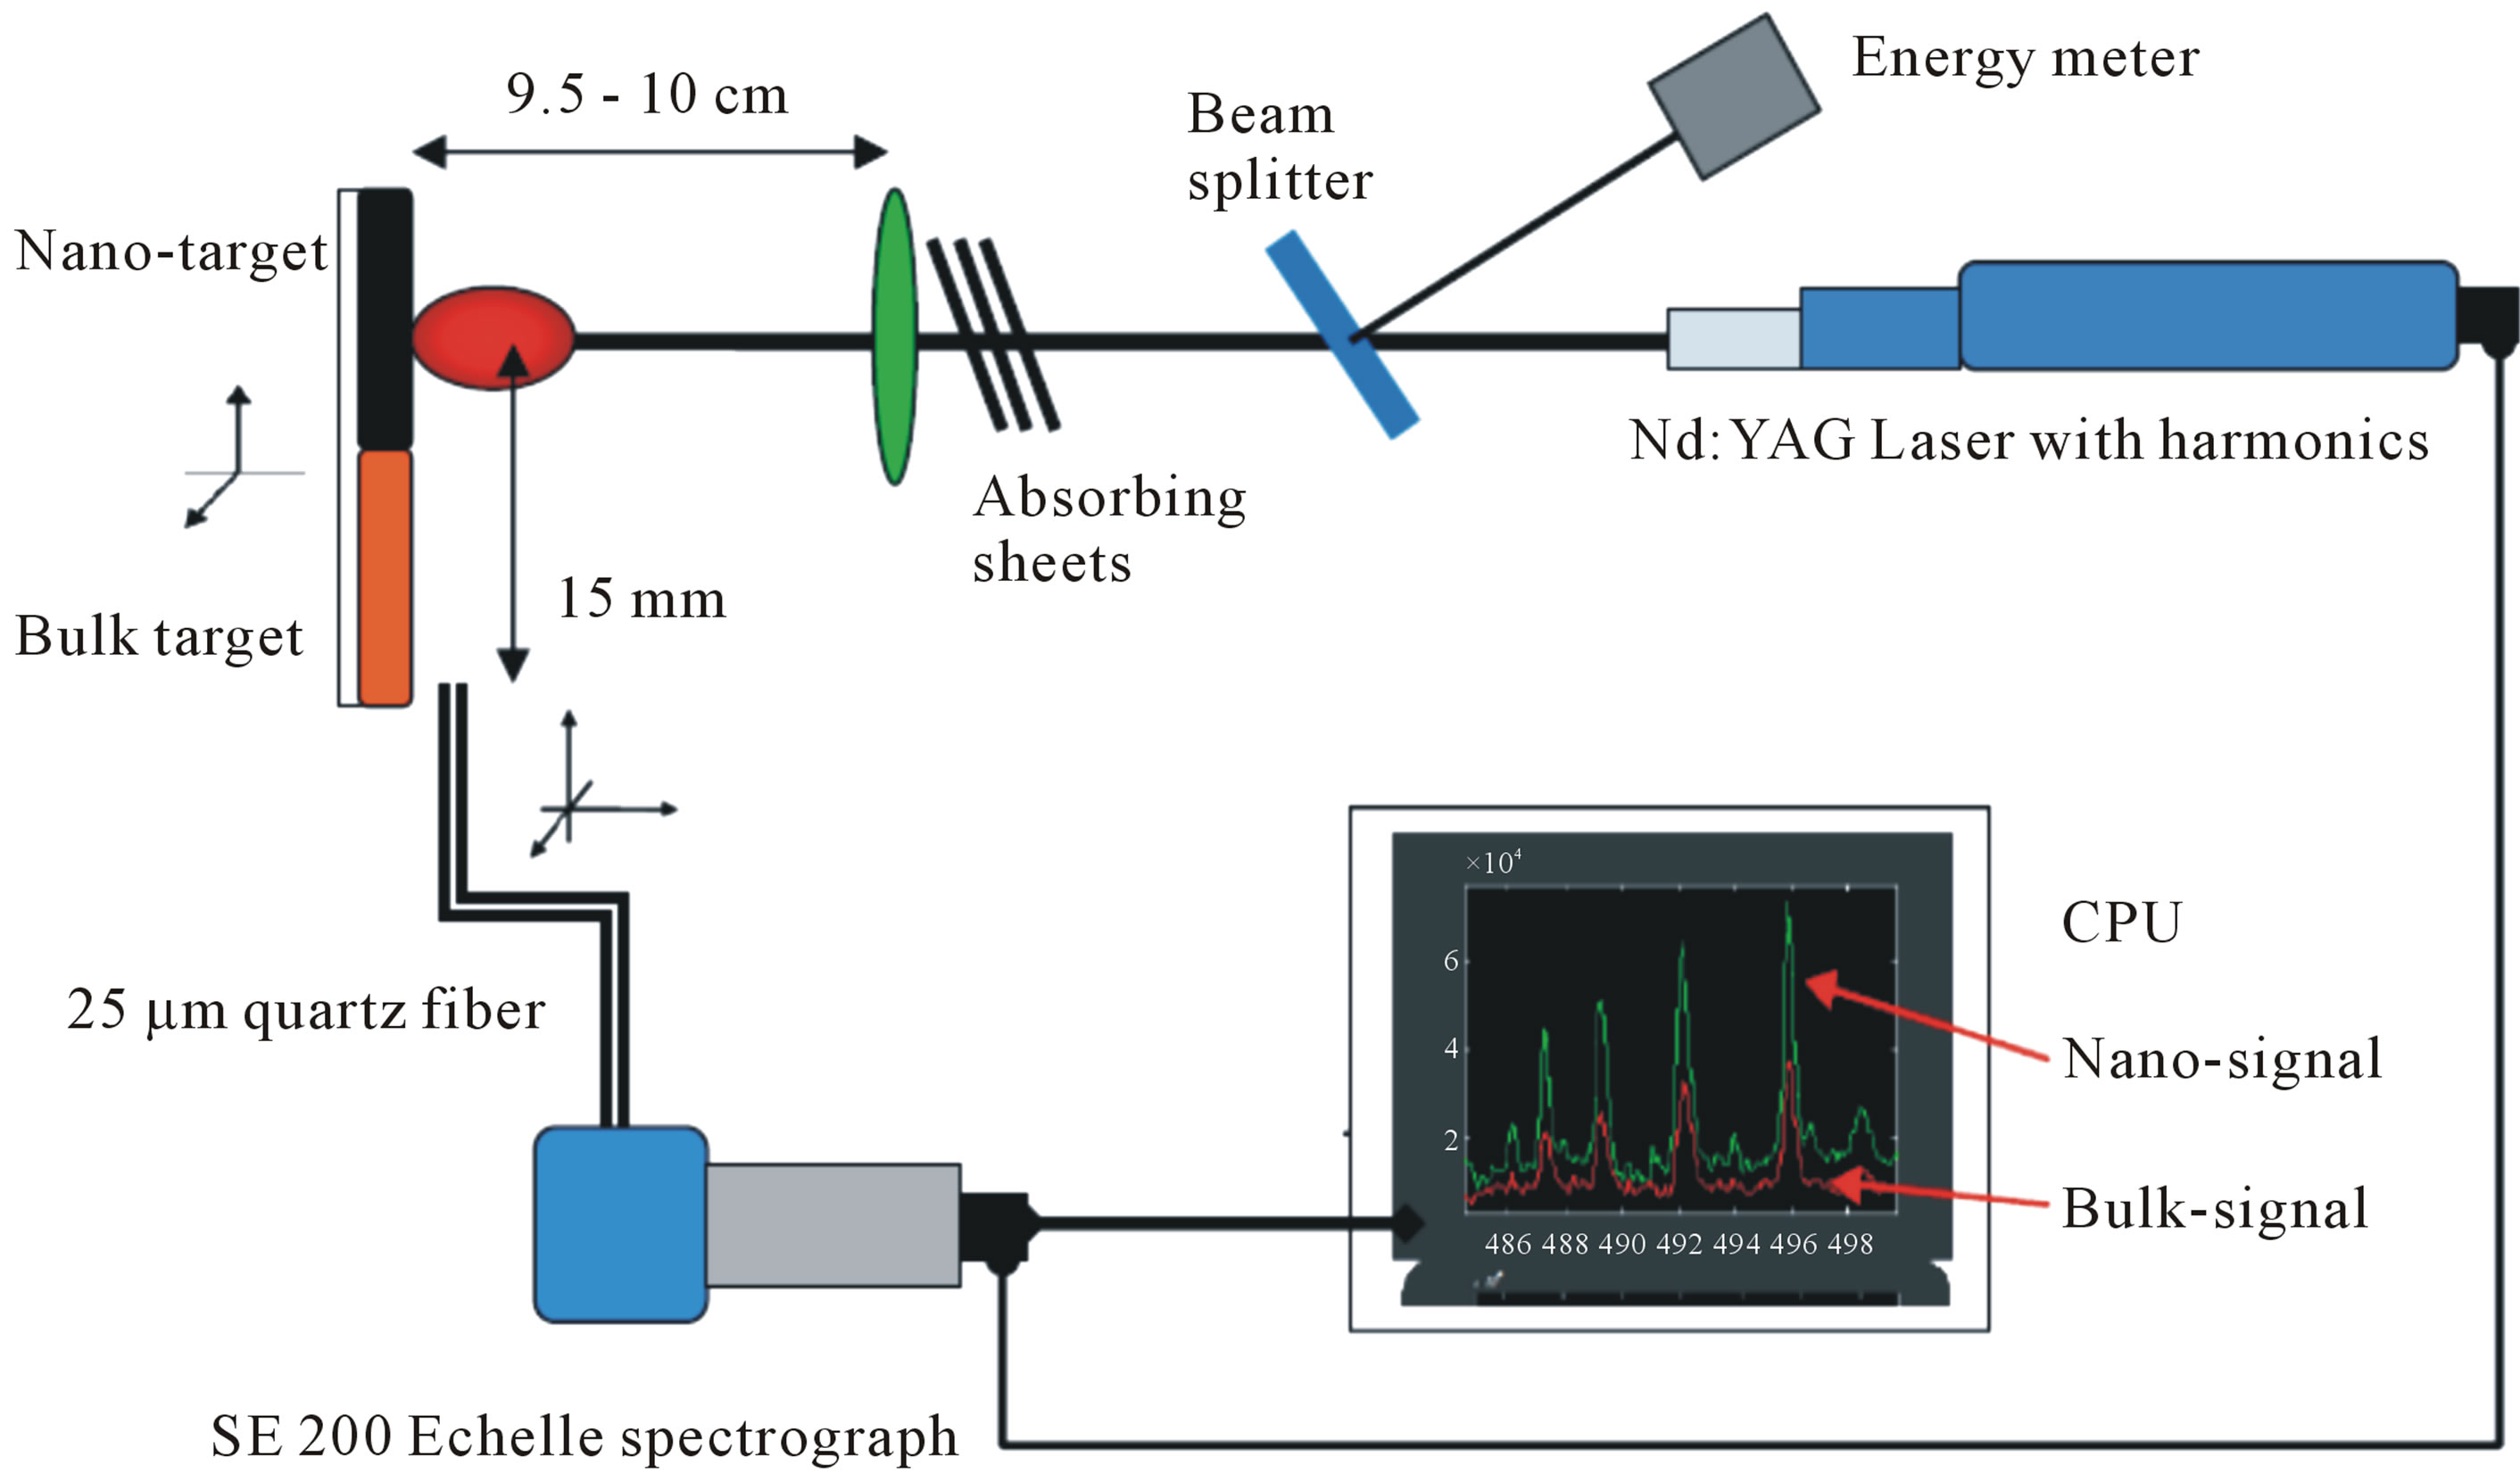
Figure 1. Experimental setup.
suitable experimental plasma condition i.e. the suitable delay and gate times at which the measured plasma electron density and temperature are close as much as possible, to the values of the plasma parameters at which the known Stark broadening parameters  are given at the standard tables [17-19]. It is worth noting that, the data of the known
  given at references [17-19] were measured and/or calculated at two different reference electron density values namely; 4.5 × 10¹⁷ and 1 × 1017 cm–3 at 1 eV, therefore, we have considered the average electron density (i.e. 2.7 × 1017 cm–3 at 1 eV) as our reference plasma parameters with the corresponding values
  at each line are given at Table 1.
Fortunately, a fine inspection to the measurements made before to a plasma initiated via interaction of laser with nanomaterial ZnO target (published in reference [21]) shows that the suitable plasma experimental condition (electron density of 2.5 ± 0.2 × 1017 cm–3 and temperature of 0.997 ± 0.1 eV) was only, at a delay time of 2 μs and gate time of 1 μs. This means that, we shall apply Eq.6 to the analyzed light emerged from a plasma having electron density of 2.7 × 1017 cm–3 [21] (which will be taken as the reference density Nr) at the reference electron temperature of 1 eV. It is worth noting that, these values of the measured plasma parameters ensure the existence of our plasma in the LTE condition
Figure 2 shows the recorded emission spectrum from the Zn-I lines at delay time 2 μs and at a gate time of 1 μs. A relatively small continuum component appeared under the lines resulted from the free-free transitions of the fast
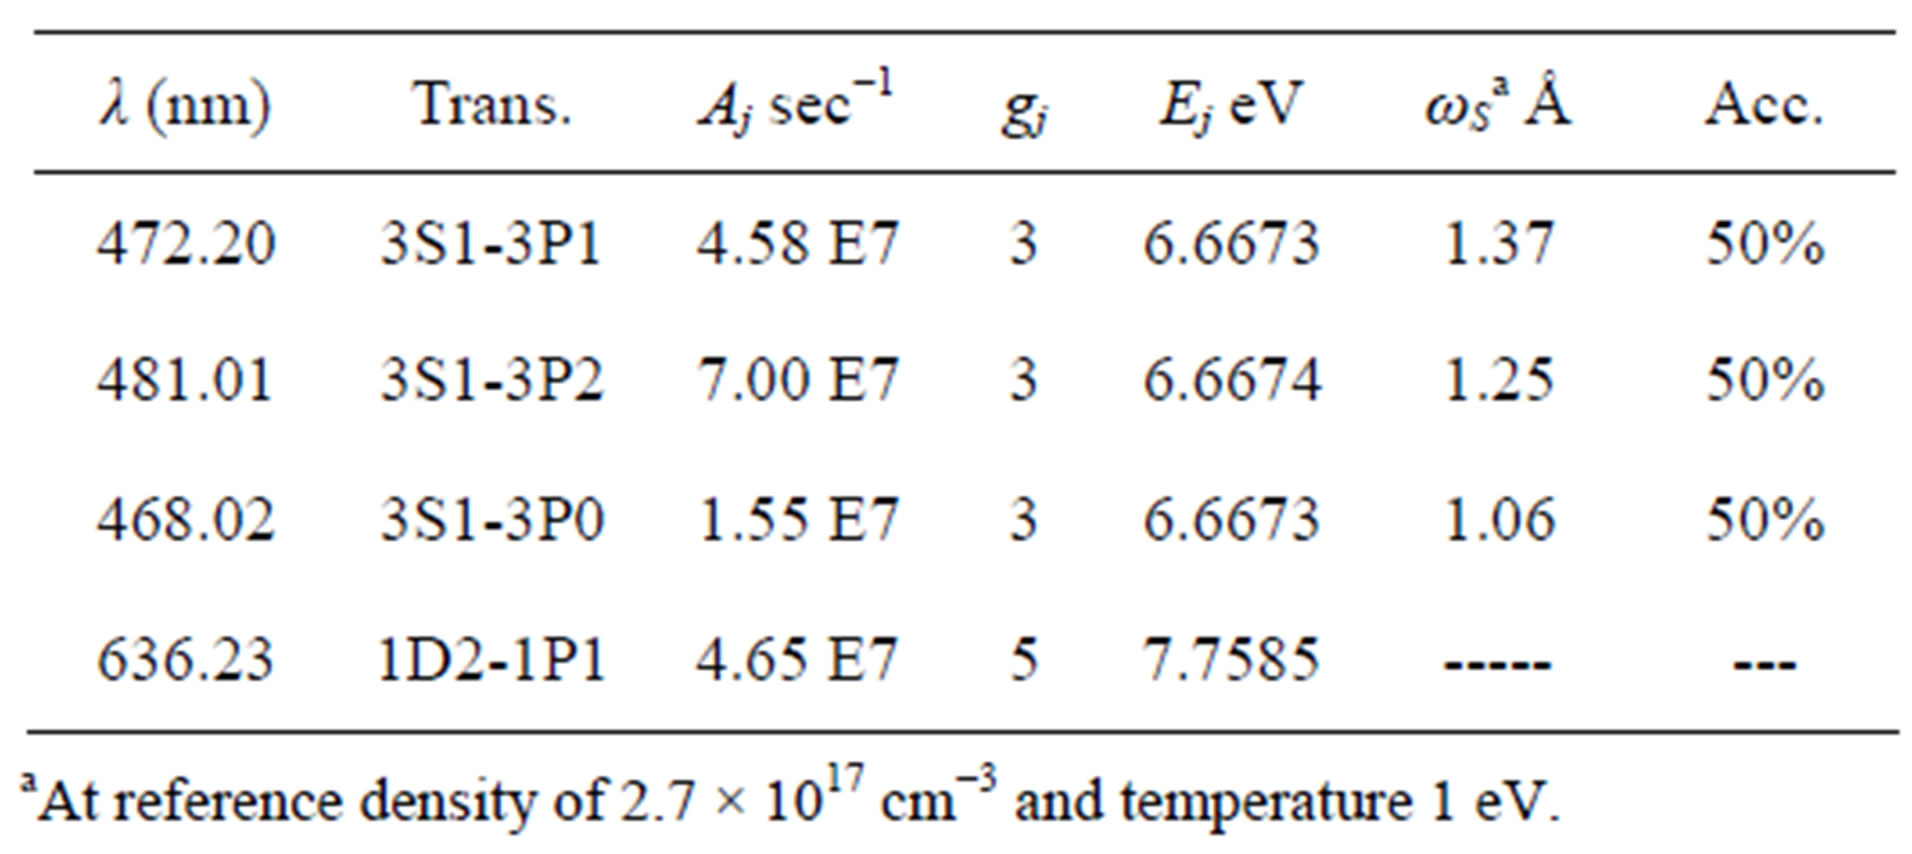
Table 1. The used atomic parameters of the used Zn I-lines together with Stark broadening parameters at the given reference electron density and temperature.

Figure 2. The emission spectrum from zinc plasma at the Zn I-lines taken at delay time of 2 μs and gate time of 1 μs.
electron in plasma (Bremsstrahlung) as well as the freebound transitions (Recombination). This component was omitted before proceeding to analyze the spectral lines. Homemade software was built for such purpose and published at reference [23].
In order to examine the reliability of the method, the following procedures were done; First we have considered the line emitted from the Zn I at 472.2 nm as the line of the known Stark broadening parameter coefficient ωsk (472.2 nm) = 0.137 nm at Nr = 2.7 × 1017 cm–3, Te = 1 eV, then we have applied Eq.6 to predict the Stark broadening parameter of the Zn I-line at the Zn I-line at 481 nm which acts now as the unknown parameter line.
Conditionally, if the suggested method is reliable, then the predicted value for this line should be ωsk (481 nm) = 0.125 nm at Nr = 2.7 × 1017 cm–3, Te = 1 eV.
Second; we have applied the same procedure to predict the same coefficient for the Zn I-line at 468 nm, which should give the following parameter value ωsk (468 nm) = 0.106 nm at Nr = 2.7 × 1017 cm–3, Te = 1 eV.
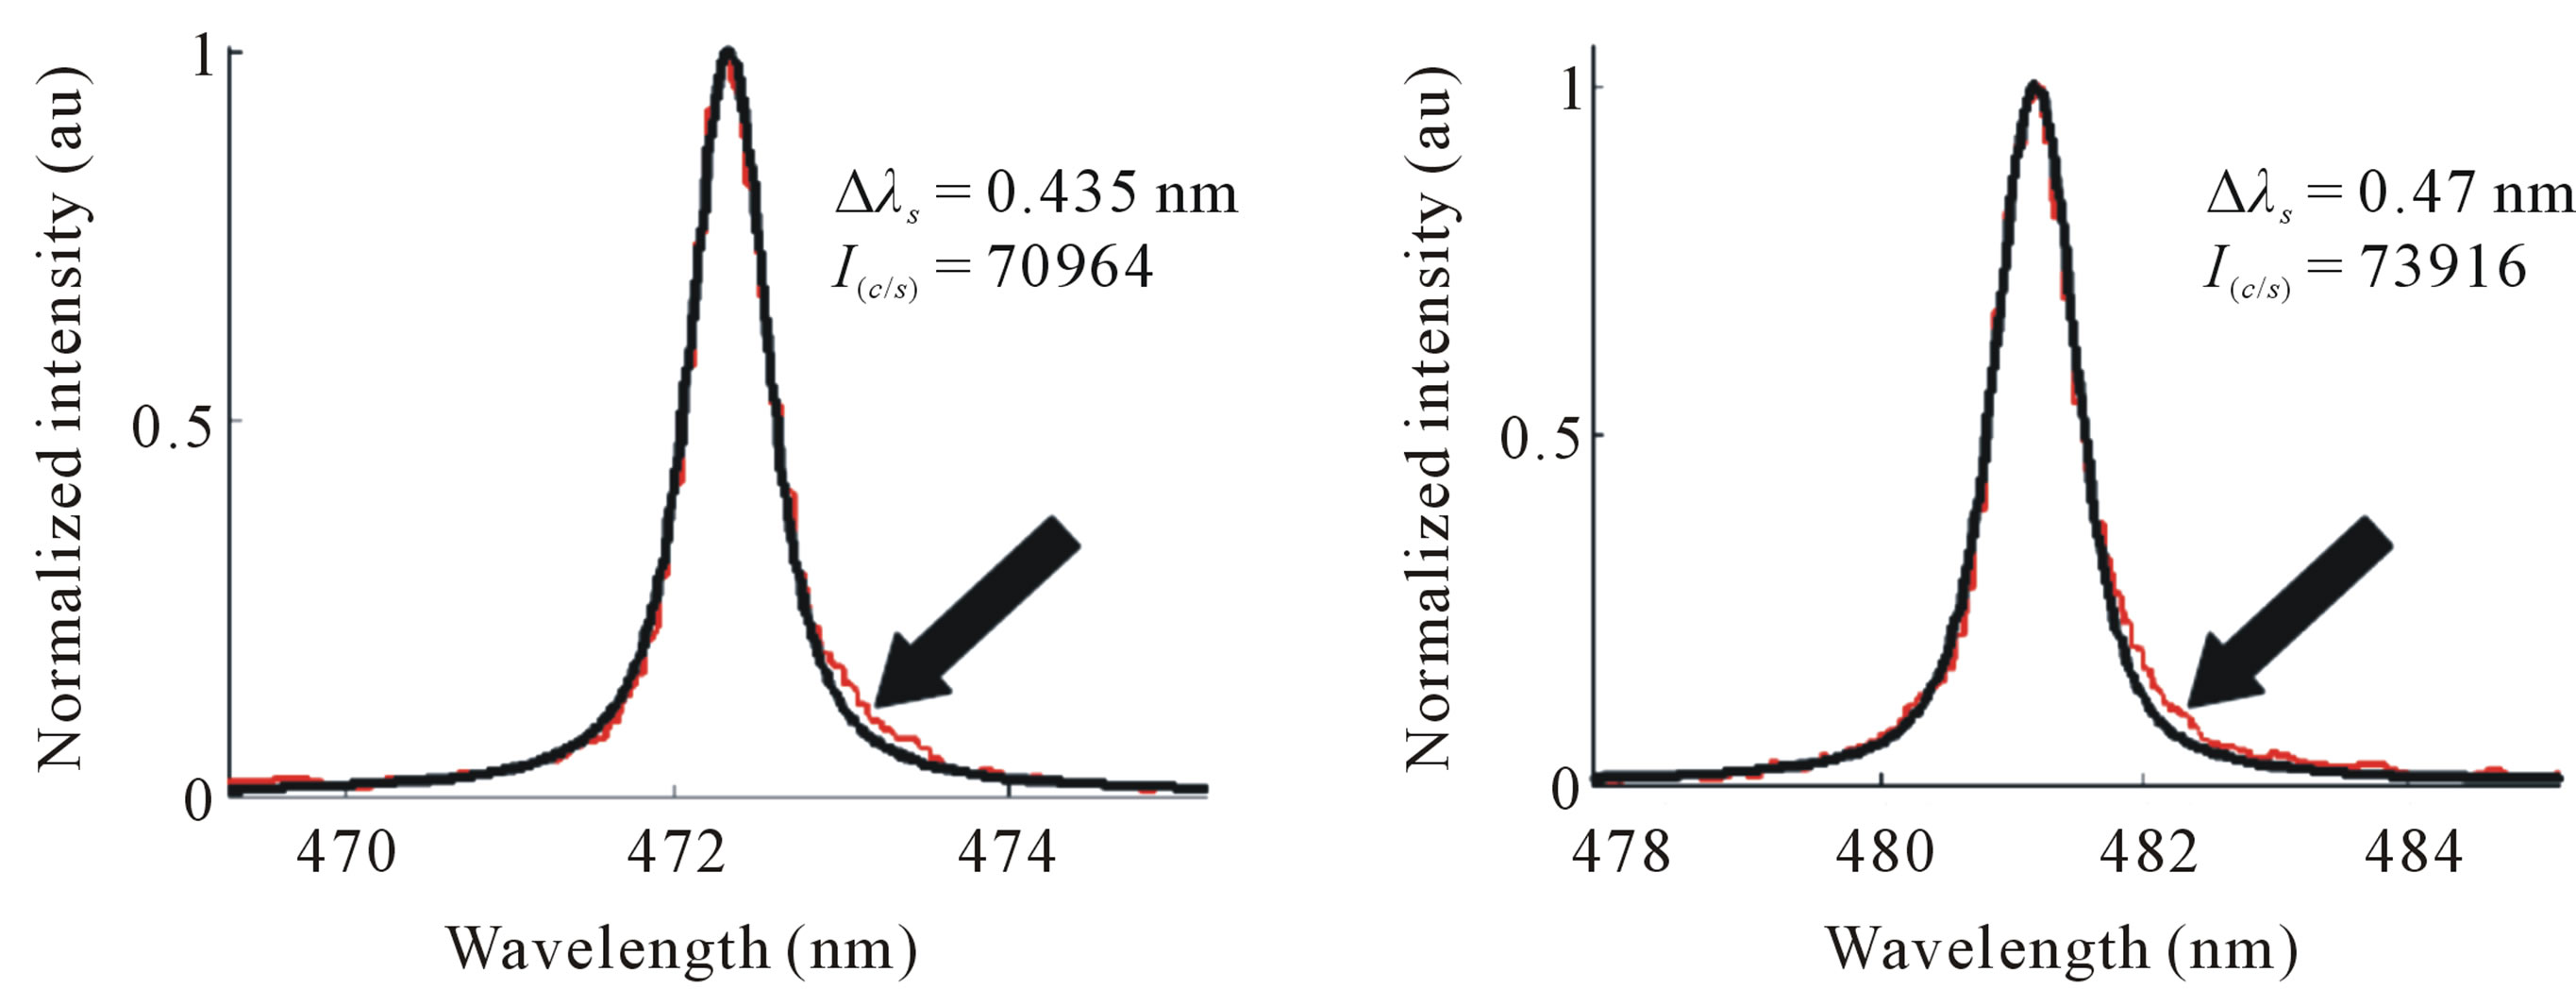
The Lorentzian FWHM of either line at wavelengths of 472.2, 468 and 481 nm was extracted via fitting of the experimentally measured spectral line shape to the Voigt line shape taking the instrumental broadening into account. It is worth noting that, at the recommended reference electron temperature of 1 eV, the Doppler broadening component of the line FWHM was found ~0.04 nm and hence, it can be neglected without too much error. Moreover, other broadening mechanisms e.g. Van der Wall and resonance broadening were found very small and contributes to the line FWHM by nearly 0.01 nm and they also can be neglected.
On other hand, the ion broadening component, which manifests itself on the form of certain line asymmetry, was recognized as shown at Figure 3 (indicated by black arrows) and hence, it was taken into consideration as a source of error in the fitting and was found to produce an error in the fitting by about 20%.
The spectral radiance of the lines was measured in the units of counts per sec (as given on the set of Figure 3) at the lines centers using the same software program after the subtraction of the continuum components appeared under the lines [23]. The atomic parameters of the different Zn I-lines are given at Table 1.
The results of the suggested method to predict the Stark broadening parameters of the known Zn I-lines at wavelengths of 481 and 468 nm are presented at Table 2" target="_self"> Table 2. It is important to notice that, the given values at references [17-19] of the broadening parameters are subject to accuracy higher than 50% and hence an uncertainty lower than 50%. This uncertainty was taken into consideration in the calculation of the combined errors due to different sources (including uncertainty in the given transition probabilities).
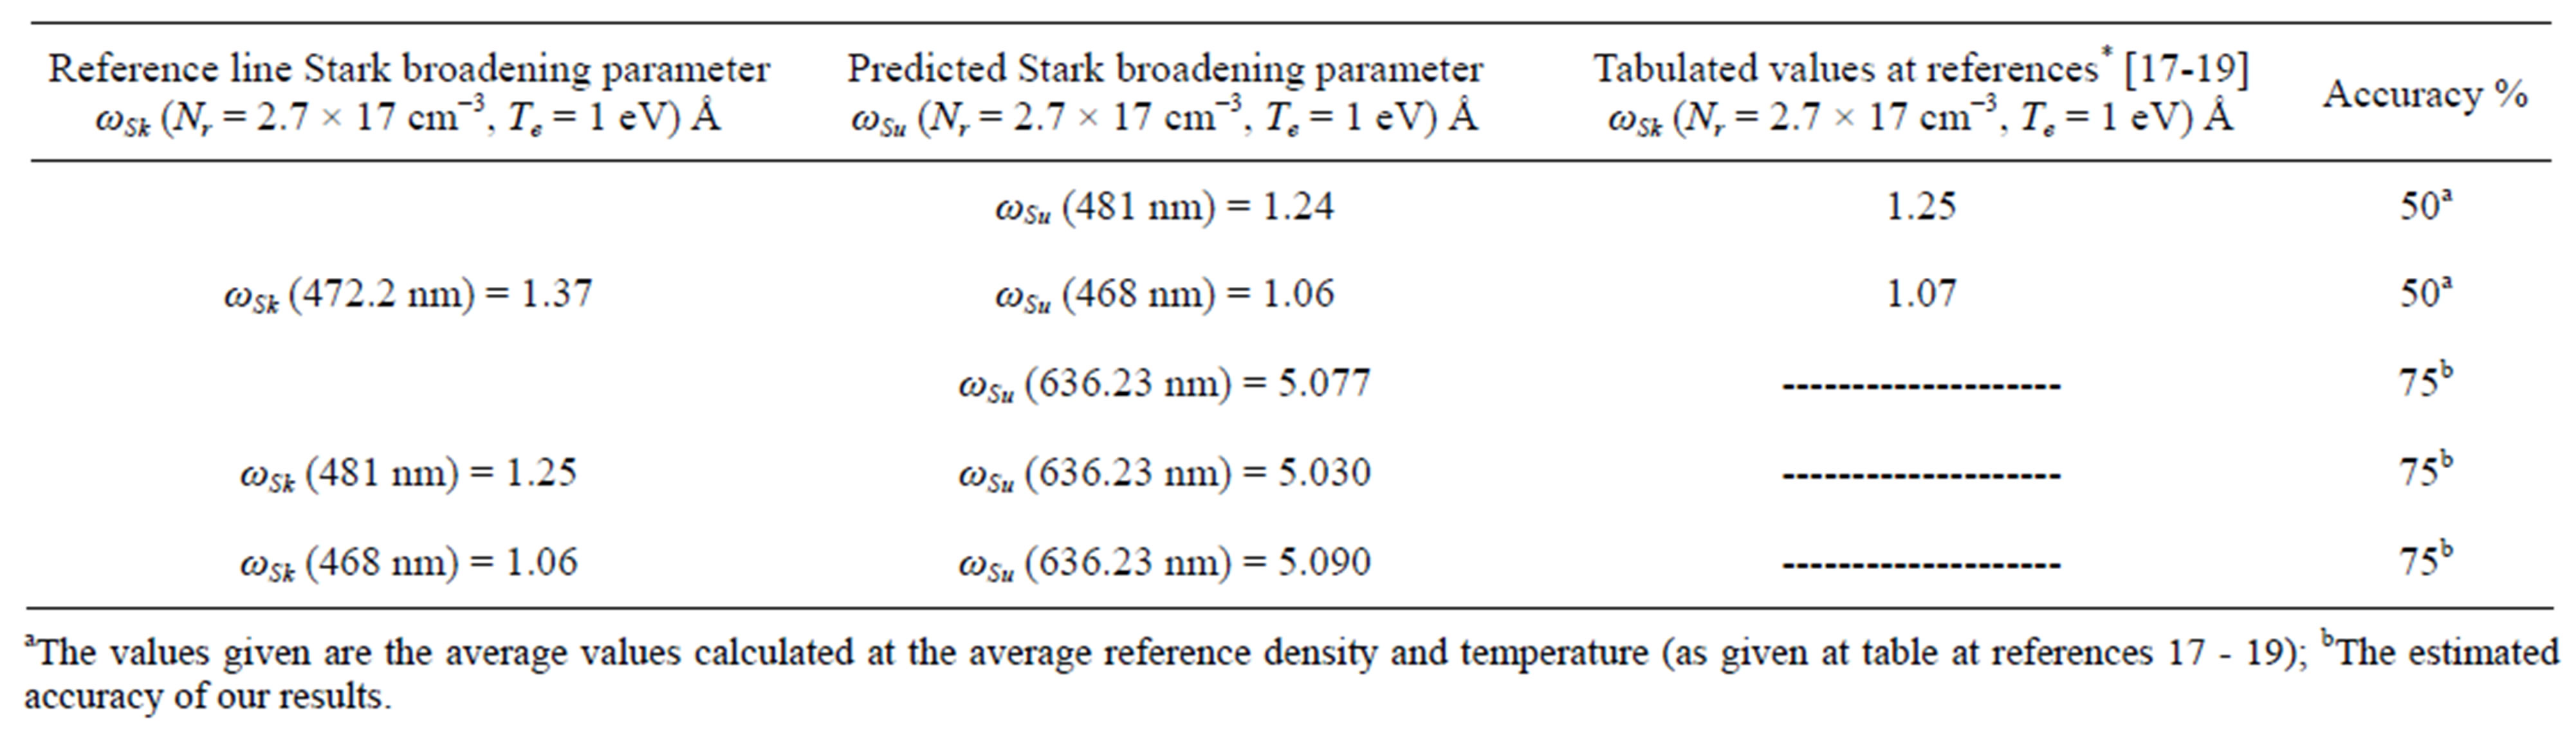
Table 2. The results of the measurement of the Stark broadening parameter of the Zn I line at 636.23 nm.
 (a)
(a)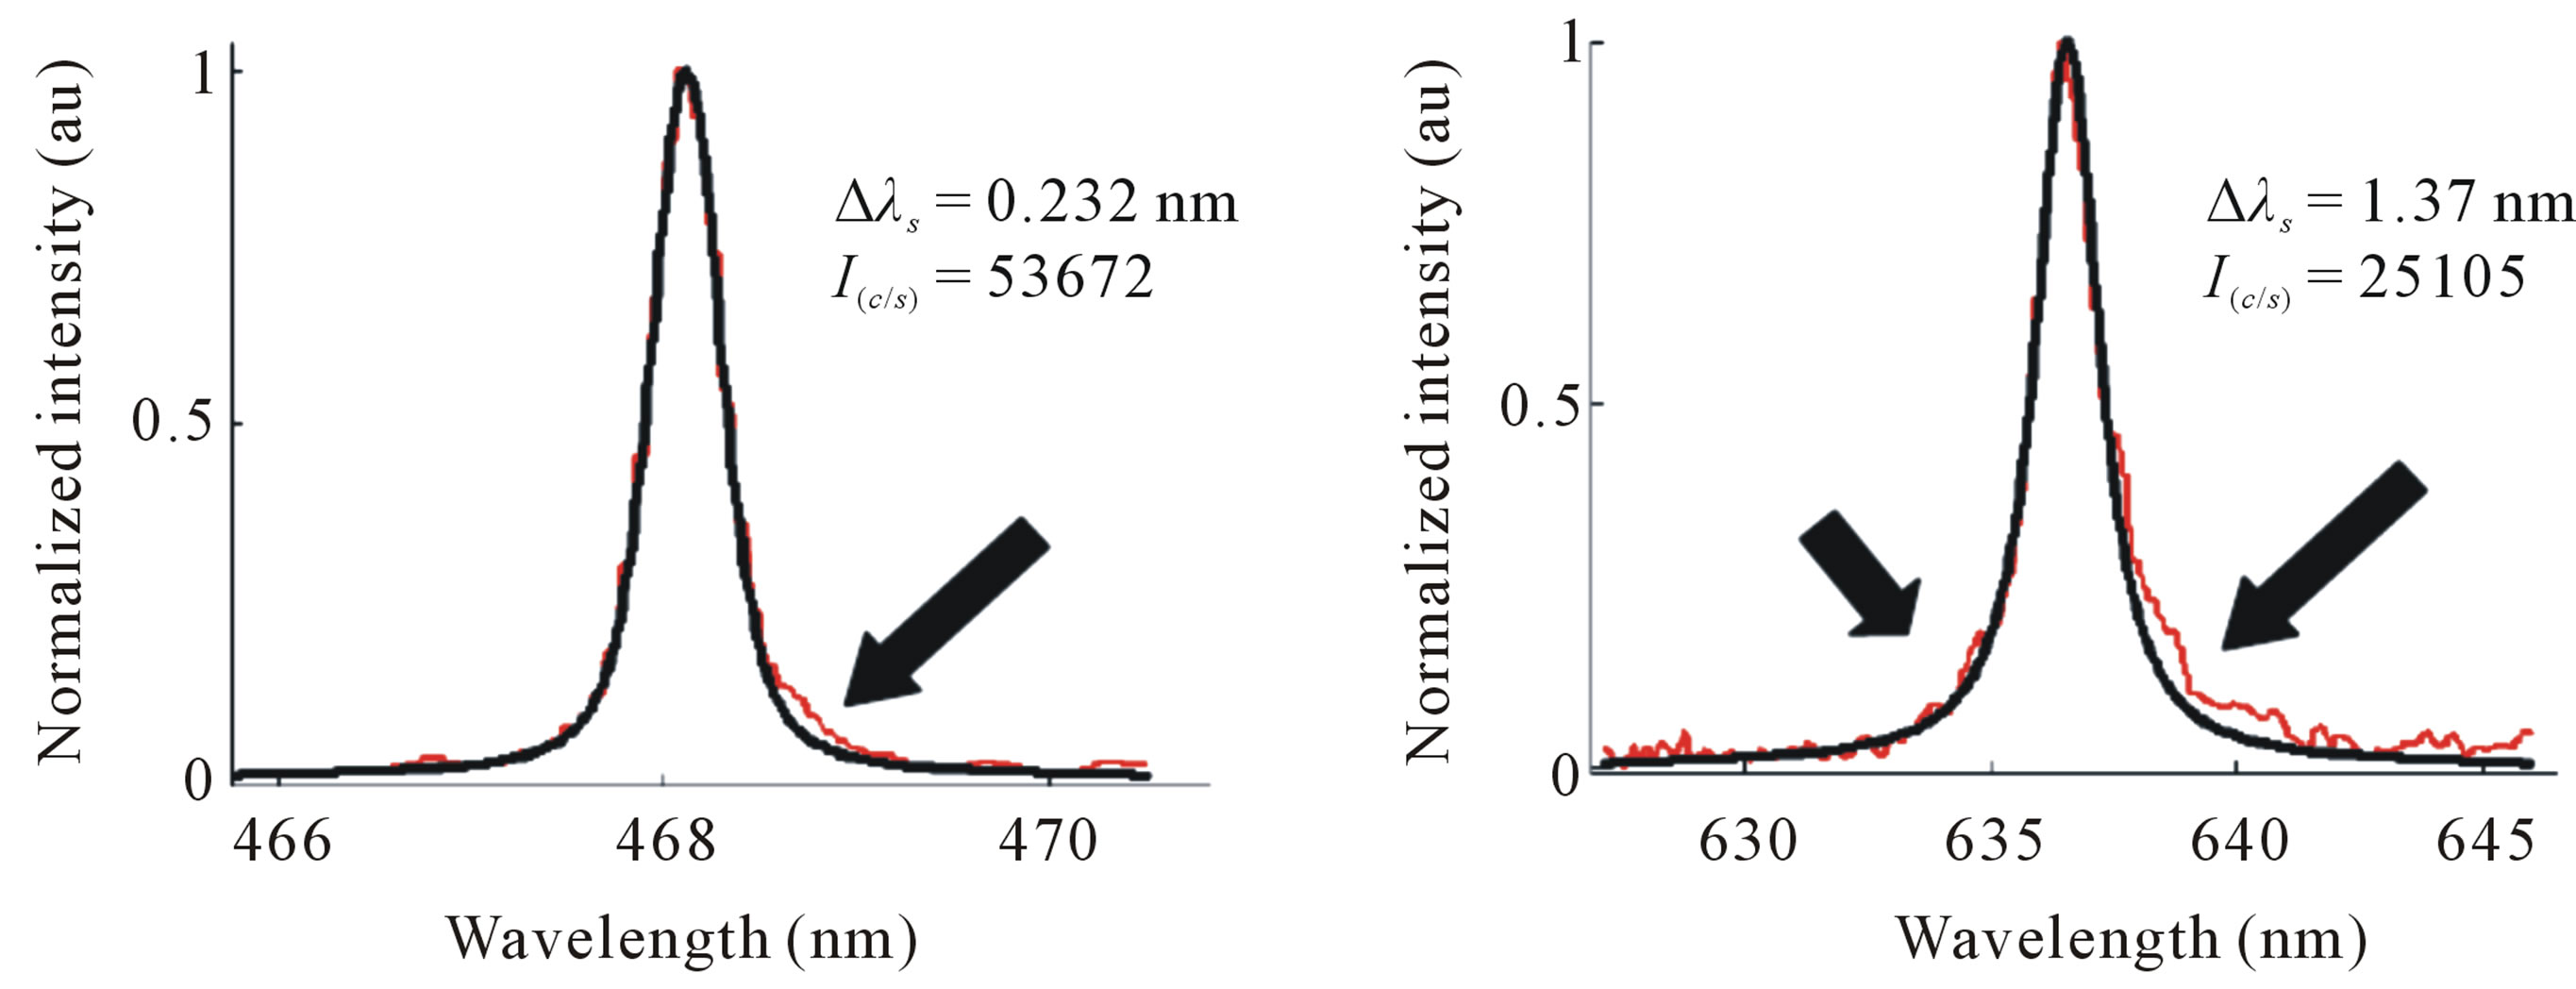 (b)
(b)
Figure 3. Shown is the fitting of the different experimentally measured spectral lines shapes (red curve) (a)-(d) to the Voigt line shape (black curve) and the extracted Lorentzian FWHM as well as the spectral intensities are also given in beneath. The black arrows indicate the existence of the line asymmetry.
The overall uncertainty was found reduced to 25%, which means that the accuracy in our estimated values of the Stark broadening parameters is in the range around 75%. This is may be attributed to the nature of the power dependence in Eq.6.
Moreover, Table 2 presents the final results of the predicted value of the Stark broadening parameter of the Zn I-line at 636.23 nm in terms of the known  of the three different Zn I spectral lines at 472.2, 481 and 468 nm. The close values of the final results, regardless of the used reference line indicate the reliability of the suggested method.
Finally and because of the lack of theoretically calculated or other experimentally measured value to the Stark broadening parameter of the Zn I-line at 636.23 nm, we are not able to extensively discuss the final result about the value of the measured parameter (5.06 ± 0.3 Å) and we shall left that to future theoretical work.
5. CONCLUSIONS
In this article we have extended a method of estimation of the Stark broadening parameter to certain line via optical emission spectroscopy to measure the broadening parameter of the Zn I-line at 636.23 nm.
We have been used a reference line of known Stark parameter (Zn I-lines at 472.2, 481, 468 nm) at an electron density of 2.7 × 1017 cm3 and temperature of 1 eV. The direct comparison of the Lorentzian FWHM and the spectral radiances of the unknown Stark parameter at 636.2 nm to the known Stark parameter of the Zn I-lines together with atomic quantities enable us to roughly estimating the parameter which was found to be centered at 5.06 Å with error margins around 25%. This method provides a very quick method to estimate the Stark broadening parameter of certain lines. The Stark broadening parameter of the line at 626.23 nm is vital in utilizing the line to measure the electron density of the plasma produced from nano and bulk material targets as will be demonstrated in next publication.
6. ACKNOWLEDGEMENTS
This work was financially supported in part by the Iraq Scholar Rescue Fund Project (Institute of International Education, Washington DC, 2005). The experimental part was conducted at the Laboratory of lasers and New Materials; Faculty of Science, Cairo University and it is dedicated to the memory of souls of the Egyptian martyrs during our revolution on January 25, 2011.
REFERENCES
- Dimitrijevic, M.S., Kovacevic, A., Simic, Z. and SahalBrechot, S. (2011) Stark broadening of several Ne II, Ne III and O III spectral lines for the Stark-B database. Baltic Astronomy, 20, 580-586.
- Simic, Z., Dimitrijevic, M.S., Kovacevic, A. and SahalBrechot, S. (2011) Stark broadening of In III lines in astrophysical and laboratory plasma. Baltic Astronomy, 20, 613-617.
- Miller, M.H. and Bengtson, R.D. (1970) Measured Stark widths and shifts for neutral atomic lines. Physical Review A, 1, 983-990. doi:10.1103/PhysRevA.1.983
- Schinkoth, D., Kock, M. and Schulz-Gulde, E. (2000) Experimental Stark broadening parameters for near-infrared Ar I and Kr I lines. Journal of Quantitative Spectroscopy and Radiative Transfer, 64, 635-643. doi:10.1016/S0022-4073(99)00155-7
- Stark, M.J. (1994) Width measurements of neutral argon lines and comparison with analogous transitions for homologous atoms. Acta Physica Polonica, 86, 315-326.
- Bues, I., Haag, T. and Richter, J. (1969) Spectroscopic investigation of an argon arc plasma. Astronomy & Astrophysics, 2, 249-250.
- Jones, D.W., Pichler, G. and Wiese, W.L. (1987) Asymmetries in spectral lines due to plasma-ion broadening: Some unusual cases and a possible test for plasma homogeneity. Physical Review A, 35, 2585-2590. doi:10.1103/PhysRevA.35.2585
- Jones, D.W., Wiese, W.L. and Woltz, L.A. (1986) Ion broadening of Ar I lines in a plasma. Physical Review A, 34, 450-456. doi:10.1103/PhysRevA.34.450
- Hahn, T.D. and Woltz, L.A. (1990) Ion broadening parameters for several argon and carbon lines. Physical Review A, 42, 1450-1453. doi:10.1103/PhysRevA.42.1450
- Jones, D.W. and Wl, W. (1984) Asymmetry patterns of plasma-broadened isolated lines (C I). Physical Review A, 30, 2602-2608. doi:10.1103/PhysRevA.30.2602
- Aparacio, J.M., Perez, C., del Val, J.A., Gigosos, M.A., de la Rosa, M.I. and Mar, S. (1998) Measurement of Stark-broadening and shift parameters of several Ar I lines. Journal of Physics B, 31, 4909-4918. doi:10.1088/0953-4075/31/22/004
- Bakshi, V. and Kearney, R.J. (1989) Measurement of Stark width of some Ar I transitions in a d.c. argon plasma jet at atmospheric pressure. Journal of Quantitative Spectroscopy and Radiative Transfer, 42, 405-413. doi:10.1016/0022-4073(89)90008-3
- Shojin, G.V., Demura, A.V. and Lisitsa, V.S. (1973) Theory of Stark broadening of hydrogen lines in plasma. Soviet Physics—JETP, 37, 1057-1065.
- Griem, H.R. (1964) Plasma spectroscopy. McGrow-Hill, Inc., New York.
- Griem, H.R. (1974) Spectral line broadening by plasmas. Academic Press, New York.
- Kunze, H.J. (2009) Introduction to plasma spectroscopy. Springer Series on Atomic, Optical and Plasma Physics, Springer, Berlin.
- Konjevic, N., Lesage, A., Fuhr, J.R. and Wiese, W.L. (2002) Experimental Stark widths and shifts for spectral lines of neutral and ionized atoms. Journal of Physical and Chemical Reference Data, 31, 819-927.
- Dimitrijevic, M.S. and Sahal-Brechot, S. (1999) On the stark broadening of neutral zinc spectral lines, Astronomical Observatory, Belgrade, 65, 55-58.
- Konjevic, N., Dimitrijevic, M.S. and Wiese, W.L. (1984) Experimental Stark widths and shifts for spectral lines of neutral atoms: A critical review of selected data for the period 1976 to 1982. Journal of Physical and Chemical Reference Data, 13, 619-647. doi:10.1063/1.555715
- El Sherbini, A.M., Hegazy, H. and El Sherbini, Th.M., (2006) Measurement of electron density utilizing the Hα- line from laser produced plasma in air. Spectrochimica Acta Part B, 61, 532-539. doi:10.1016/j.sab.2006.03.014
- El Sherbini, A.M., Aboulfotouh, A.M., Rashid, F.F., Allam, S.H., El Dakrouri, A. and El Sherbini, Th.M. (2012) Observed enhancement in LIBS signals from nano vs bulk ZnO targets: Comparative study of plasma parameters. World Journal of Nano Science and Engineering, 2, 181-188.
- El Sherbini, A.M., El Sherbini, Th.M., Hegazy, H., Cristoforetti, G., Legnaioli, S., Palleschi, V., Pardini, L., Salvetti, A. and Tognoni, E. (2005) Evaluation of self-absorption coefficients of aluminum emission lines in laserinduced breakdown spectroscopy measurements. Spectrochimica Acta Part B, 60, 1573-1579. doi:10.1016/j.sab.2005.10.011
- El Sherbini, A.M. and Al Aamer, A.A.S. (2012) Development of a simple software program used for evaluation of plasma electron density in LIBS experiments via spectral line shape analysis. Journal of Signal and Information Processing, 3, 502-515. doi:10.4236/jsip.2012.34063