Natural Science
Vol.5 No.3(2013), Article ID:29034,14 pages DOI:10.4236/ns.2013.53051
Modeling the impacts of climate variability and hurricane on carbon sequestration in a coastal forested wetland in South Carolina
![]()
1Earth Science Research Center, EOS, University of New Hampshire, Durham, USA; zdai@fs.fed.us
2Center for Forested Wetland Research, USDA Forest Service, Cordesville, USA
3Eastern Forest Environmental Threat Assessment Center, Southern Research Station, USDA Forest Service, Raleigh, USA
Received 1 December 2012; revised 5 January 2013; accepted 17 January 2013
Keywords: Greenhouse Gas; Forest-DNDC; Biogeochemical Model; Biomass; Climate Change
ABSTRACT
The impacts of hurricane disturbance and climate variability on carbon dynamics in a coastal forested wetland in South Carolina of USA were simulated using the Forest-DNDC model with a spatially explicit approach. The model was validated using the measured biomass before and after Hurricane Hugo and the biomass inventories in 2006 and 2007, showed that the ForestDNDC model was applicable for estimating carbon dynamics with hurricane disturbance. The simulated results indicated that Hurricane Hugo in 1989 substantially influenced carbon storage immediately after the disturbance event. The simulated net ecosystem exchange (NEE) for the 58-year period (1950-2007) indicated that the hurricane reduced CO2 sequestration due primarily to the increased decomposition of a large amount of litter and woody debris, including fallen trees (over 80% of pre-hurricane trees), debris and branches, and dead roots. The inter-annual fluctuation of soil CO2 flux showed that the climate variability interfered substantially soil carbon dynamics in the forest. The results showed that there were substantial spatial and temporal differences in CO2 flux (3.2 - 4.8 Mg∙C∙ha−1) and wood biomass due to the differences in physical and biogeochemical characteristics in the forest.
1. INTRODUCTION
The mean global surface air temperature has increased by 0.8˚C in last hundred years [1,2], and is increasing at a rate of 0.2˚C per decade in recent years [2]. The increase in surface air temperature may be mainly caused by increasing greenhouse gases (GHG) emissions with respect to human activities, such as land use change and fossil fuel consumptions. Forest ecosystems, including wetland ecosystems, are believed to be large carbon sinks [3-6]. Future climate change is likely to influence forest carbon sink strength [4]. Changes in temperature and/or precipitation can influence the forest hydrology regulating C balance in forest ecosystems, especially in forested wetland ecosystems where the hydrology is one of the most important elements impacting on C accumulation and consumption [3,7-9]. Understanding the interactions of wetland hydrology and carbon balances is highly needed to assess the role of forested wetlands in regulating global CO2 that directly contribute to global warming.
Forested wetland ecosystems on Atlantic Coastal Plain in South Carolina, especially those forests in the firstorder headwater watersheds, are characteristic of the hydrology highly regulated by precipitation and evapotranspiration. However, observed climate warming and precipitation variability in the subtropical area have showed their potential in altering watershed hydrology [10,11]. For example, climate change can decrease water table level of the first-order forested wetland watersheds in southeast Atlantic coastal area due to an increase in evapotranspiration caused by temperature rise [12]. Water table decrease can lead to changes in vegetation species which have been observed in South Carolina [13], and the decrease can influence soil C storage in forested wetland ecosystems [3,7]. Pietsch et al. [7] found that water table decrease did not influence C sequestration to timber production in their forested wetlands. However, they found the forest soil C loss to water table decrease. This result indicates that global warming can influence soil C storage in the first-order forested watersheds dominated by a shallow water table, regulated by precipitation and evapotranspiration, on South Carolina coastal plain. Understanding the impact of climate variability on C dynamics in forested wetland ecosystems is needed to estimate the role of the ecosystems in mitigating global warming.
Except for anthropogenic factors affecting forest C balance and storage, many natural disasters, such as strong storms, flooding and wild fire, can substantially disrupt forest C dynamics. Although, it is not clear if global warming has increased the frequency and/or intensity of hurricanes, tropical storms and/or tropical cyclones [14], many scientists argued that global warming could affect those storms, including increasing their frequency and/or rising the energy [15-18] due to sea surface temperature increased by global warming. Those disastrous storms (categorized as 3, 4 and 5) can destroy forest. For example, Hurricane Hugo severely destroyed the forests on the Francis Marion National Forest in South Carolina in 1989 [19], the woody biomass reduced by over 80% [19]. Hurricane Katrina in 2005 destroyed forests along the Gulf coast [20-23], led to wood biomass loss 50 - 370 m3∙ha−1 in swamp forests along the Gulf coast in Louisiana and Mississippi as reported by Middleton [23]. Accordingly, those disastrous storms can substantially influence C storage in forests in a short time period, such as within several years. Generally, only the direct impact of the disastrous storms has been considered as assess their damage. However, to understand a longer term impact of the storms may be valuable for estimating C balance in the forested ecosystems.
Computer models (e.g., MAESTRO [24], Forest-DNDC [25], BIOME-BGC [26], CABALA [27]) are very useful tools to assess C dynamics in forest ecosystems. However, some models, such as CABALA and Forest-DNDC, can perform better than some models [5,28]. ForestDNDC [25,29] is a process-based biogeochemical model used to simulate forest growth, C and N dynamics in forest ecosystems, including trace gas emissions (e.g., CO2, N2O, NO, NH3, and CH4), based on the balance of water, energy and nutrition in forest ecosystems [5,25, 29]. It integrates photosynthesis, decomposition, nitrification-denitrification, carbon storage and consumption, and hydro-thermal balance in forest ecosystems. The model has been tested to simulate C and N dynamics in forest ecosystems across different climatic regions, including boreal, temperate, subtropical and tropical [29- 34]. Recently this model has been modified such that it becomes a spatially explicit modeling tool for estimating C and N dynamics in forest ecosystems; the new version can utilize spatiotemporally physical and biogeochemical characteristics of catchments or regions [35], including soils, vegetation, hydro-geology and climate. The modified model is a flexible tool to assess carbon dynamics on watersheds with complex physical and biogeochemical characteristics. The size and shape of simulating units are flexible, ranging from a single plant-soil profile to watersheds [35]. The detailed modeling algorithm and parameterization can be found in some publications [5,25, 29-34,36-38].
This study used the Forest-DNDC with spatially explicit modeling framework [35] to assess 58-year (1950- 2007) C dynamics in a forested wetland landscape on the Santee Experimental Forest on coastal South Carolina plain by using onsite climatic and hydrologic observations, which was used to estimate the impacts of climatic variability and hurricane disturbance on the C sequestration in the forest. The spatially explicit physically-based hydrologic model MIKE SHE [39] was linked to the Forest-DNDC such that the differences in the spatiotemporally hydrologic and biogeochemical features in the catchment can be considered. The 60-year onsite climate observation showed a substantial climate fluctuation with an increase in air temperature at an average rate of 0.19˚C per decade and without substantially changing precipitation from 1950-2007 in this forest [11]; and a natural disaster, Hurricane Hugo categorized as IV storm, severely destroyed the forest of the watershed in 1989 [19,40]. These conditions were good for testing whether or not the model can capture the impacts of climate variability and hurricanes on C sequestration to this forest. The simulated results were compared to observations, which can be used to project the impact of future climate change on C storage in this type of forested watersheds.
2. MATERIALS AND METHODS
2.1. Study Watershed
Watershed WS80, located at 33.15˚N, 79.8˚W on the Santee Experimental Forest (SEF), 55 km northwest of Charleston, South Carolina, was used for this study (Figure 1). WS80 is first-order forested watershed with a mosaic landscape consisting of uplands and wetlands. Historically this forest was a part of agricultural wetlands (rice paddies) along Cooper River [41]. However, it was converted to a forested wetland in 19th century. The earlier trees were clearly cut in earlier 20th century [42]. The land was acquired by U.S. government in 1930’s and used as forests. In 1938, SEF was established for the studies on forest and water. Thereby, it has gauging records since 1967.
WS80 serves as the control watershed for a paired watershed system within the second-order watershed (WS79; Figure 1) draining into Huger Creek, a tributary of East Branch of the Cooper River. The climate of this area is characteristic of the subtropical region of the Atlantic Coast with short, warm and humid winters and long and hot summers; the annual average temperature is 18.5˚C, and the mean annual precipitation (1946-2008) is 1370 mm [11]. The topography is planar, and the slope is

Figure 1. Location of the study watershed (WS80) on the Santee Experimental Forest, South Carolina, USA. The location of the groundwater wells is indicated on the topographic map figure as W1 through W10. WS79 is a paired watershed system; WS80 serves as a control catchment, WS77 as a treatment catchment, WS79b as a mixed watershed with treatment and control.
less than 4%. The elevation is between 4 - 10 m above mean sea level. The watershed has a shallow water table, and over 23% of the watershed is classified as wetlands [43].
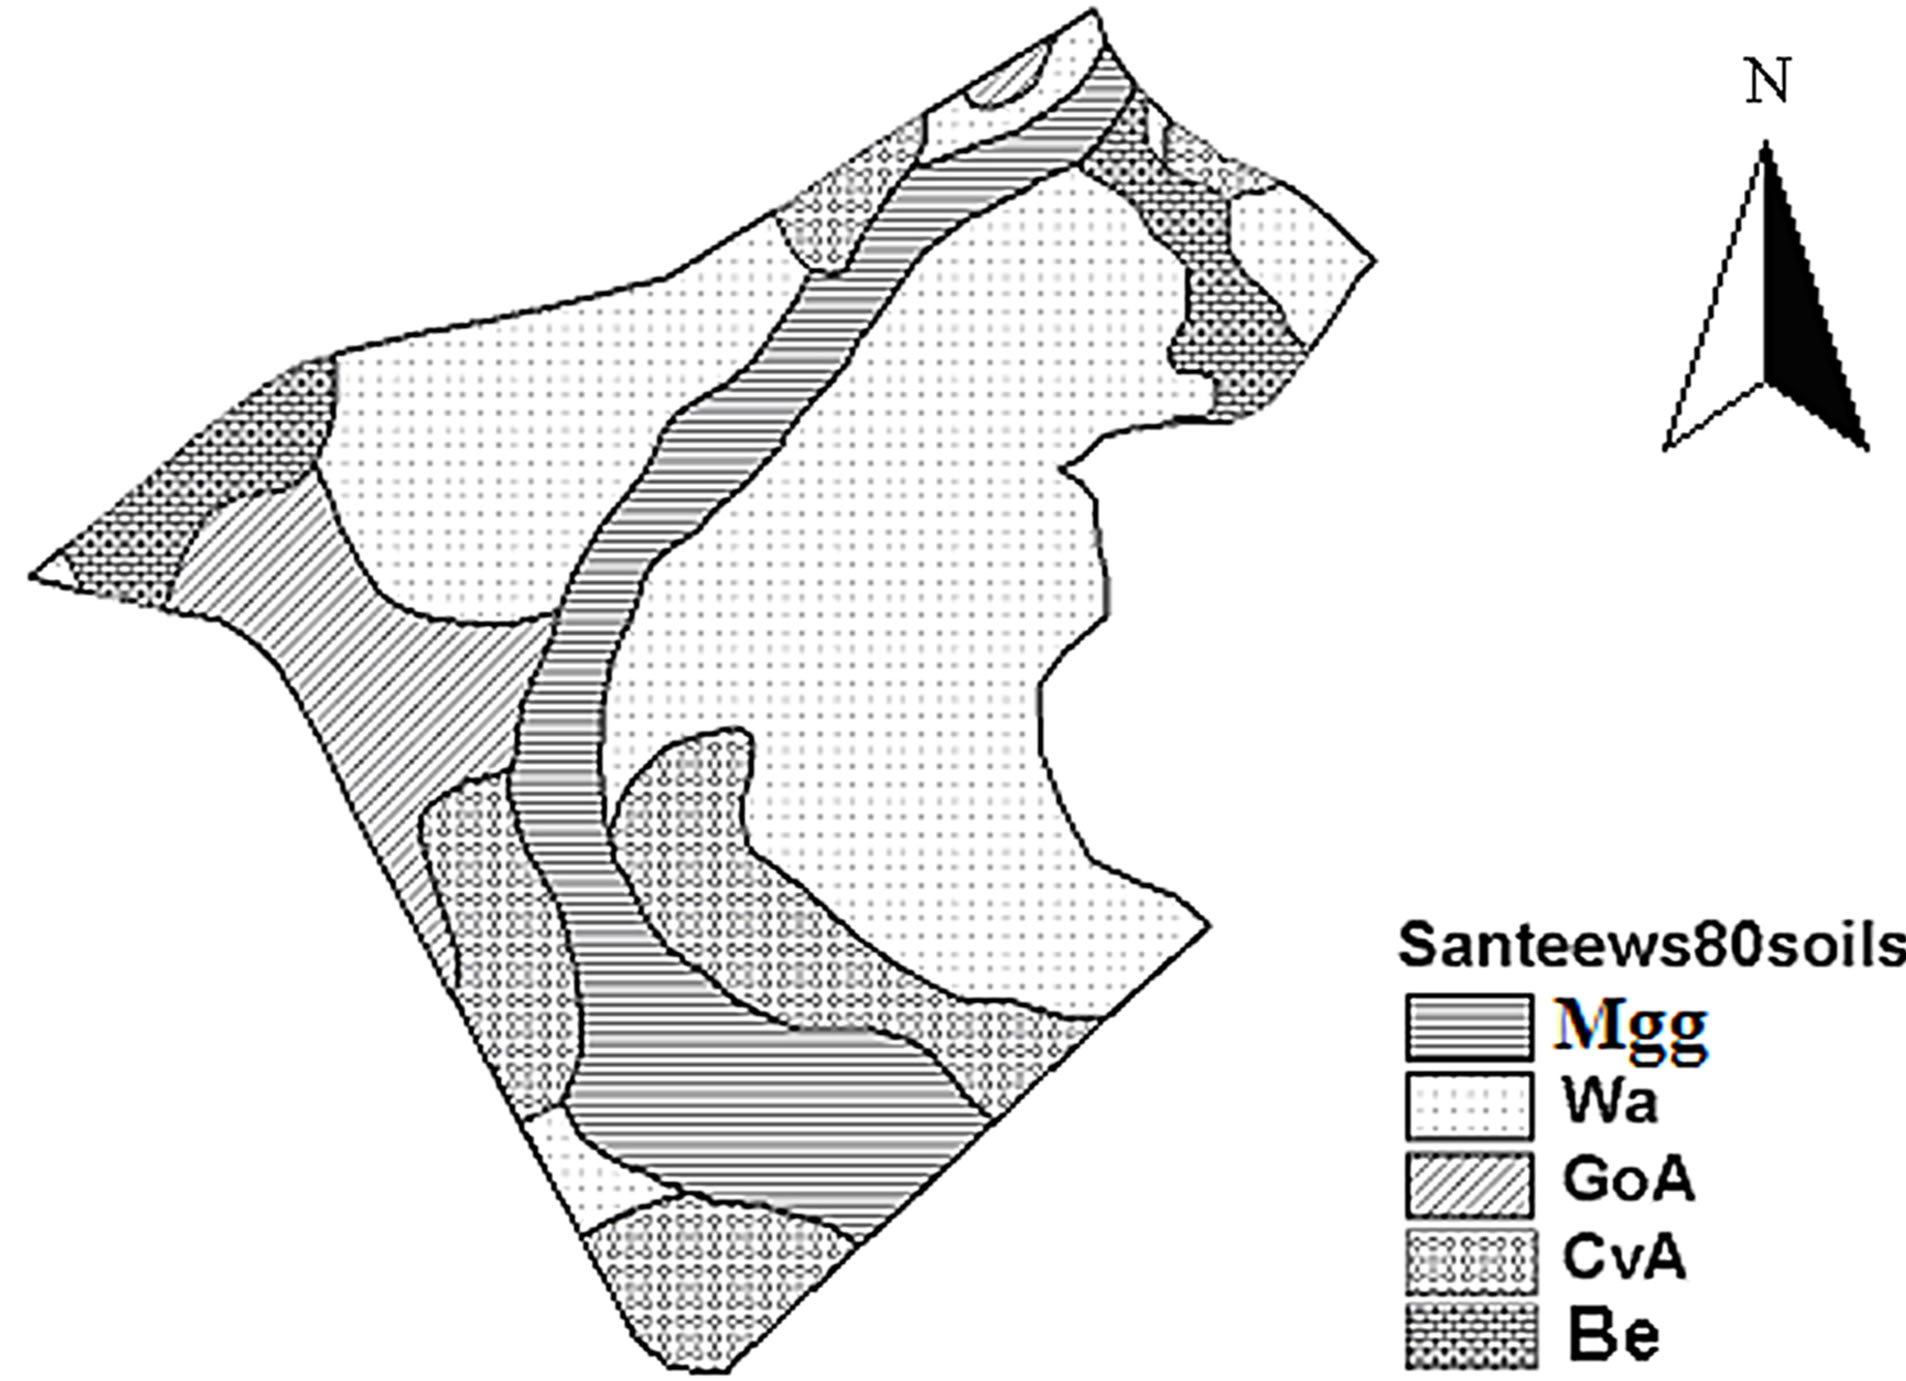
The soils developed in coastal plain sediments are hydric [44,45], and typified by a loam surface and clayey subsoil, which is moderately well to somewhat poorly drained in the upland and poorly drained in the riparian zone [46] (Figure 2(a)). Clay content is ≤30% in topsoil (within 30 cm), 40% - 60% in subsoil (>30 cm) [46]. Soil reaction is acidic; pH is between 4.5 and 6.5. Soil organic carbon content (SOC) is between 0.1% and 2.5% from uplands to riparian zone [47,48]. Organic matter (litter and duff, exclusive coarse woody debris) on the forest floor is 0.6 - 2.2 kg∙m−2 (unpublished data).
As a reference forested watershed in the paired watershed system, WS80 has not been managed more than five decades. However, Hurricane Hugo categorized as IV storm passed through the Francis Marion National Forest in September of 1989, over 80% of dominant trees in this catchment were, therefore, broken or uprooted [19,49, 50]. After the hurricane, the watershed remained unmanaged, without biomass removal or salvage logging. The current forest cover is from residuals and natural regeneration, which consists of bottomland hardwoods in the riparian zone and mixed pine-hardwoods elsewhere (Figure 2(b)) [40]. The dominant trees are loblolly (Pinus taeda L.), sweetgum (Liquidambar styraciflua) and a variety of oak species (Queercus spp.) [19,40].
2.2. Data and Field Measurements
There are four weather stations on SEF. Daily precipitation and daily minimum and maximum temperature were measured manually at the weather station at the Santee Experimental Forest Headquarters (SHQ) between 1946 and 1996 and automatically afterwards; relative humidity, evaporation, wind speed, wind direction, vapor pressure, solar and net radiation were measured at
 (a)
(a)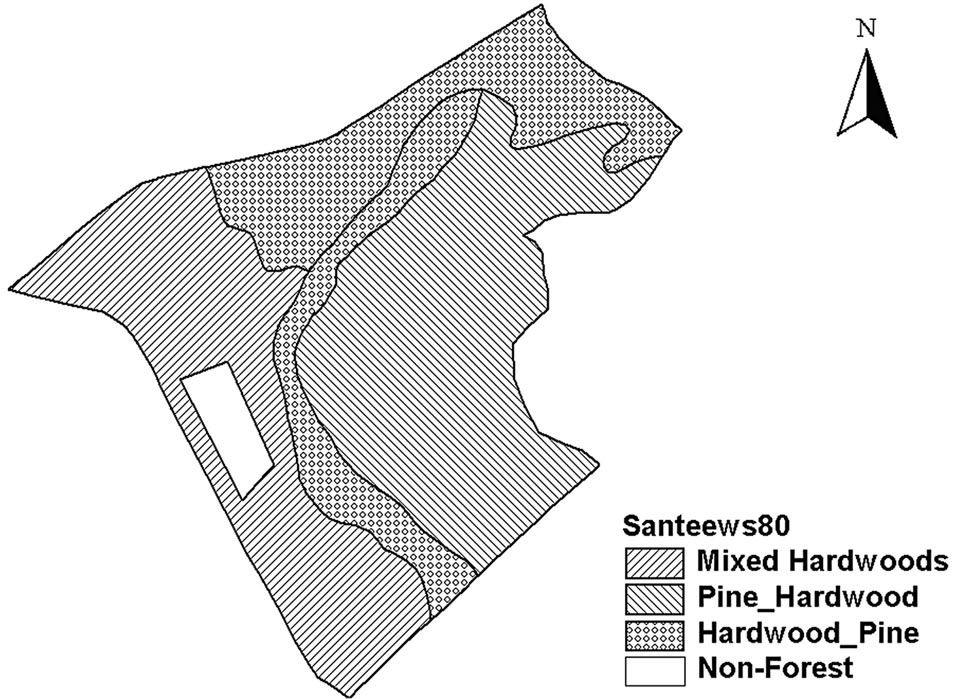 (b)
(b)
Figure 2. (a) Distribution of soil types in WS80. Mgg is Meggett, loam; Wa is Wahee, loam; GoA is Goldsboro, sandy loam; CvA is Craven, loam; Be is Bethera, loam; (b) Vegetation types on WS80.
30-minute intervals since 2003. The other three onsite weather stations (Met 5 on WS77, Lotti adjacent to WS79b and Met25 on WS80) started to manually record daily precipitation and temperature from 1963, 1964 and 1990, respectively, and automatically collect data at hourly intervals since 2003. Although the climate data from these stations were comparable, there were some differences in summer precipitation among the stations, especially storms.
However, some of precipitation and temperature data were missing at different stations and/or in different time periods before 2003 due to equipment failure for some time and natural disasters such as Hurricane Hugo in 1989. The missing temperature data were at first established by using the regression equations developed from the measurements of daily maximum and minimum temperature between 1972 and 2001 at SHQ and Lotti (about 3 km away from SHQ); and then the remaining missing temperature for SHQ were established by using the regression equations developed from the measurements between 1950 and 2008 at SHQ and Charleston International Airport (CHS) located about 50 km away from the SHQ, and the measurements between 1994 and 2008 at the SHQ and Moncks Corner (MC), about 20 km away. The missing precipitation data for simulating hydrology and C dynamics were filled by the measurements from the nearest weather stations in terms of comparing those precipitation measurements from 15 weather stations around SHQ, based on the assumption that there was no precipitation at SHQ if precipitation was found only at one side of SHQ and/or without an increase in observed steam flow, otherwise the precipitation at SHQ was the same as the precipitation at the nearest weather station or the average from the weather stations at both sides of SHQ.
Stream flow gauge heights above a compound V-notch weir were measured at 10-minute intervals in 1969-2007. The stream flow was calculated using standard rating curve method developed for the weir [51], and the 10- minute values were integrated into daily, monthly and annual flow in cubic meters per second (cms), and then normalized from cms to millimeters (mm) per day by dividing the watershed area to compare with daily precipitation [52]. However, a lot of flow data were missing due to equipment failures, which remained missing. Daily distributed water table depth was measured to calibrate and validate the distributed hydrologic model MIKE SHE [39] providing distributed water table depth for simulating C dynamics using Forest-DNDC. Thirty three manual wells were installed across the watershed with weekly measurements in 1992-1994; eight manual wells were selected from the 33 wells with biweekly measurements in 2003-2005. Two automatic wells were installed in an upland area and a lowland location to record water table depth at four-hour intervals since 2003.
Twenty four plots were set to measure tree height (TH, m) and diameter at breast height (DBH, cm) for a biomass inventory in the paired watershed in 2006 (unpublished data), in which four plots were used to measure TH and DBH in 2007. Eight plots were used to measure soil temperature, moisture, and soil CO2 in 2006-2008. The plot size was about 1022 m2 (fourth acre, 105 feet by 105 feet for the plots 1 - 16; 50 feet by 220 feet for the plots 17 - 24). Soil temperature, moisture, and soil CO2 were measured at 4 - 6 collars in each plot. Soil temperature and moisture were measured by using probes inserted into soils 10 cm deep. Soil CO2 was measured at monthly intervals using LI-COR 6200 portable photosynthesis system included a LI-6250 infrared gas analyzer. The PVC soil collars were installed permanently 3 cm into the mineral soils [53]. The measured values from the collars for each parameter in a plot were integrated into plot average.
The trees <10 and ≥10 cm in DBH and shrub were measured, respectively, in 2006 and 2007. Four sub-plots (9 m2 each) were installed in each plot to measure the aboveground biomass for those trees <10 cm in DBH; the trees were harvested, dried and weighted. Shrub was collected in the four sub-plots for every plot, and then dried and weighted. The volume for those trees ≥10 cm in DBH was calculated using the equation developed by Saucier and Clark III [54] for tree species in Southern U.S. based on the DBH and height. The aboveground biomass was estimated by using the equation developed by Smith et al. [55] on the basis of vegetation types in Southeastern U.S. The total wood biomass of a plot was the sum of the biomass of all trees in the plot, and then normalized to unit weight, Mg∙C∙ha−1, by dividing the plot area (1022 m2). There were four sub-plots in each plot for collecting litter and duff. The area of the basket for litter collection was 1470 cm2, and the area for collecting duff was 729 cm2. The litter and duff were dried under 60˚C, and weighted.
The impact of Hurricane Hugo on the biomass C storage in the stands in the entire Santee Experimental Forest was estimated by Hook et al. [42]; the aboveground biomass was about 78.0 Mg∙C∙ha−1 before the hurricane, and 13.9 Mg∙C∙ha−1 after the hurricane; the mean aboveground wood biomass loss was about 64.1 Mg∙C∙ha−1 in the entire forest. In this study catchment, all the aboveground biomass C loss to the hurricane remained on forest floor due to without biomass removal and salvage logging; the dead roots produced by the hurricane was about 19.2 Mg∙C∙ha−1, estimated using the coefficient of roots to aboveground biomass [56,57], in which most were in the soils, a few were on the ground due to some trees uprooted by the hurricane.
2.3. Model Validation
Both Forest-DNDC and MIKE SHE were validated. MIKE SHE was validated using six years of daily stream flow and spatial water table for assessing the impact of climate variability on hydrology in this watershed [11, 58]. It was validated against stream flow and water table observed in 2003-2007 for this study. The Forest-DNDC was validated using the biomass inventory for a biomass study in 2006 and measurement in 2007 for this study; it was also validated against the soil CO2, soil temperature and moisture measured in 2006-2008.
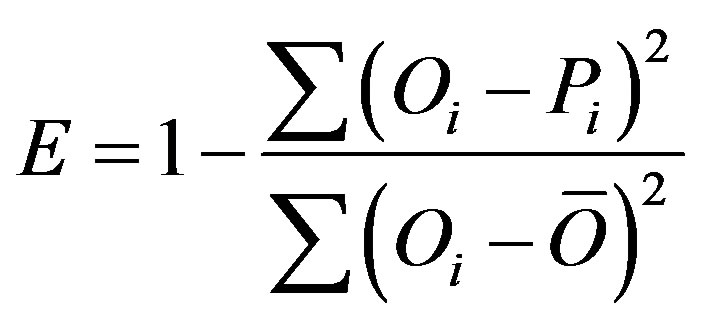
The model performance was evaluated employing widely used quantitative methods, coefficient of determination (R2 ≤ 1) (squared correlation coefficient) and model efficiency (−∞ < E ≤ 1) [5,35,59]. The model performance efficiency is calculated as
 (1)
(1)
where ,
,  and Pi are the observed values, mean observation and simulated values, respectively.
2.4. Model Setup and Parameterization
In order to obtain a better understanding the C dynamics in forested wetland ecosystems, Forest-DNDC was configured to simulate C dynamics for forested wetland ecosystems [31] with a spatially explicit modeling approach to utilize spatiotemporal physical and biogeochemical characteristics of the watershed, including vegetation, hydrology, soil, and managements across the forest [35]. Therefore, the catchment (160 ha) was divided into 675 simulating cells with a size of 50 m × 50 m to simulate carbon dynamics using the spatially explicit modeling approach. The main parameters for modeling C dynamics in this catchment were presented in Table 1.
The simulation started from 1950 with the assumption that the mean tree age of the dominant trees at that time (1950) was 17 years old due to clear cutting in 1930’s [41,42,60] (also see the assumption 1 below). GIS-based data files for model inputs were created using ArcGIS 9.2 [61] and Microsoft Excel 2003 for the spatial variation in hydrology, soil and vegetation. The spatial hydrologic data were supplied by MIKE SHE [39] calibrated and validated using spatial (water table) and temporal (water table and flow) observations [58,62]. The soil organic carbon (SOC), pH, clay, and hydraulic properties were obtained from soil survey and field samples for previous studies [40,46]. The details of some soil parameters can be found in the publication for simulating hydrology in this watershed [58]. The vegetation species and distribution were obtained from the assessment of Hurricane Hugo damage [19,42] and biomass inventories in 2006 and 2007 (unpublished data). For this study, every file was a dataset with 675 elements (cells), and each represented 0.25 ha (50 m × 50 m) of the watershed.
All assumptions for this study were that 1) the vegetation in this watershed before the hurricane naturally regenerated in 1930’s when the government obtained the land used as forestland due to clear cutting before the land acquired by the government [41,42,60]; 2) only 15% of pre-hurricane trees remained for all simulating units based on the assessment of the impact of the Hurricane Hugo on the forest in Francis Marion National Forest [19] and the current forest cover is from residuals and natural regeneration; 3) vegetation type before the hurricane was similar to the current type on the basis of the study of South Carolina forest land research and management related to the storm conducted by Hook et al. [42], Nix et al. [49] and Wilson et al. [50].
3. RESULTS AND DISCUSSION
Sharing a same set of input databases, MIKE SHE and
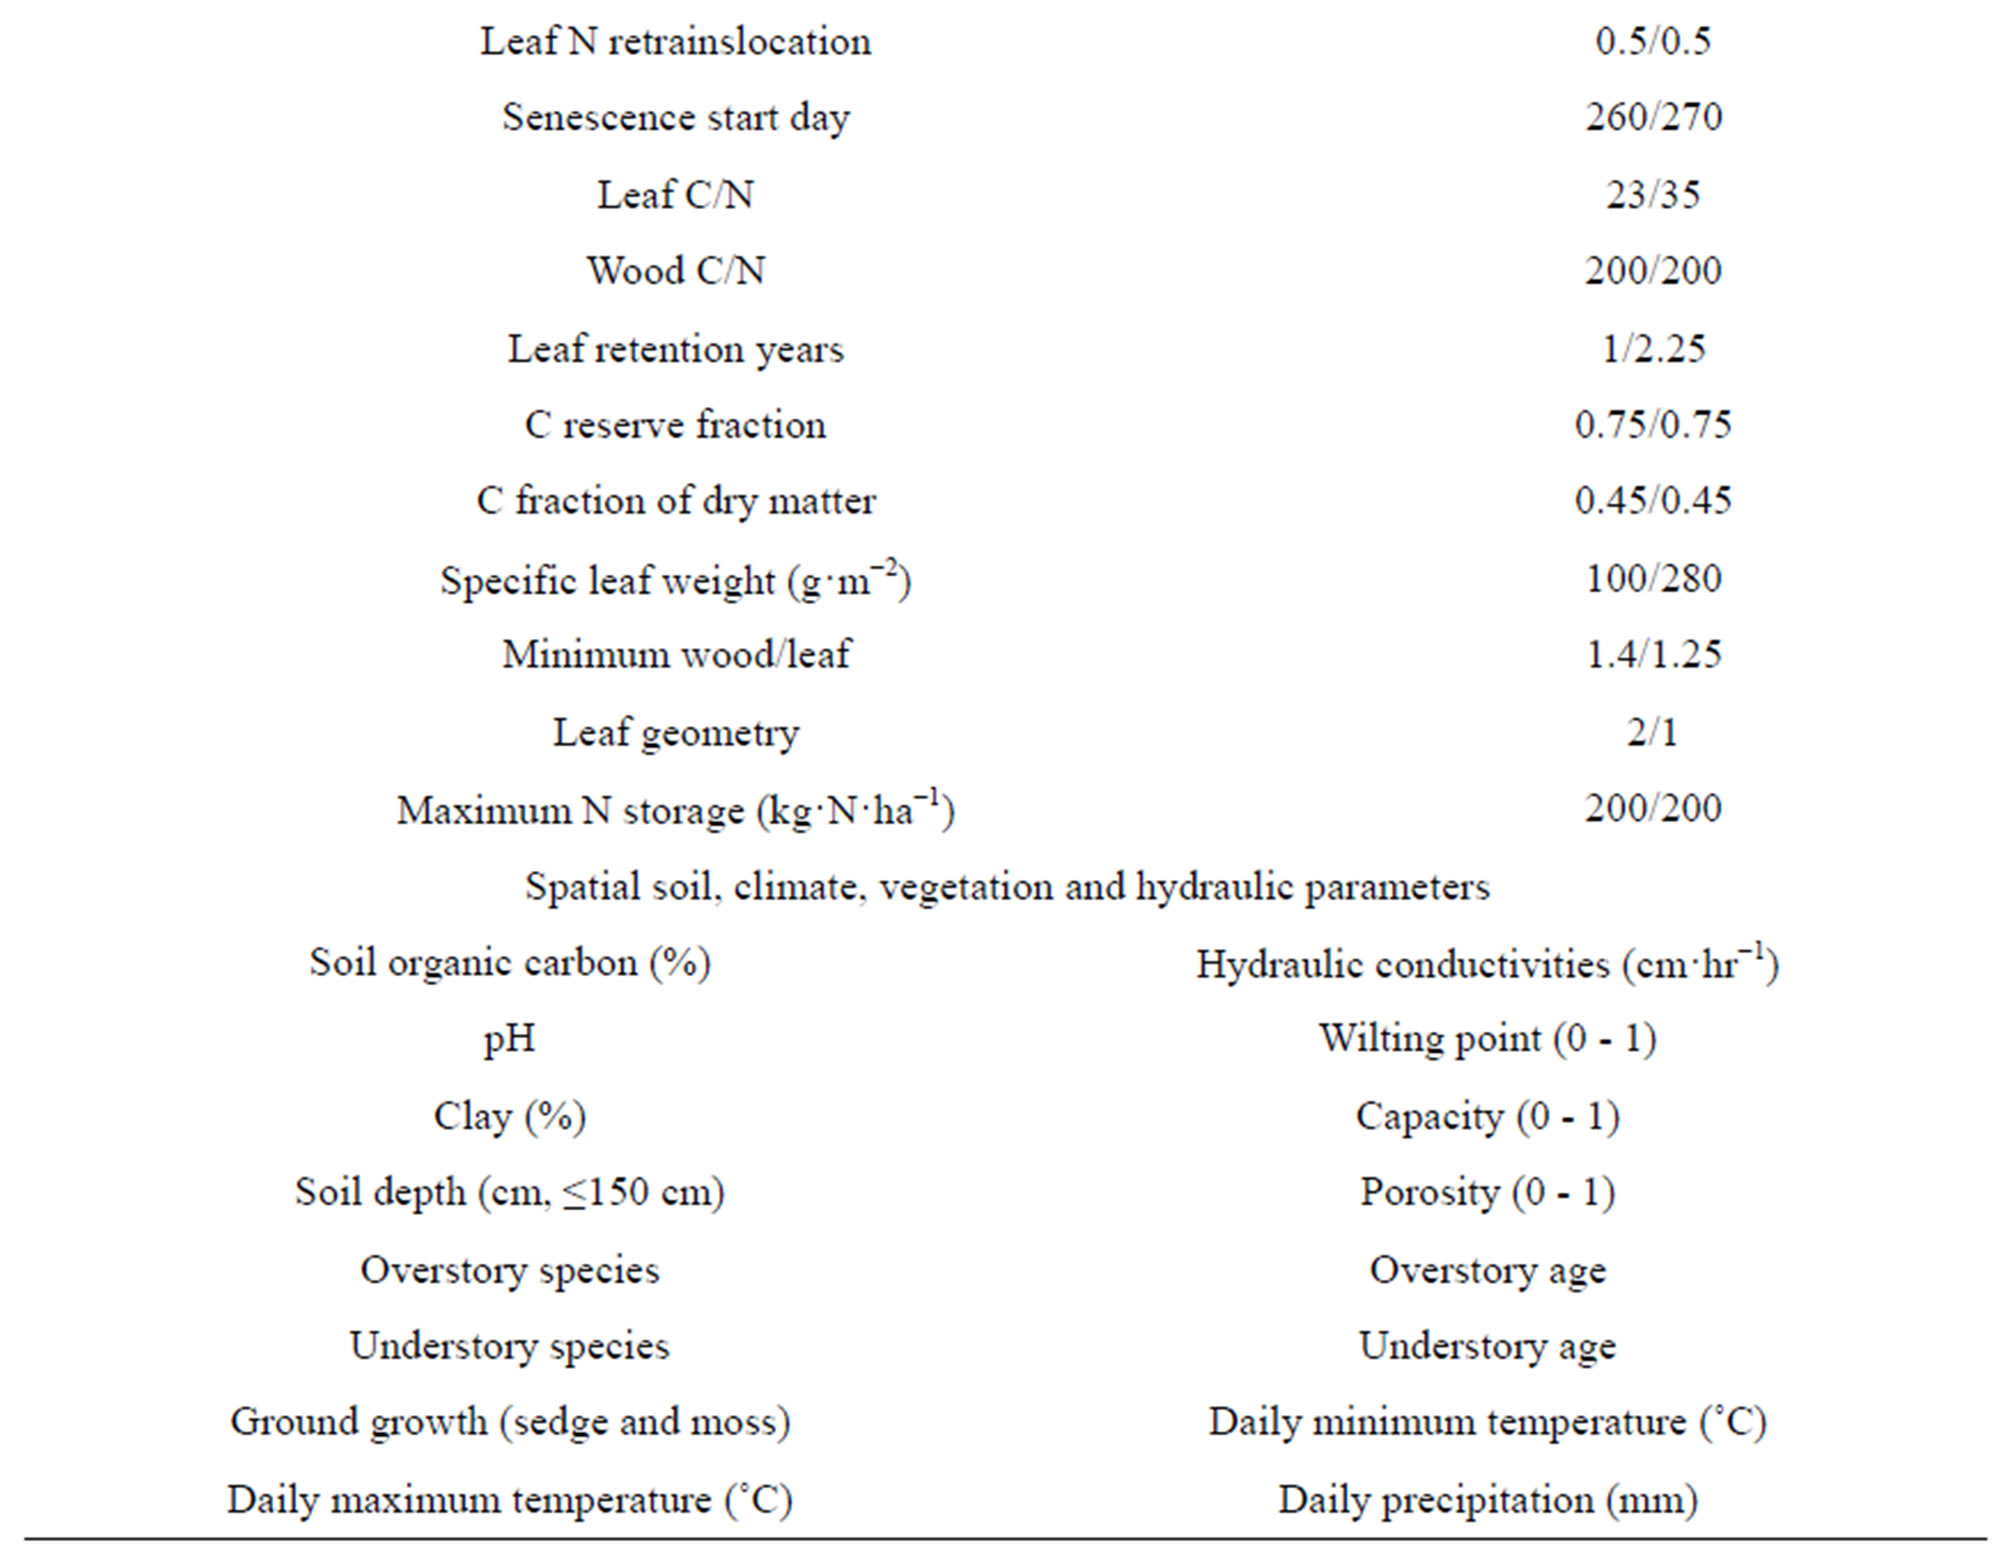
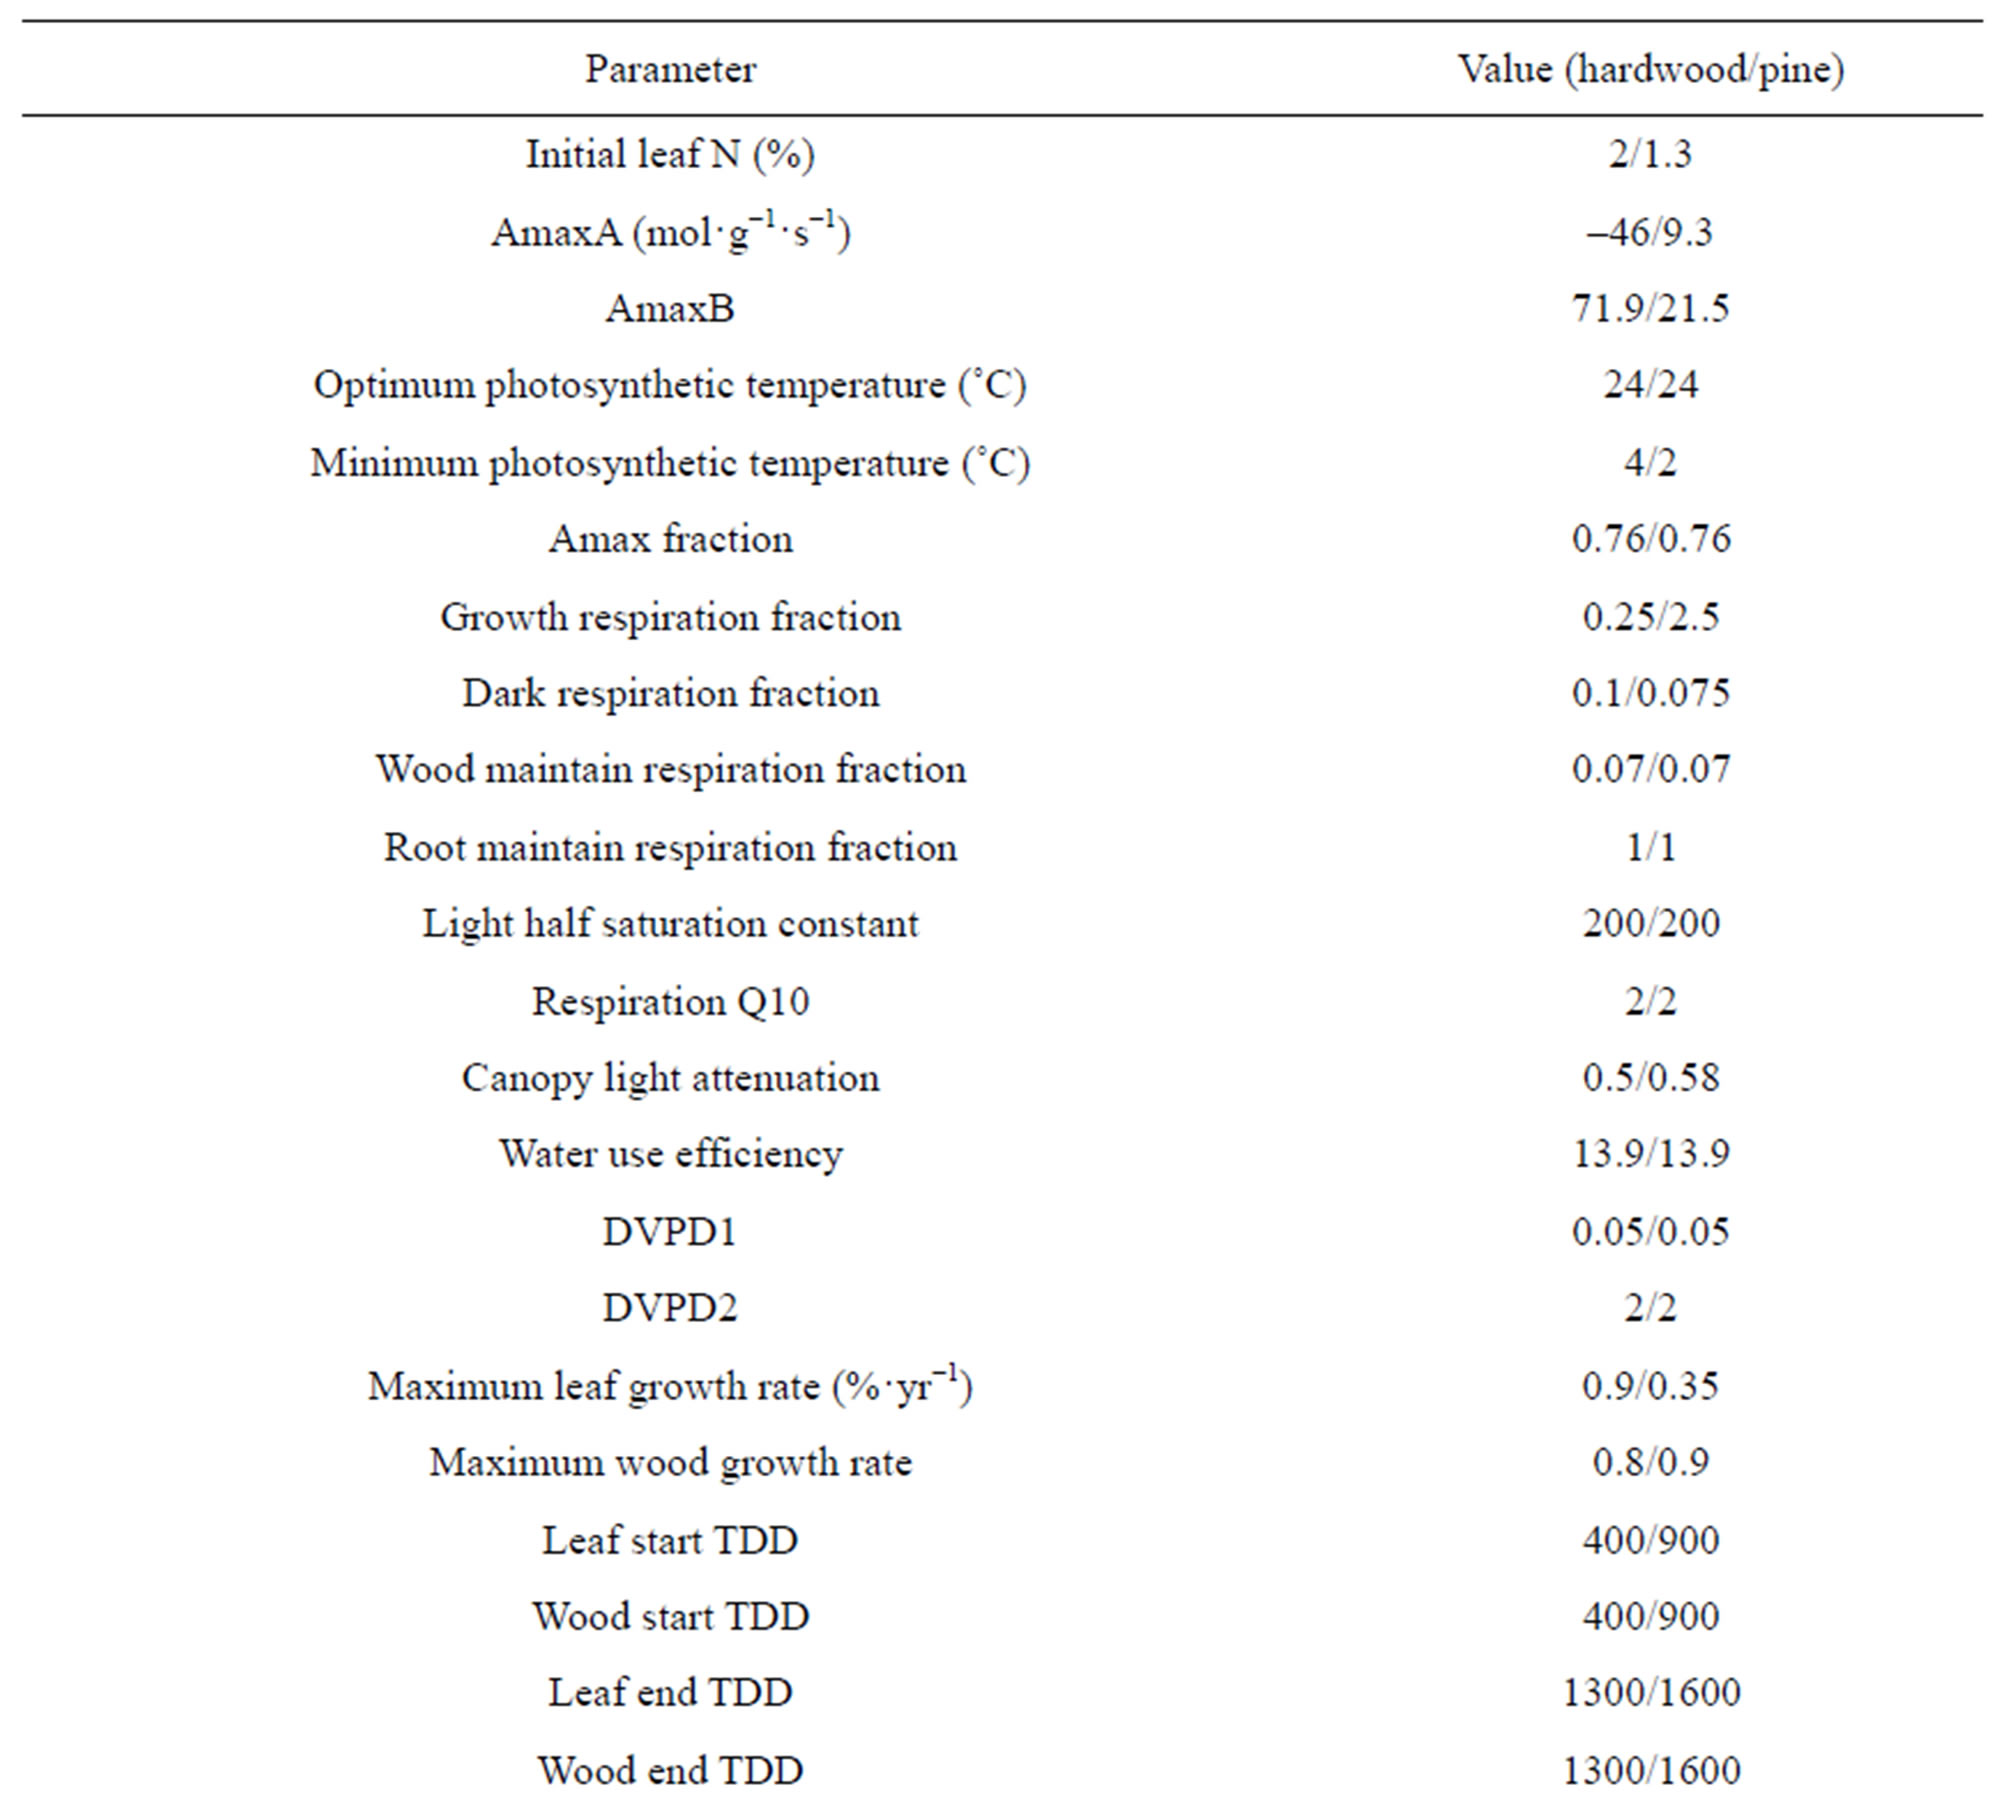
Table 1. Key vegetation and soil parameters for Forest-DNDC.
Forest-DNDC worked in conjunction that passed the MIKE SHE simulated water table data to Forest-DNDC on daily basis. The modeled results are reported as follows.
3.1. Model Validation
MIKE SHE [39] was calibrated and validated using daily flow measurements during the period from 1969- 1971 (before Hurricane Hugo) [11] and another period from 2003-2007 (after the hurricane), and monthly flow in the period from 1969-2007 (only 238 months due to data missing) [11]. The simulated stream flow was in agreement with the observations with model performance efficiency (−∞ < E ≤ 1) [59] from 0.66 - 0.72 for daily flow, 0.92 - 0.94 for monthly flow in the two periods, 0.88 for monthly flow in the period from 1969-2007 (Table 2). The E was within the range of very good model performance rating [63].
The spatial water table dynamics are important to simulate C dynamics at watershed scale. Daily water table depth was used to calibrate and validate MIKE SHE model. The simulated daily water table depth for the 33 manual wells from 1992-1994 [11], and for two automatic wells and 8 manual wells in 2003-2007 was in good agreement with the observations, with E of 0.81 and 0.79 and the small difference in mean water table depth, less than 10 cm (between −3.5 and 3.9 cm) [11], between the observation and simulation for the two validation periods. These quantitative assessments show that MIKE SHE is applicable to provide proper water table dynamics for this C simulation using spatially explicit modeling approach.
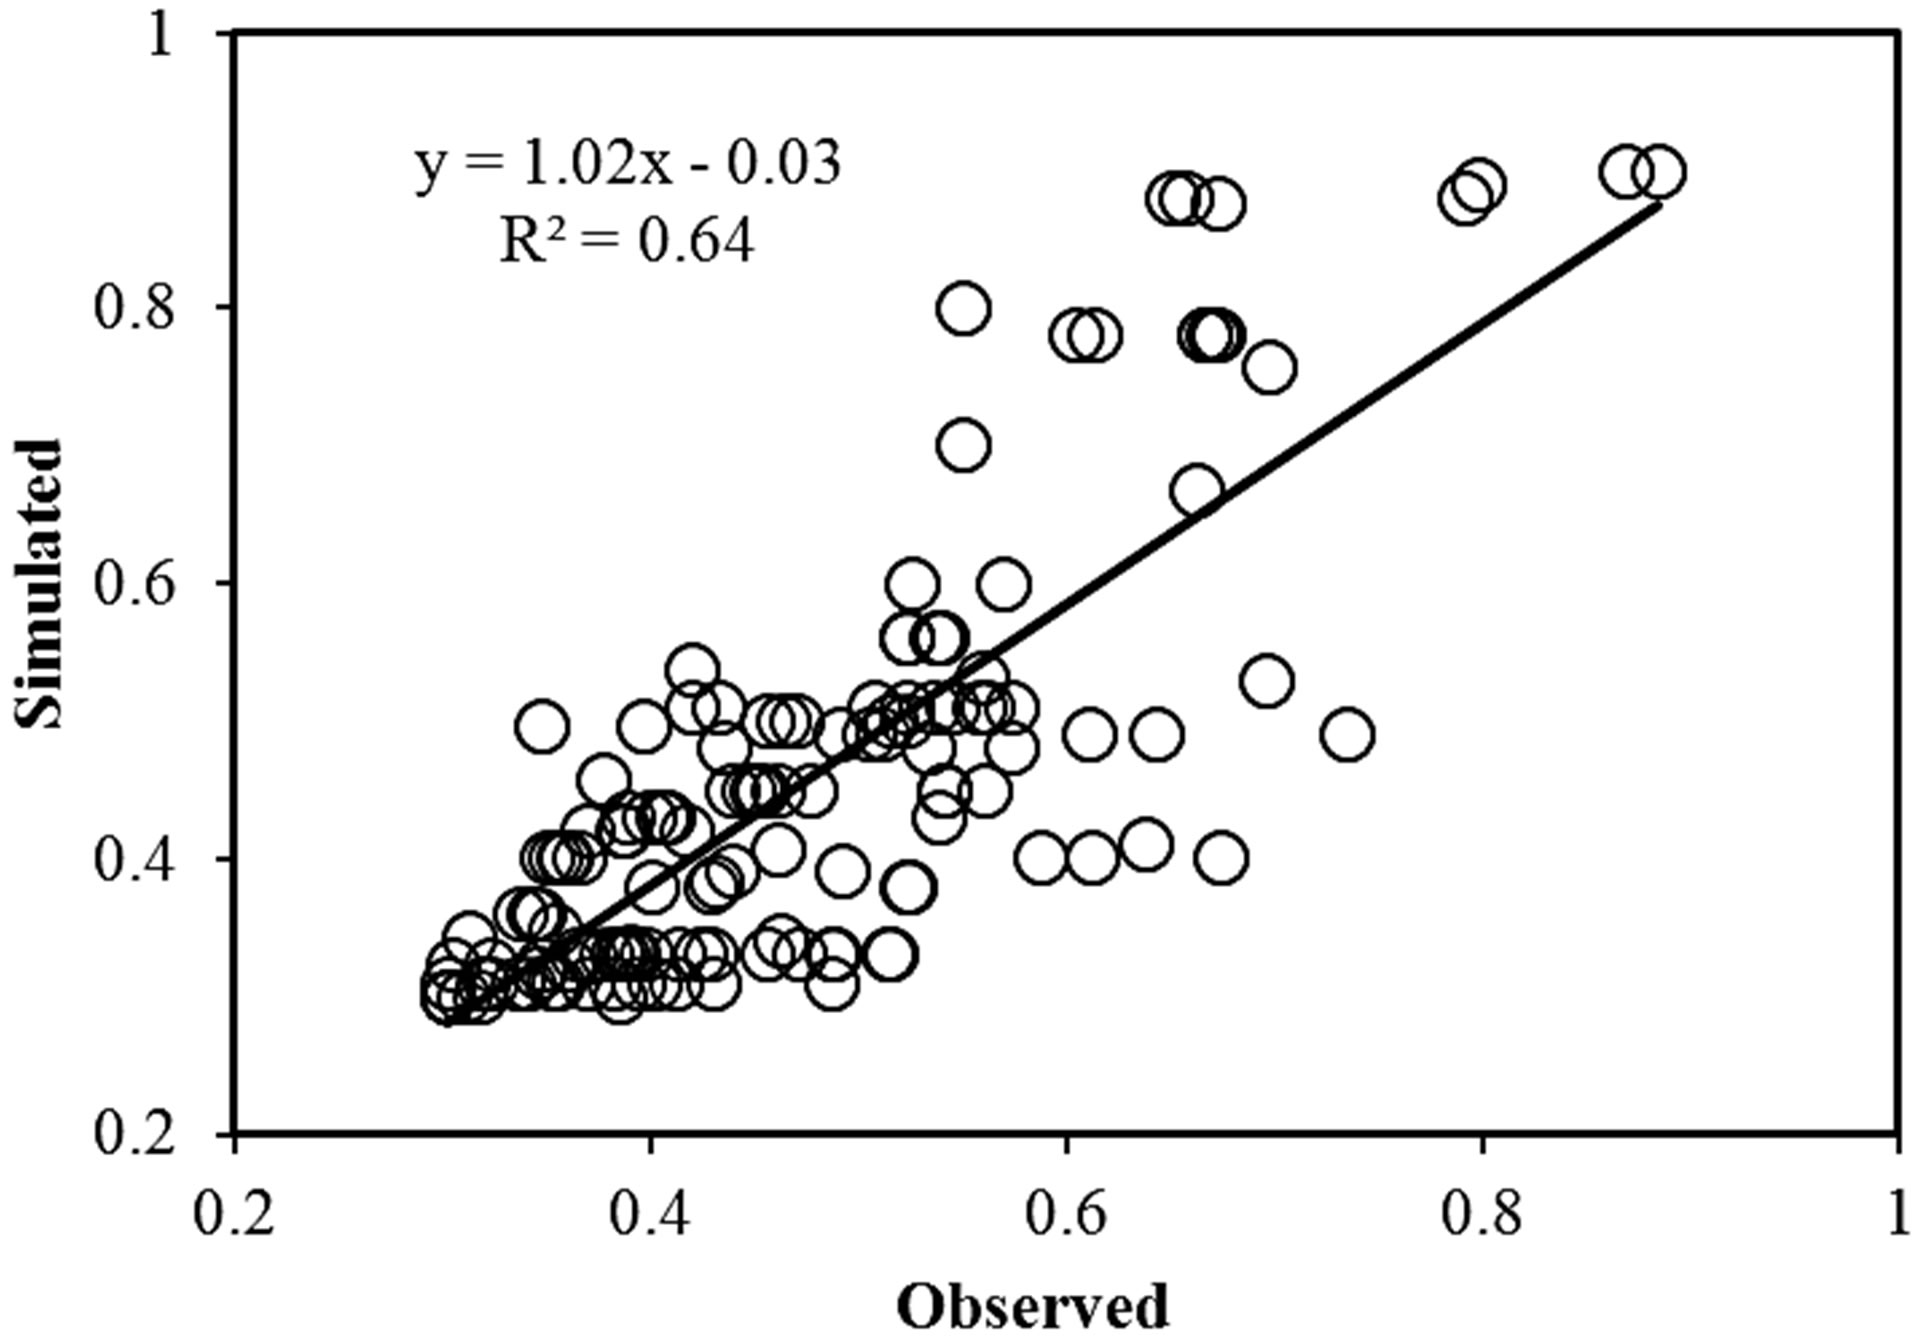
The results from Forest-DNDC validation using soil CO2, soil temperature and soil moisture, and biomass were presented in Figure 3 and Table 3. Although the simulated average soil moisture was approximately to observed and the slope of regression model between the observations and simulations was close to 1 (b = 1.02), the model efficiency (Table 3) from the validation showed that the simulated soil moisture was in general agreement with the field measurements (E = 0.4 and R2 = 0.64, n = 216) (Figure 3(a)). However, there was good agreement between the observations and simulations for soil temperature (E = 0.7 and R2 = 0.78, n = 216; Figure 3(b)), soil CO2 (E = 0.67 and R2 = 0.67, n = 200; Figure 3(c)) and aboveground biomass (E = 0.82, R2 = 0.85, n = 24, for plots p1 - p24 in 2006; and E = 0.86, R2 = 0.99, n = 8, for plots p21 - p24 in 2006 and 2007; Figure 3(d)).
There were small differences between the field measurements and simulations for soil moisture. The simulated soil moisture trended to be slightly higher than the field measurements during wet periods and slightly lower during dry periods. These differences may be related to the location and distribution of the measurement plots, which include both upland and wetland. The field measurements may also be influenced by the micro-topography within a measurement plot; whereby the 4 - 6 measurement points chosen for a plot were inadequate to provide a representative mean for the plot (0.25 ha). The distribution of measurement points tended to be on the slightly higher (i.e. 10 - 20 cm) micro-topographic positions, which would not be submerged during periods of high-water table, although those events are not uncommon. Since the simulated results represent an average across the plot, it is reasonable that the simulated soil moisture could be higher than the measured values for wet periods, especially in the riparian zone.
The Figure 3(d) showed that the Forest-DNDC slightly over predicted the biomass C accumulated in wood product for plots 5, 13, 14, 19 - 23, and under predicted for the plots 1, 3, 4, 8, 12, 17 and 18. There are many factors that can produce these errors, including vegetation distribution, differences in plot sizes between inventory (fourth acre, about 0.1 ha) and simulation (fourth hectare), and errors from measurements of tree height (m) and diameter at breast height (DBH) (cm). An important error with respect to the over or under estimations of the wood mass can be resulted from estimating
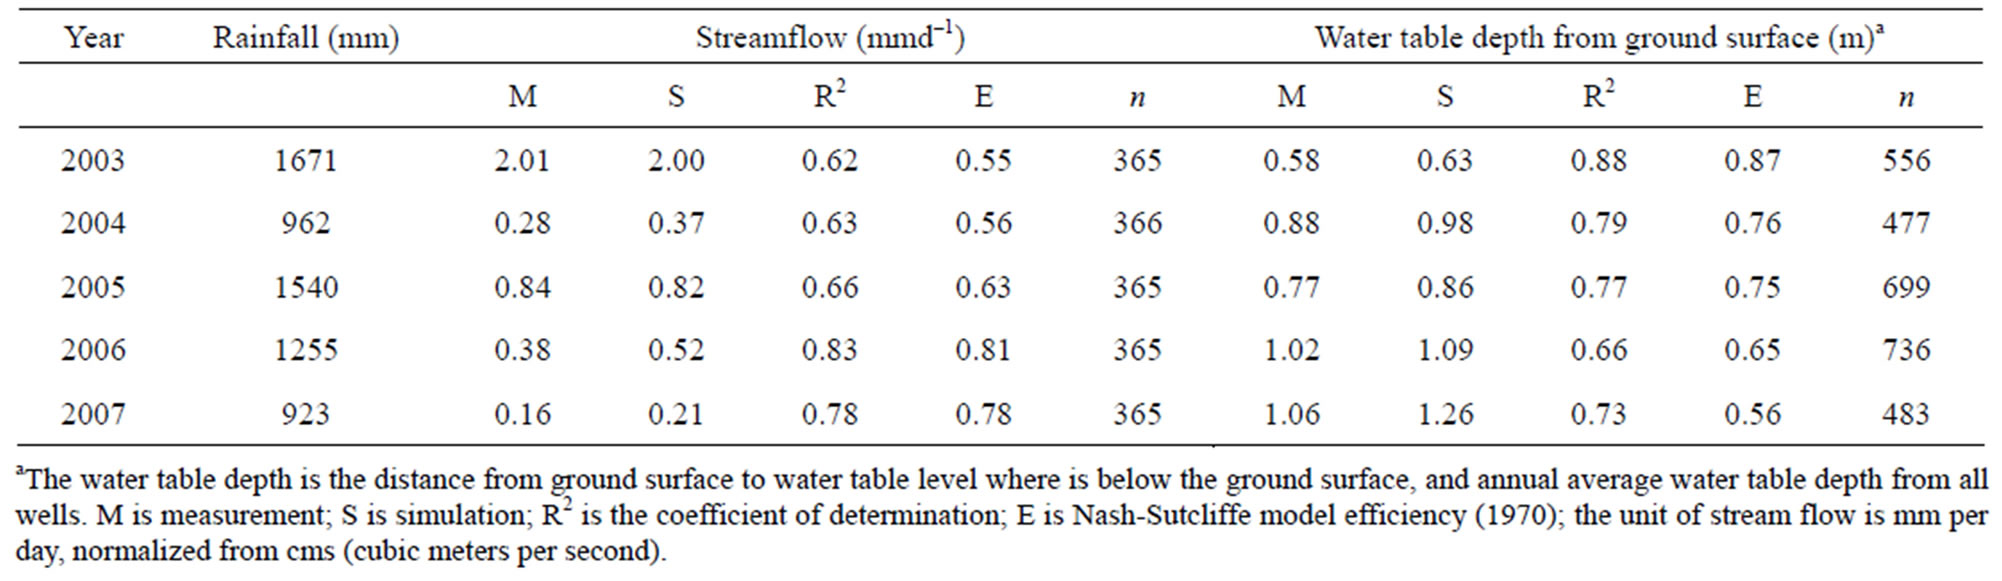
Table 2. The simulated (S) and measured (M) mean water table and mean stream flow in watershed WS80 and rainfall in the 5-year period, and model efficiency (E), and number of samples (n).
 (a)
(a)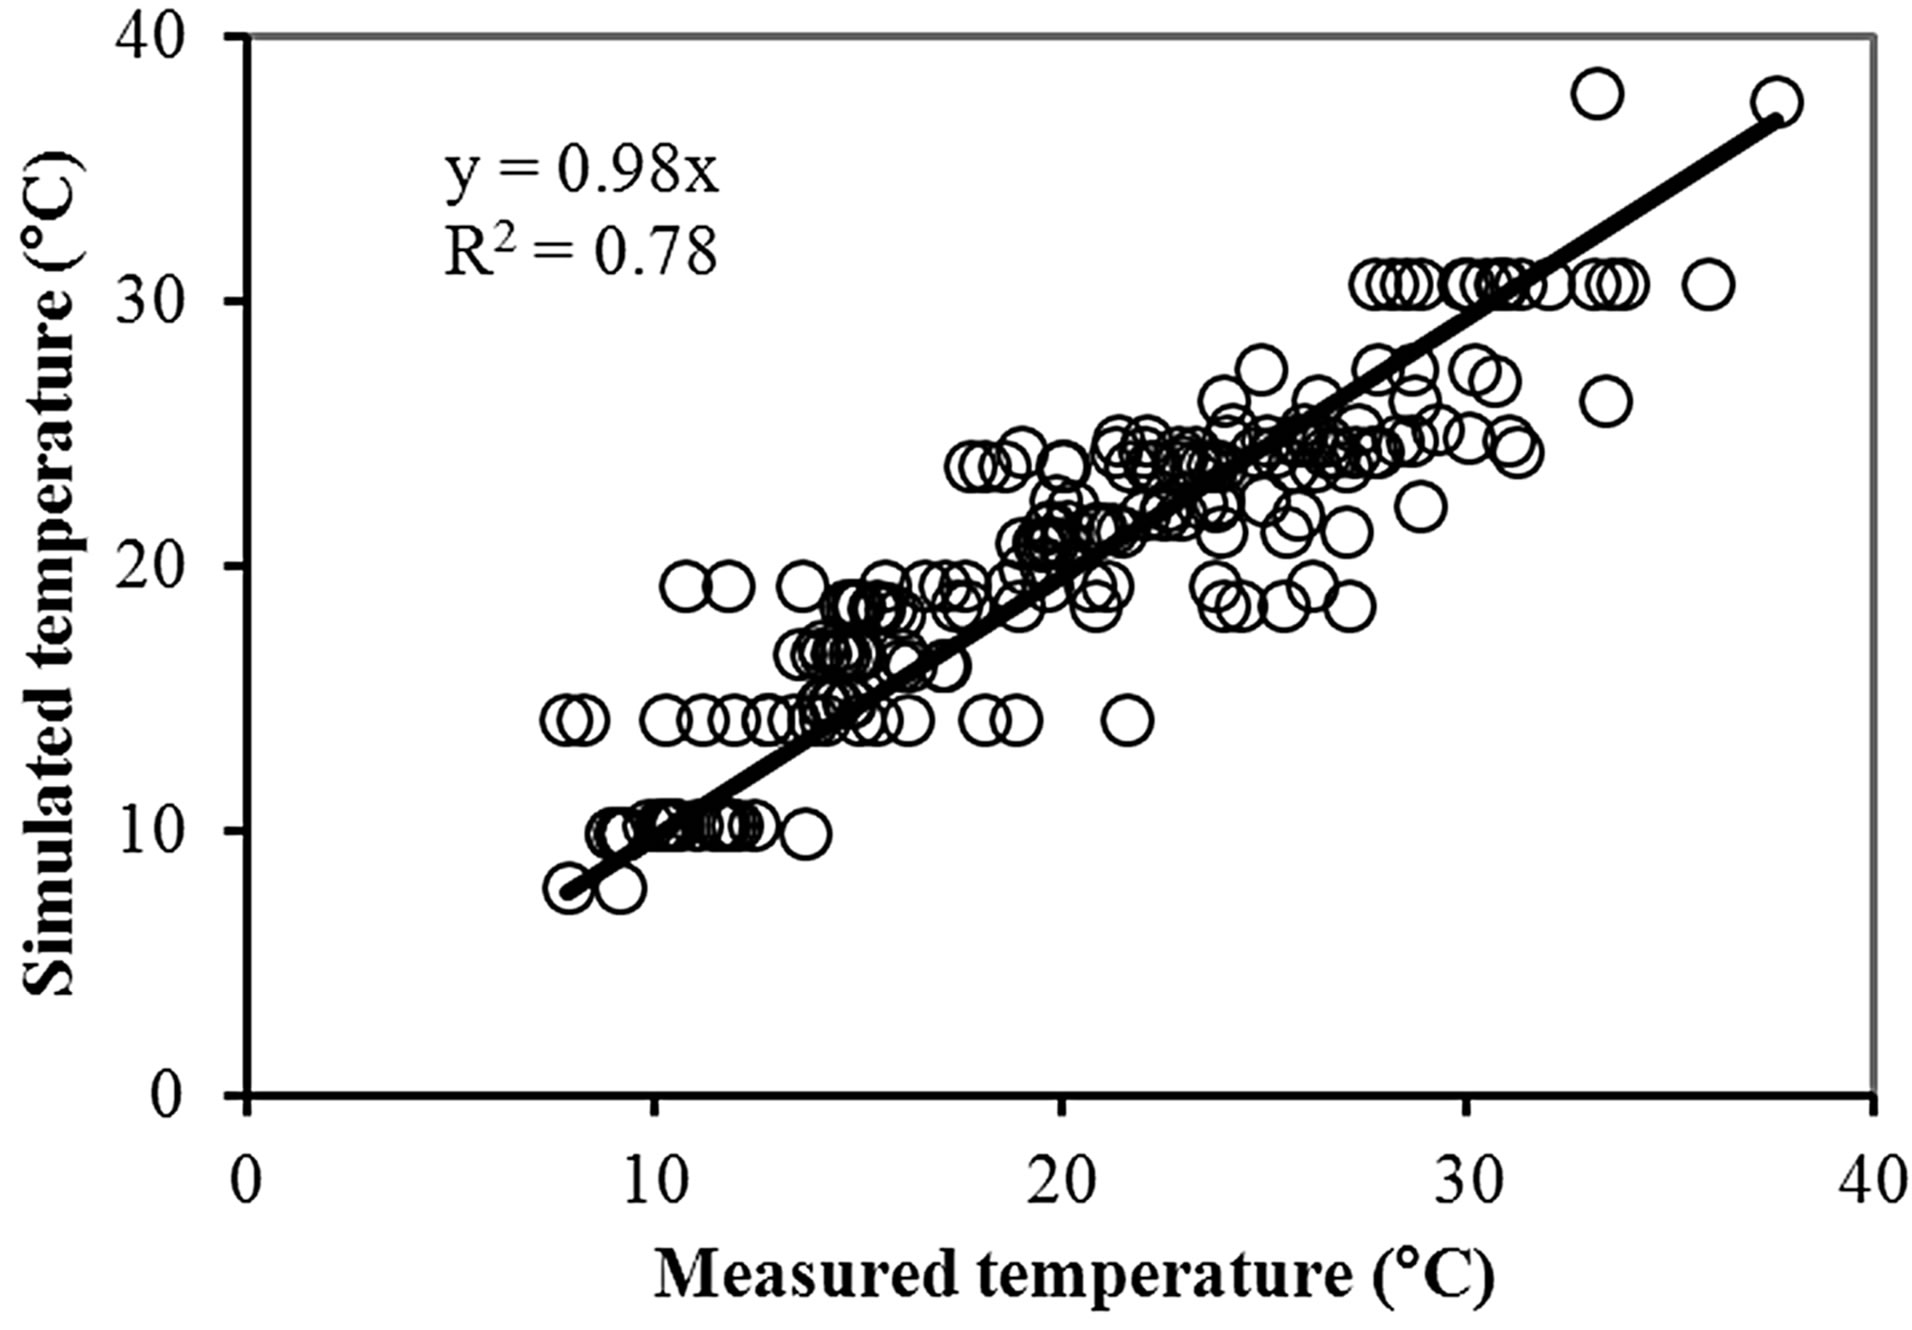 (b)
(b)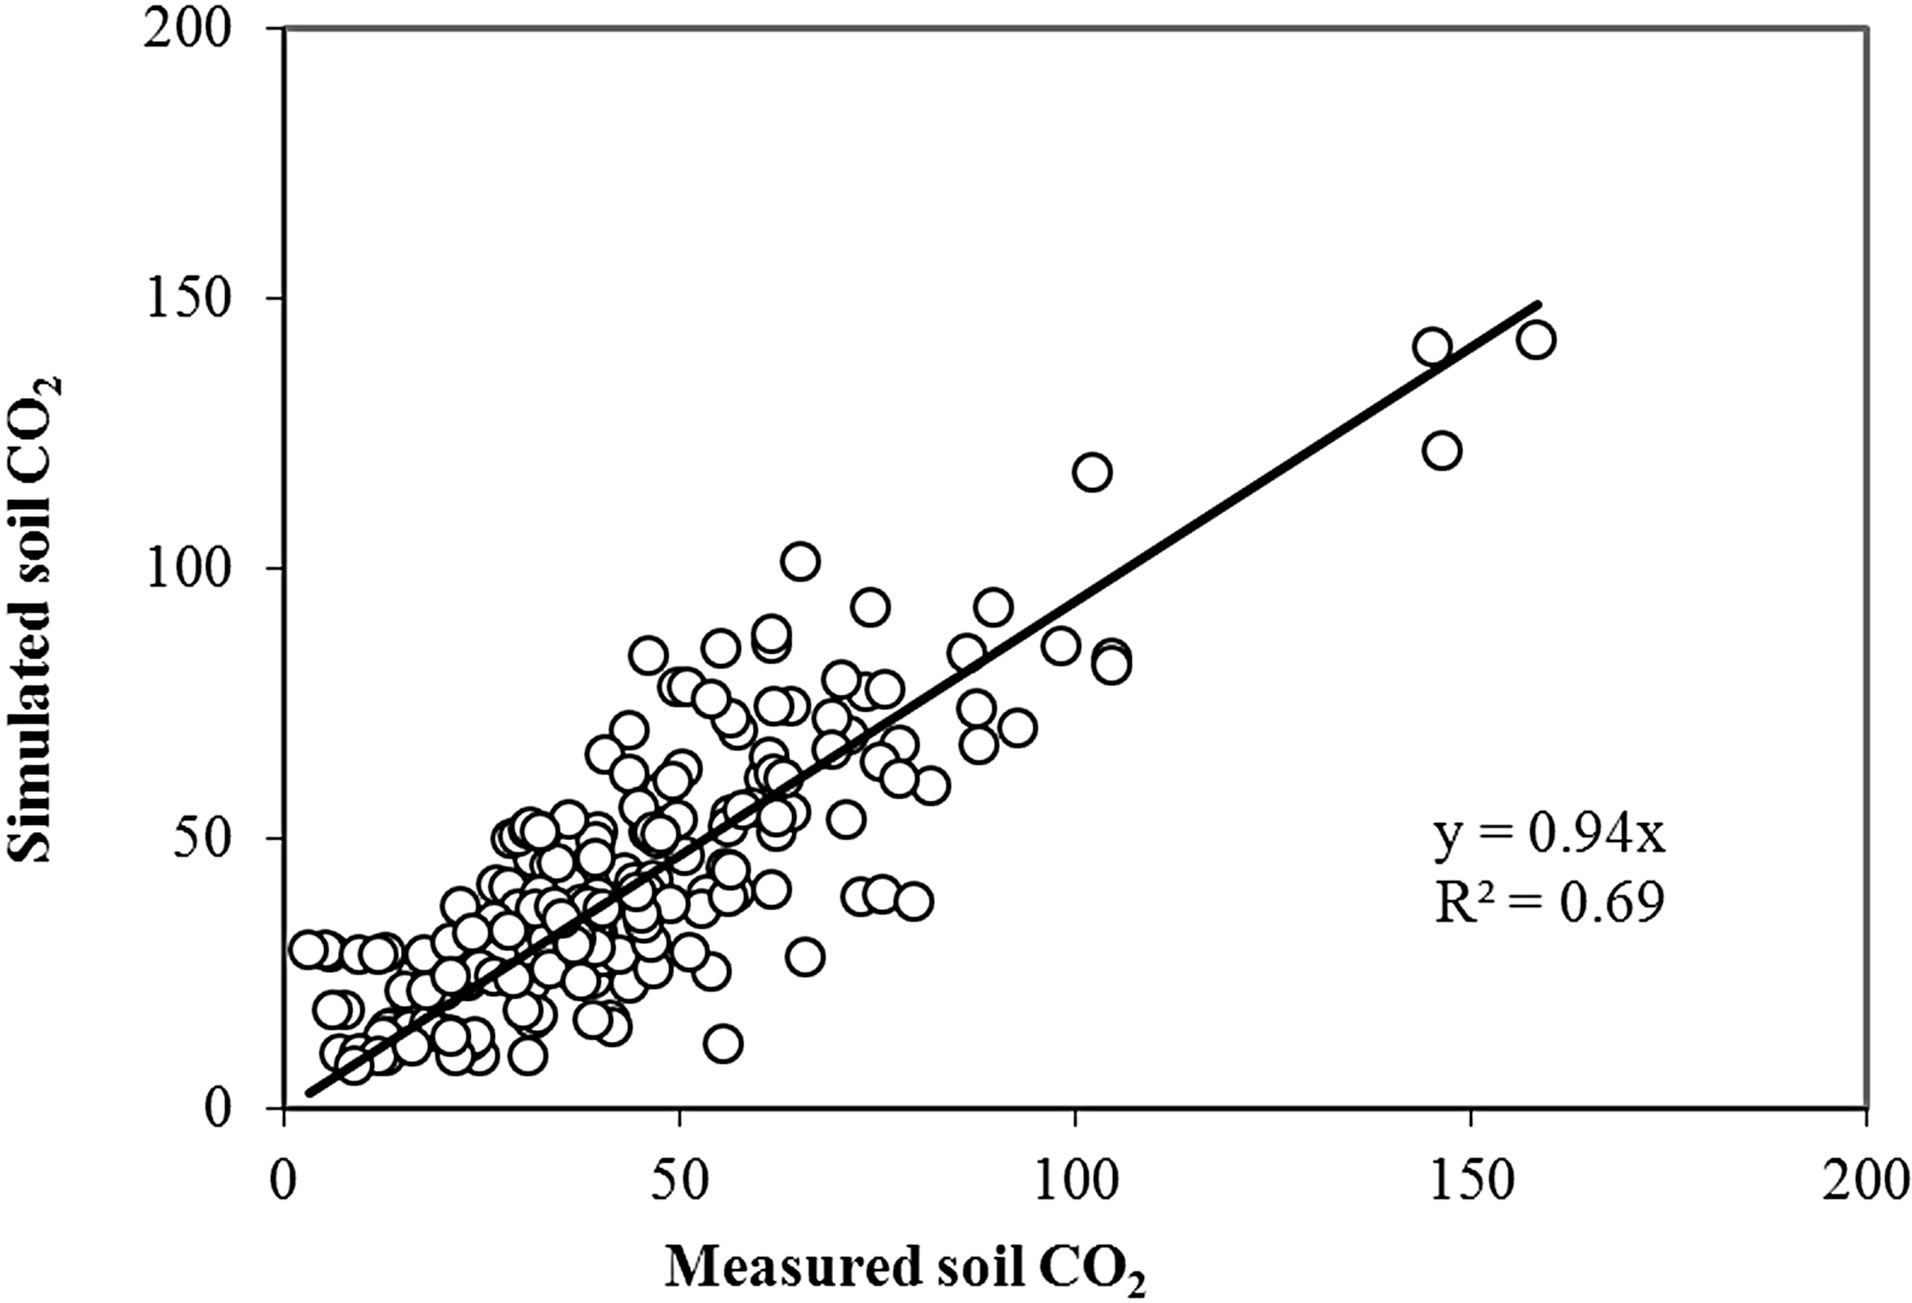 (c)
(c)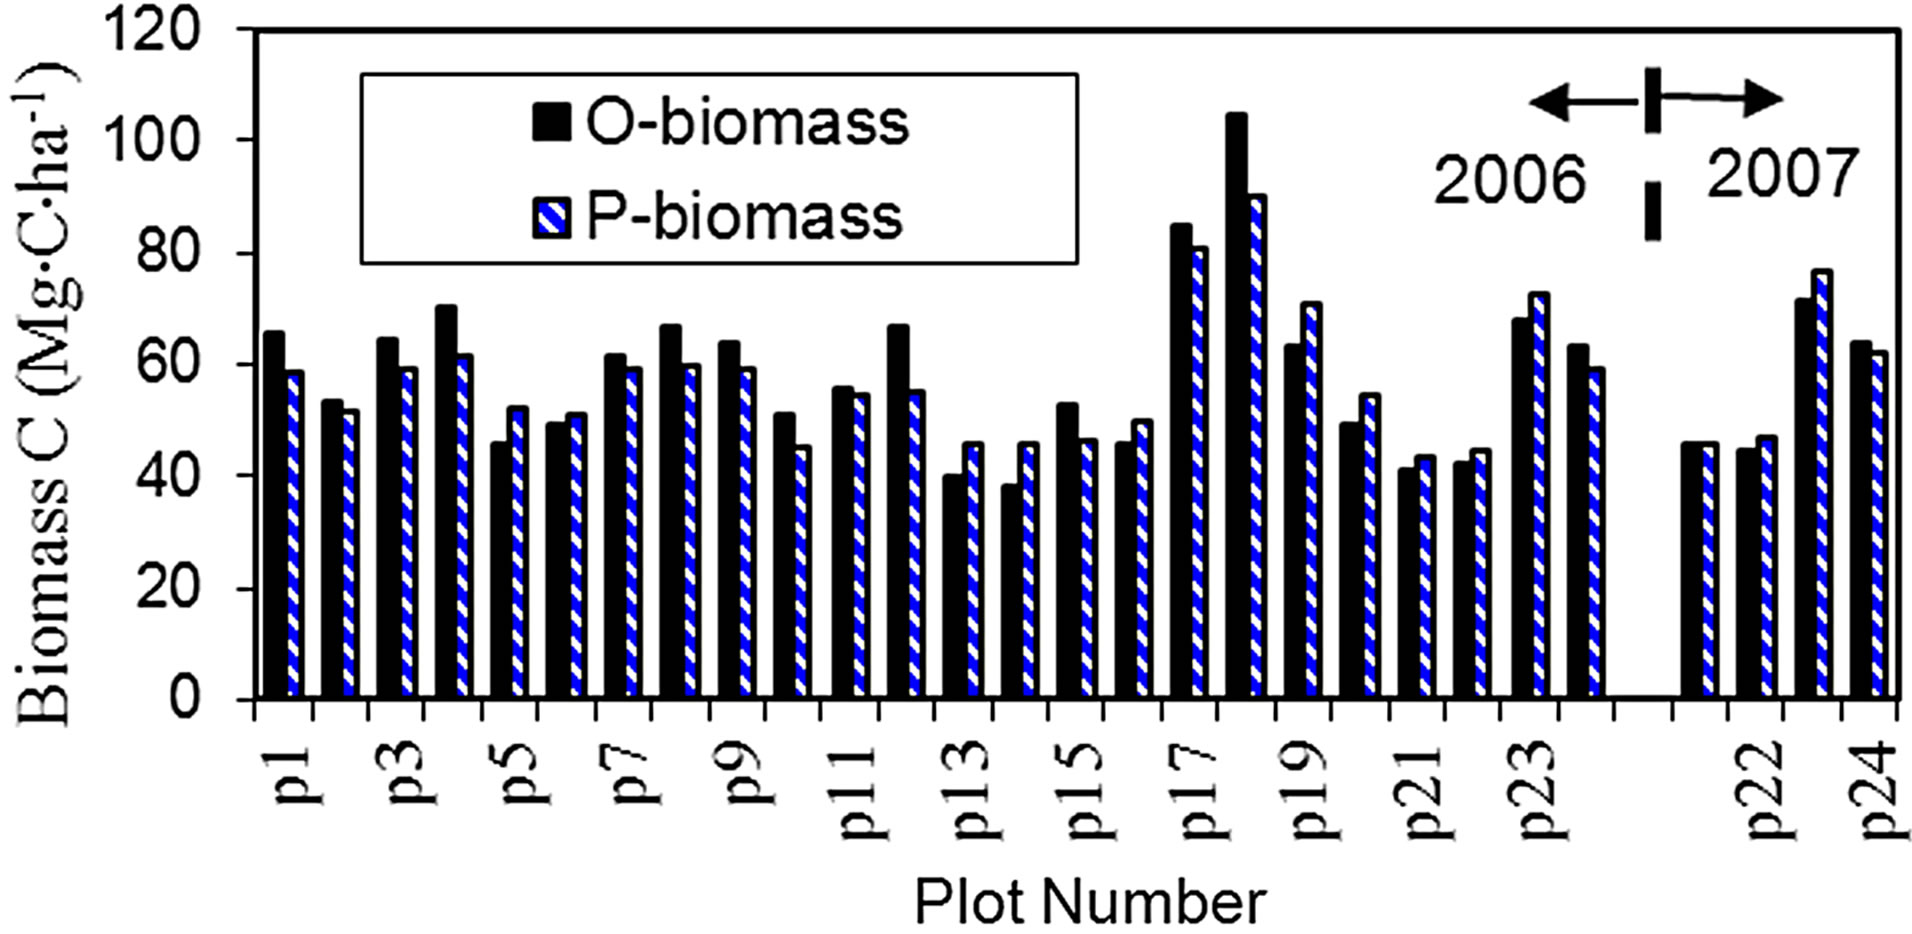 (d)
(d)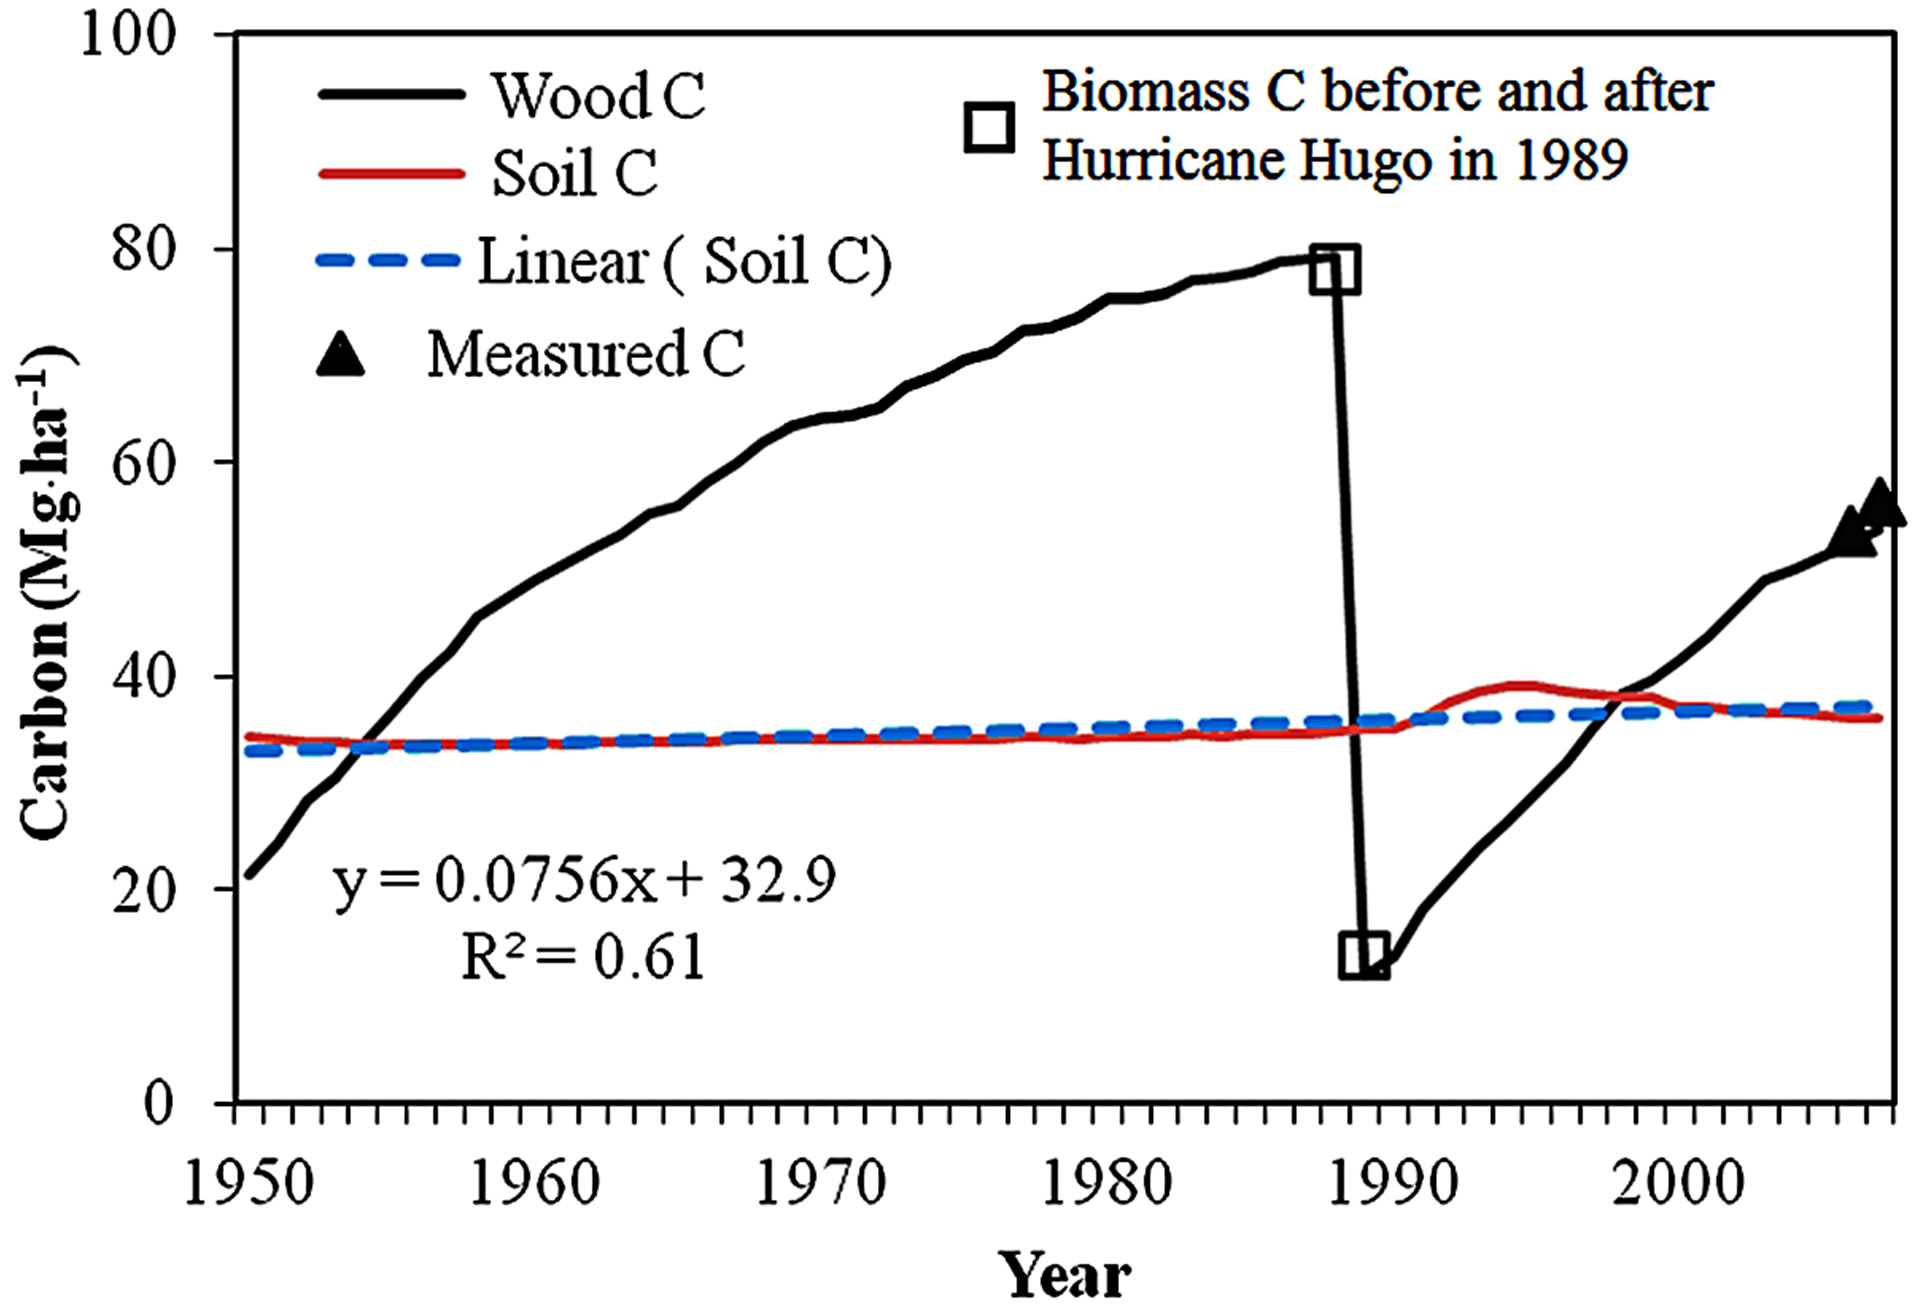 (e)
(e)
Figure 3. (a) Observed and simulated daily soil moisture (0 - 1) for eight plots (plot average) (n = 216); (b) Observed and simulated daily soil temperature (˚C) for eight plots (plot average) (n = 216); (c) Observed and simulated soil CO2 fluxes (kg·C·ha−1·d−1) for eight plots (plot average) (n = 200); (d) Observed and simulated aboveground biomass (Mg·C·ha−1) for plots p1 - p24 in 2006 and p21 - p24 in 2007 (O-biomass is the measured biomass C; P-biomass is the simulated); (e) Temporal changes in biomass and mineral soil organic carbon (Mg·C·ha−1) within a depth of 30 cm; ([Wood C] is simulated annual mean aboveground biomass C for the 58-year period from 1950-2007; [Measured C] is the estimated aboveground biomass for 2006 and 2007 using plot average based on the biomass measurements in 2006 and 2007, respectively; [Biomass C before and after Hurricane Hugo in 1989] is the aboveground biomass C estimated by Hook et al. (1996); n = 39 for the linear (Soil C) regression).
biomass loss to Hurricane Hugo in 1989. Because plotbased measurements for the biomass loss to the hurricane were not available, an average wood mass loss was used for all simulating units in this study. The estimated aver-
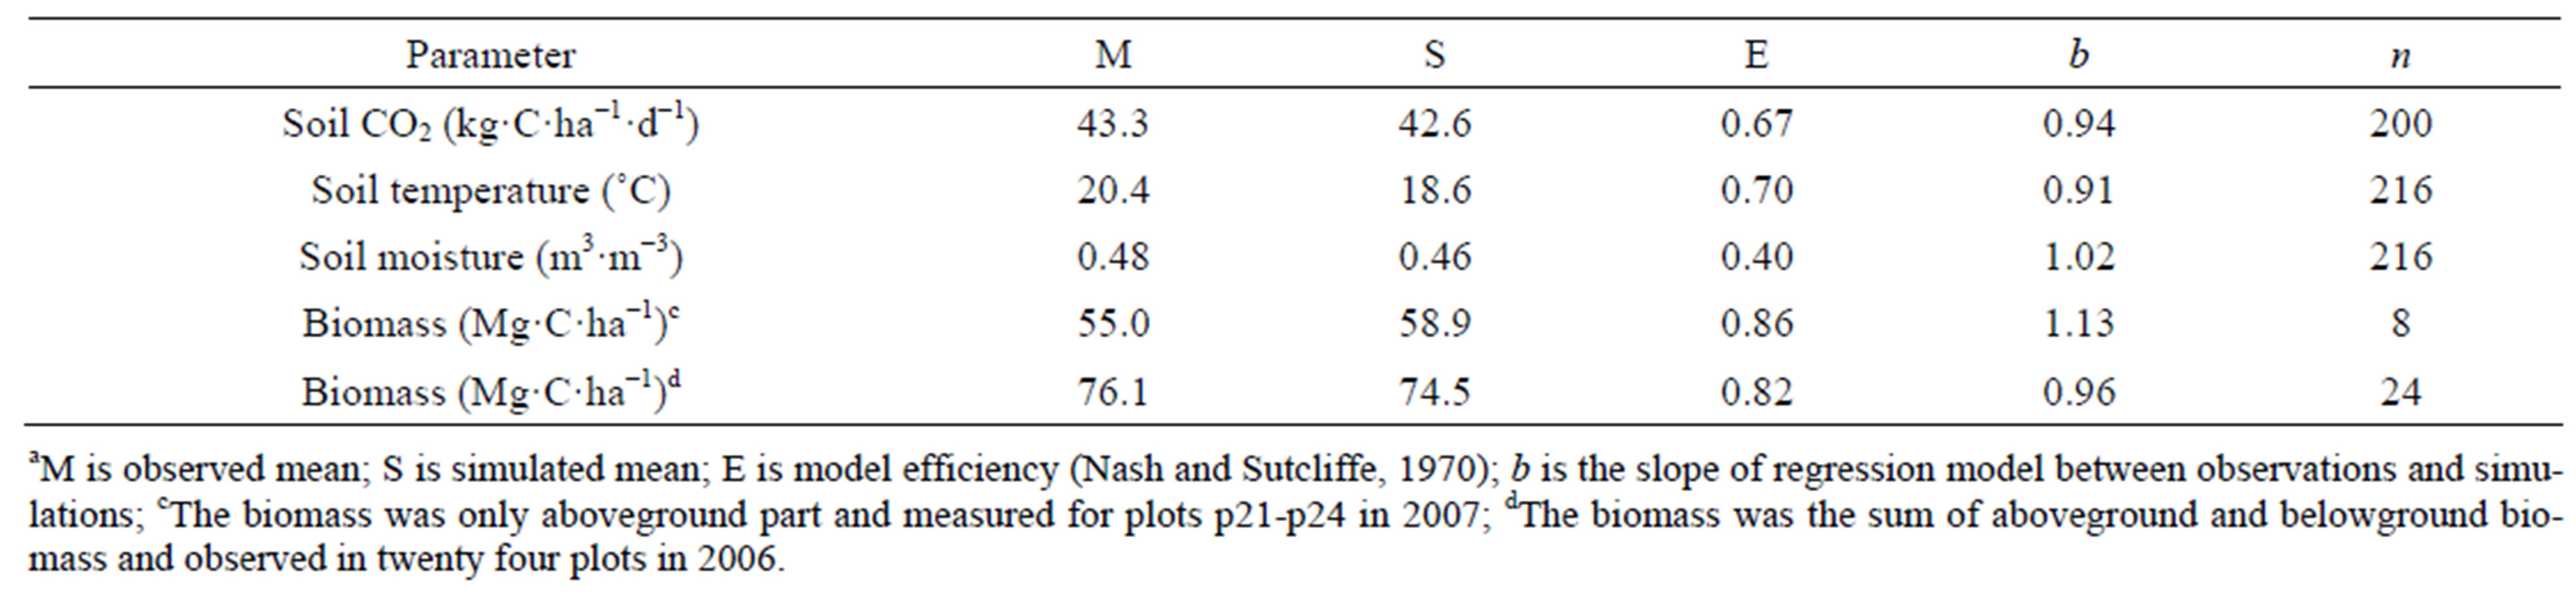
Table 3. Observed (M) and simulated (S) averages, model efficiency (E), the slope (b) of regression between observations and simulations, and numer of samples (n)a.
age loss was about 85% based on the damage investigation and studies [19,49,50]. In fact, the wood mass loss to the hurricane in this catchment was heterogeneous.
The Figure 3(e) presents the simulated annual mean aboveground biomass across the study catchment in the 58-year period from 1950-2007, and the biomass before and after the hurricane estimated by Hook et al. [42] (blank square) and the biomass inventoried in 2006 and 2007 (triangle) (unpublished data). The figure shows that the biomass simulated for pre-hurricane (79.3 Mg∙C∙ha−1) is in good agreement with the estimated biomass (78.0 Mg∙C∙ha−1) (blank squares on Figure 3(e)) for assessing the hurricane damage. However, the modeled biomass (12.1 Mg∙C∙ha−1) for post-hurricane was slightly lower than the biomass measurements (13.9 Mg∙C∙ha−1) for the hurricane damage assessment. The under-estimation from this study might be related to an overestimate in the mean biomass loss (85%) to the hurricane for the simulation. The simulated annual mean biomass across the catchment for the two inventories in 2006 and 2007 was slightly lower than the inventoried averages, differentiated about −1.8% and −5.0%, respectively. This difference might be in relation to the overestimation of the biomass loss to the hurricane leading a subsequent under prediction, but the difference should be within the errors produced by biomass measurements and the methods used to computing biomass based on DBH and heights of trees.
The model validation showed that the Forest-DNDC performed properly well for simulating soil CO2 flux, soil temperature and biomass, with E = 0.86 for biomass, E = 0.7 for soil temperature, and E = 0.67 for soil CO2, which are within the range of good model performance rating (0.5 ≤ E < 0.75) [63]. Although the E (0.4) is within the range of general model performance rating for modeling soil moisture, the slope of the regression model between the observations and simulations is close to 1.0 (b = 1.02), and the simulated mean soil moisture is approximately to the measured. The differences in the biomass between the simulation and measurements are small (4.9% for biomass loss to the hurricane and 3.4% for biomass inventories). The metrics indicate that the Forest-DNDC can be applicable for modeling biomass and soil CO2 dynamics for this forest with hurricane disturbance.
3.2. Spatial Differences in Net Ecosystem Exchange (NEE) and Soil CO2 Flux
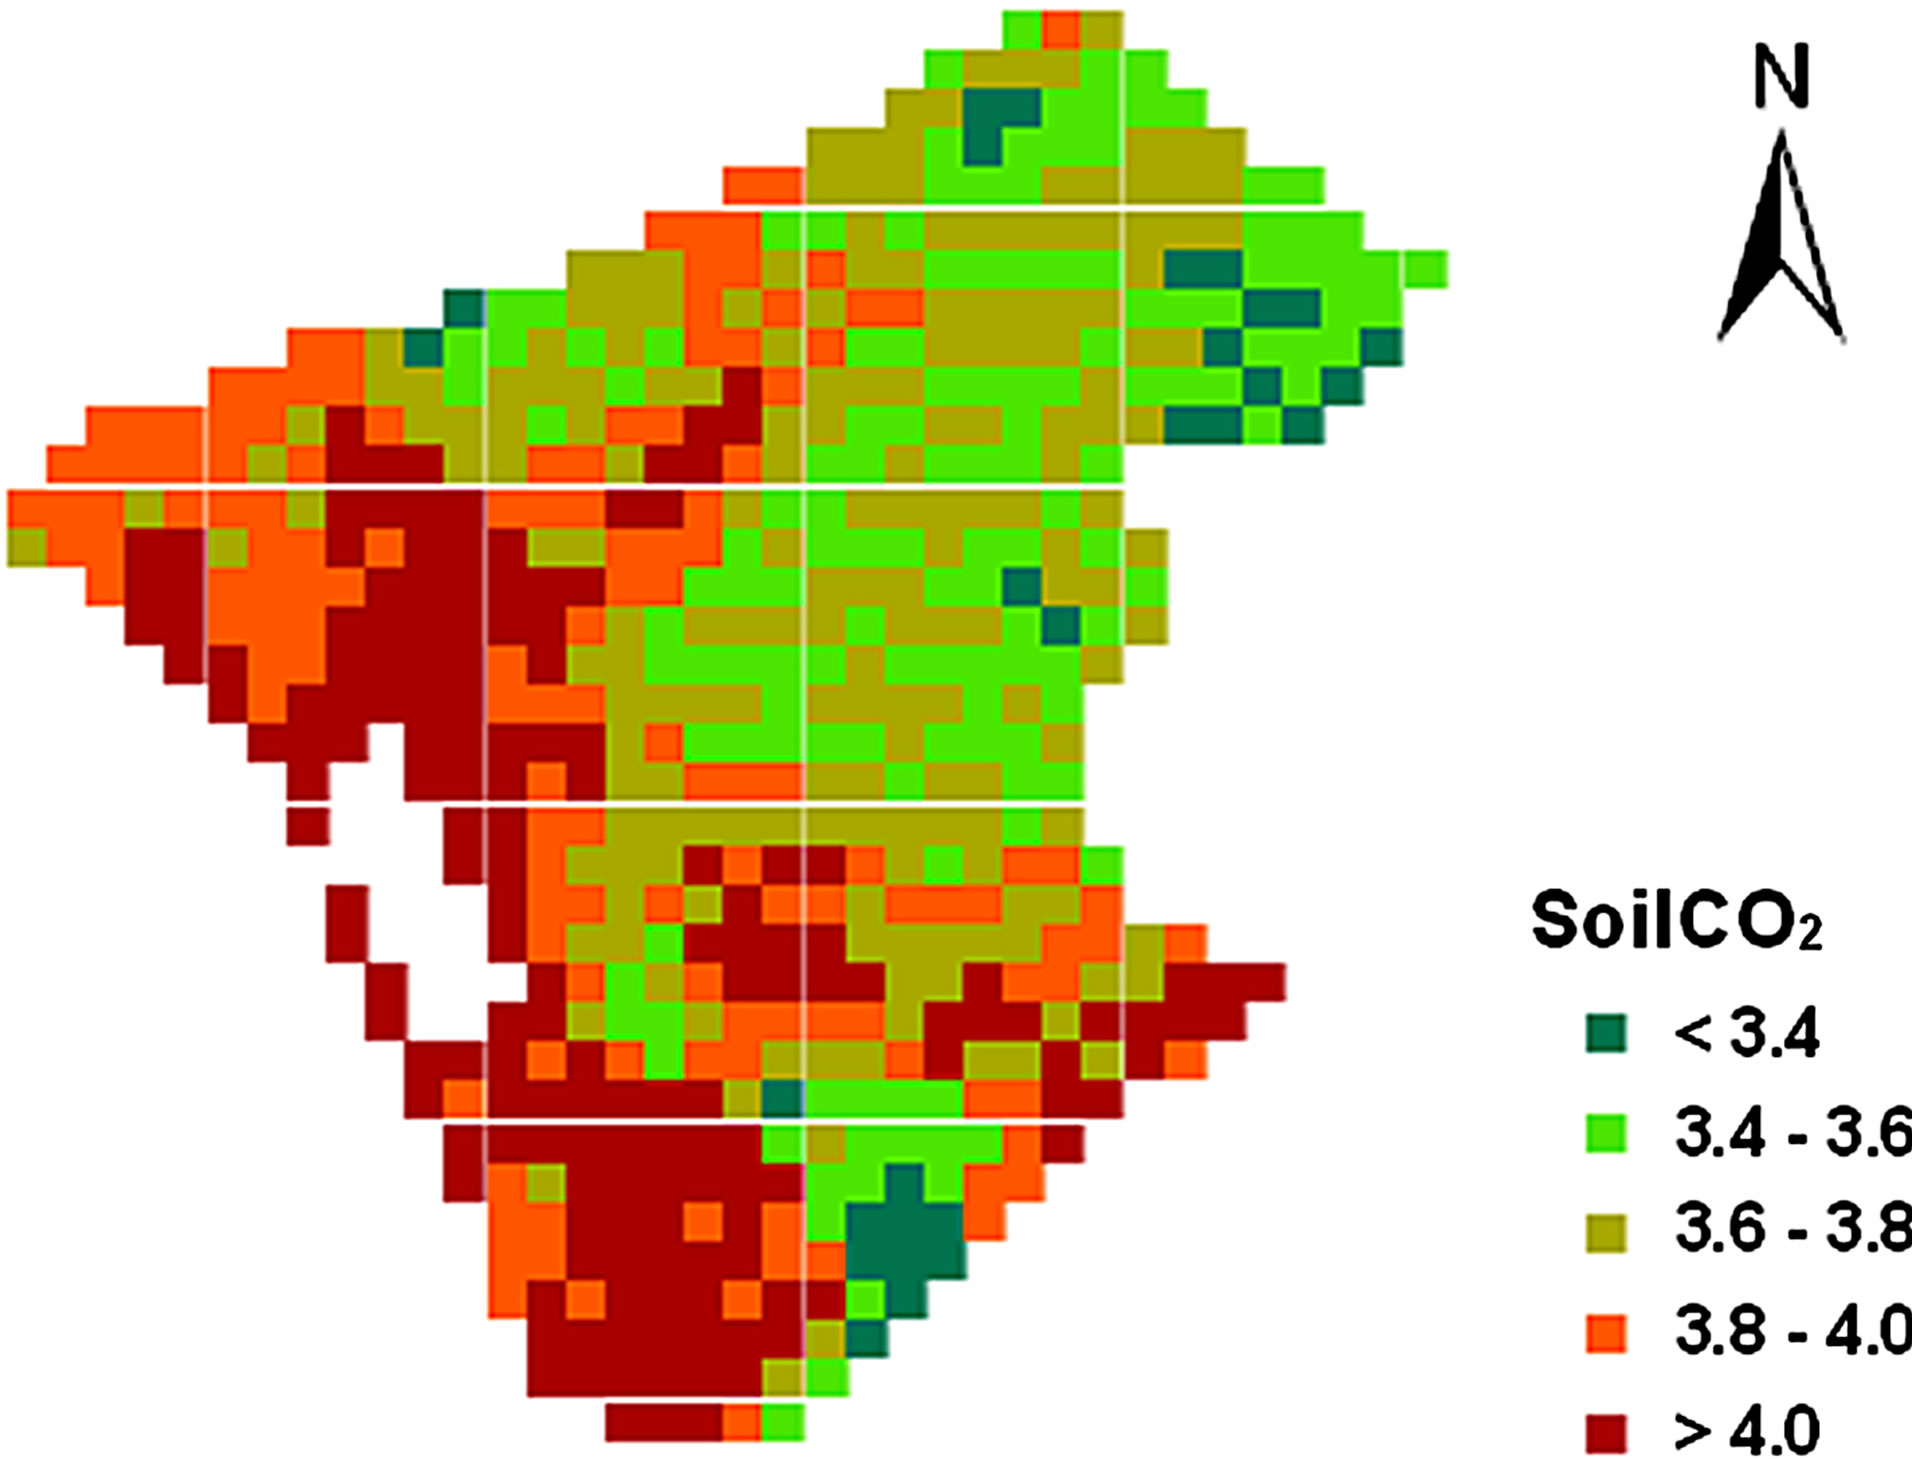
The cell-based (simulation unit) annual average soil CO2 flux in this watershed spatially ranged from 3.2 - 4.8 Mg∙C∙ha−1 during the period from 1950-2007 (Figure 4(a), Table 4), which showed that there was a substantially spatial difference in the flux. The spatial difference in soil CO2 flux is likely resulted from differentiated soil conditions, including soil moisture and soil organic content, and vegetation distribution [64,65]. The arithmetic mean, median and geometric mean of the 58-year soil CO2 flux on WS80 were same, 3.8 Mg∙C∙ha−1, which indicates a spatially normal distribution in this watershed. High CO2 flux occurred in the uplands, and low flux in wetlands.
The spatial variation of NEE in the catchment was large, but the annual mean C storage was low (high NEE). The cell-based annual average NEE ranged from −0.4 to −2.5 Mg∙C∙ha−1 (Figure 4(b)) with an arithmetic mean of −1.1 and geometric value of −1.0 Mg∙C∙ha−1 during the time period from 1950-2007. The high NEE at this site was primarily resulted from the decomposition of large amount of debris left by Hurricane Hugo in 1989, including fallen trees (178 m3∙ha−1 - 24 m3∙ha−1 = 154 m3∙ha−1 woody debris) due to without salvage logging and biomass removal after the hurricane and dead roots (about 19.2 Mg∙C∙ha−1) produced by the destruction of - the forest (see more discussion on the hurricane impact below). This is because CO2 released from the decomposition of the residues remained in the forest was much higher than the amount consumed by the regenerating forest within several years after the storm.
Compared to the NEE (−1.85 Mg∙C∙ha−1∙yr−1) in the same period from 1950-2008 at Savannah River Site in South Carolina where the forest was not disturbed by any hurricane [62], the high NEE in this catchment showed that the hurricane was highly impacted on the C sequestration to this forest.
 (a)
(a)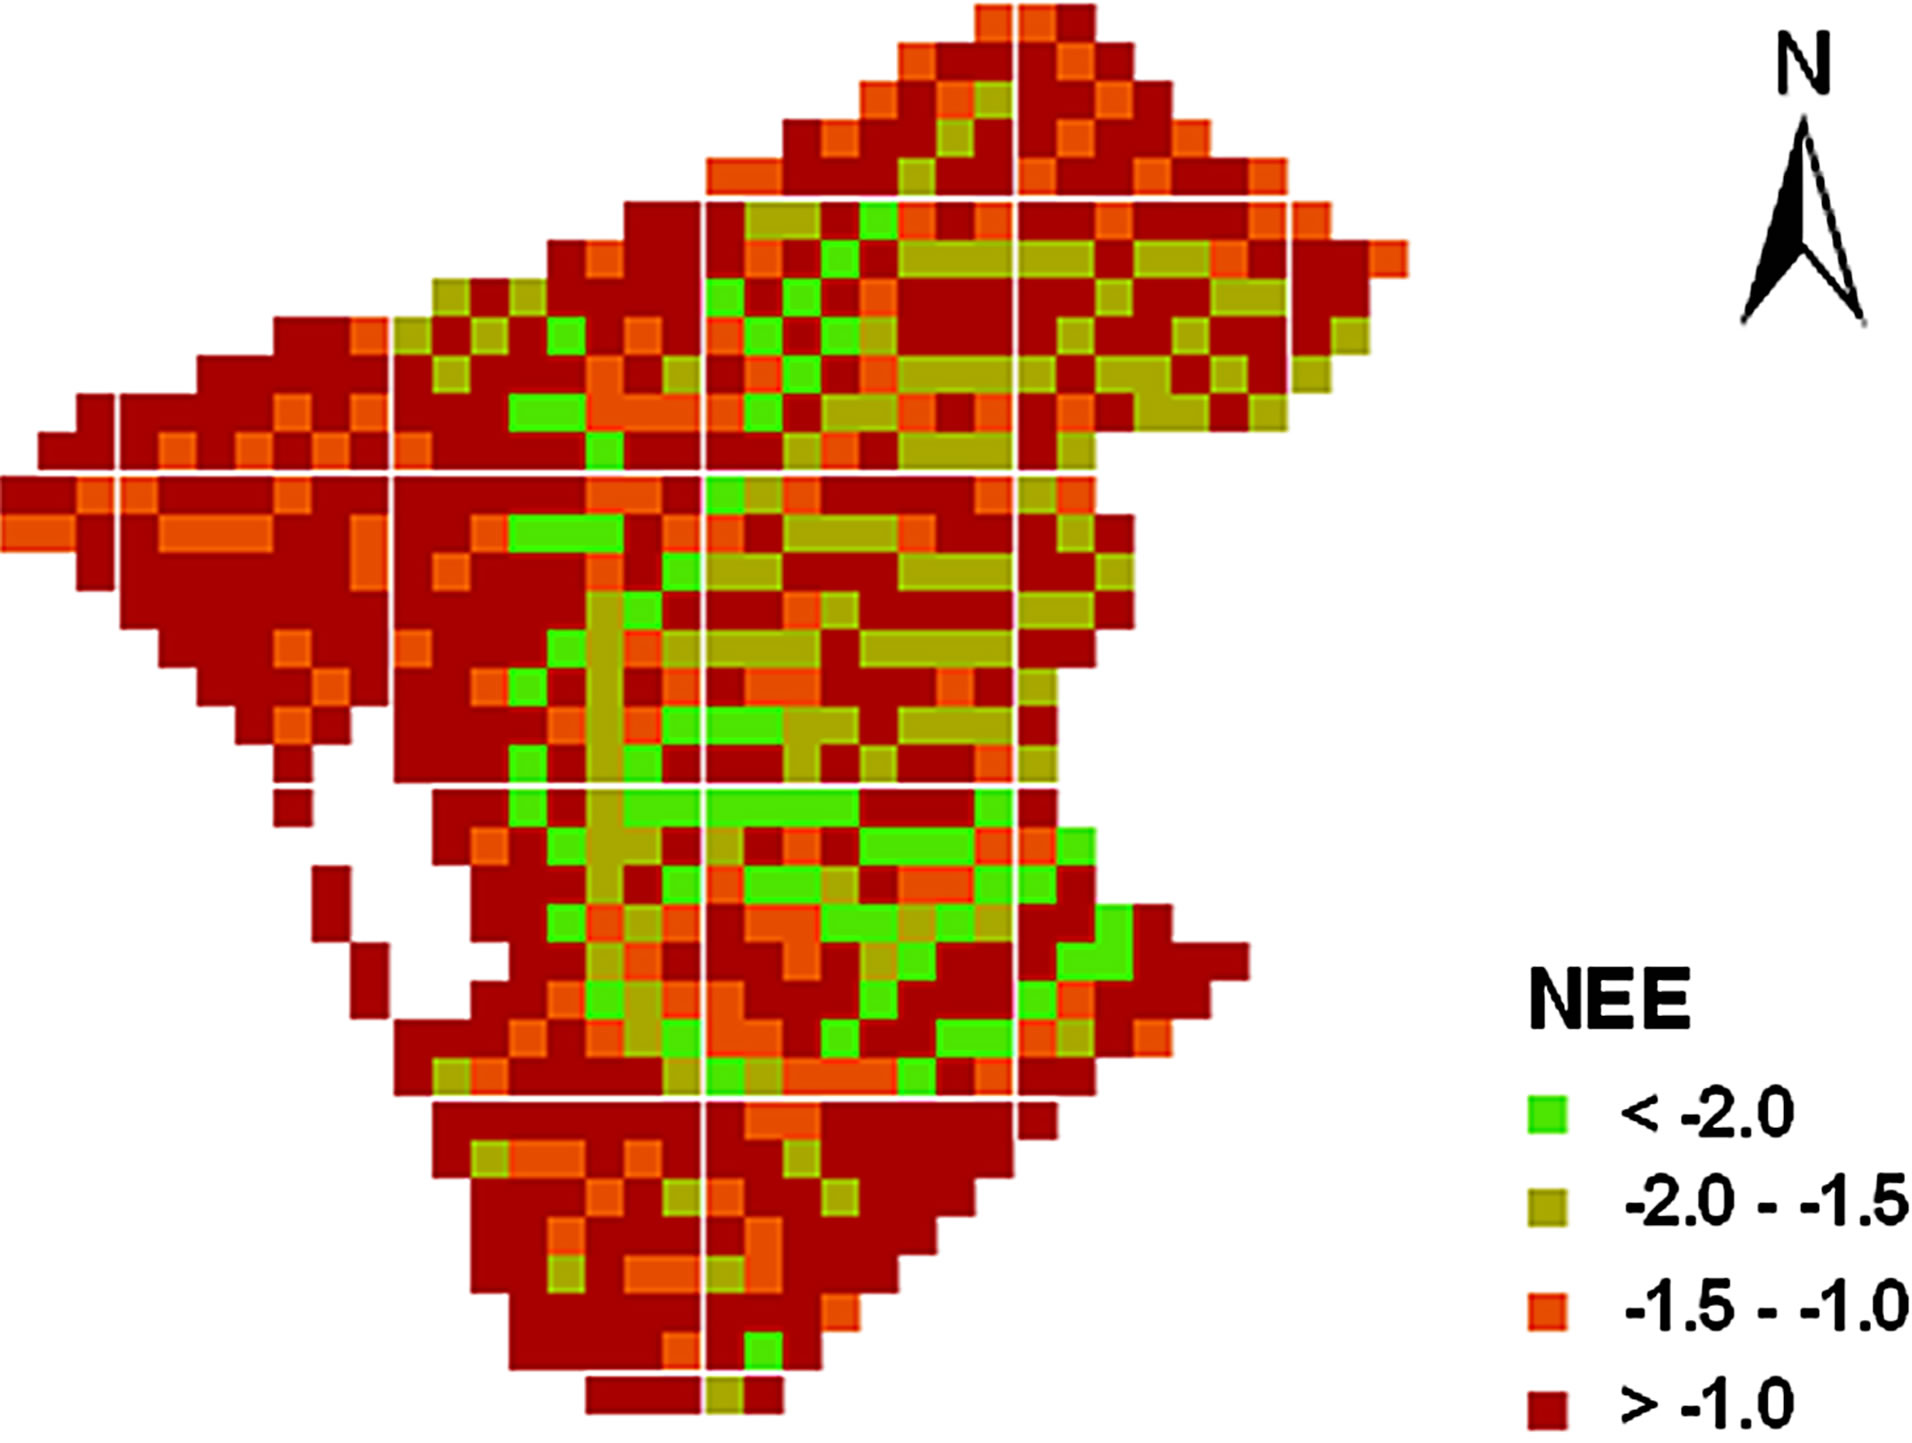 (b)
(b)
Figure 4. (a) Spatial differences in annual average soil CO2 flux (Mg·C·ha−1·yr−1) in the period from 1950-2007; (b) Spatial differences in annual average NEE (Mg·C·ha−1·yr−1) in the period from 1950-2007.
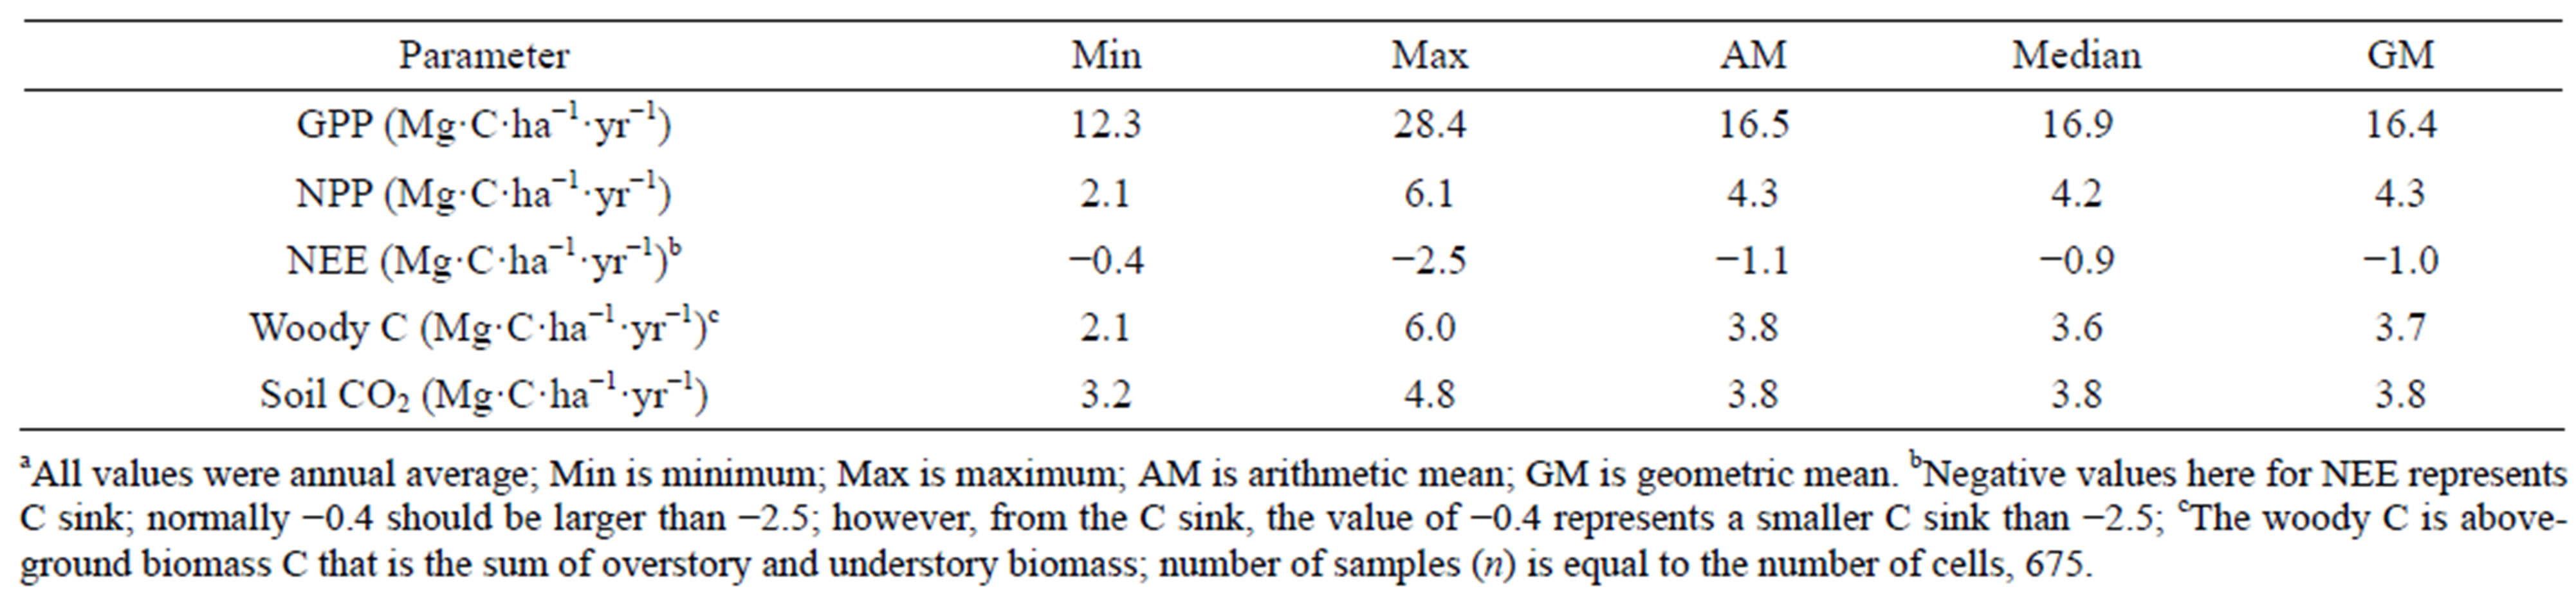
Table 4. Simulated spatial differences in annual averages of GPP, NPP NEE, biomass C and soil CO2-Ca.
3.3. Temporal Changes in Soil CO2 Flux
The hurricane did not only destroy the forest in this catchment, but also it added a large amount of coarse wood debris (CWD) to forest floor and dead roots to mineral soil. Therefore, CO2 flux was substantially higher within a short time period after the hurricane than before the disastrous wind due to the contribution from the decomposition of organic C added to the soils (SOC) by the hurricane, excluding CWD, litter and duff, (Figure 5), which was primarily as the result from the dead roots. However, the Figure 5 also shows that the impact of dead roots added by the hurricane has likely been small at present, about 15 years after.
The annual soil CO2 flux from the study catchment between 1950 and 2007 was presented in Figure 5. The figure showed an abnormally high CO2 flux in a short time period after the hurricane. The abnormal flux was mainly resulted from decomposition of the dead woods and debris left by the hurricane, added over 64 Mg∙C∙ha−1 to forest floor and about 19 Mg∙C∙ha−1 to soils (see the Impact of Hurricane Hugo on C sequestration below), because this watershed serves as control in the paired watershed system. However, the CO2 flux is not constant even if there is no a hurricane disturbance. Figure 5 indi-
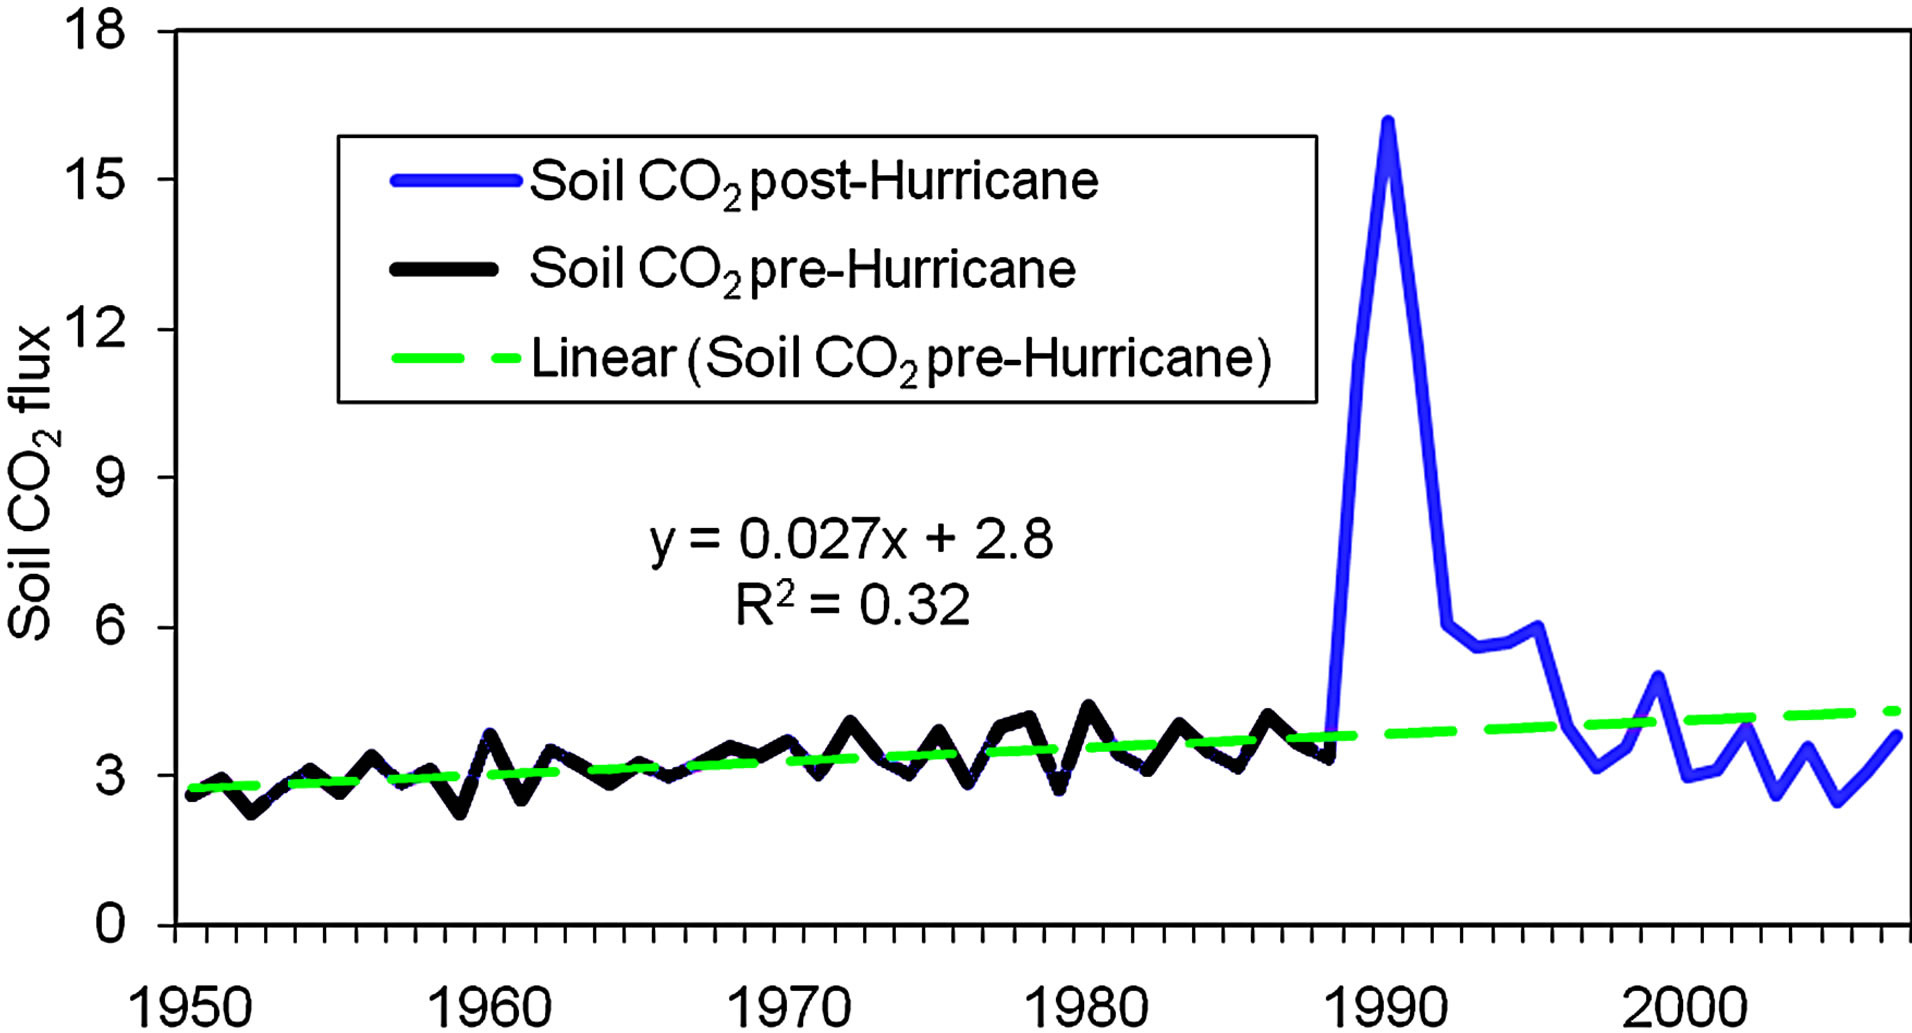
Figure 5. Temporal changes in soil CO2 flux (Mg·C·ha–1·yr–1) in the period from 1950-2007 (n = 39 for the pre-hurricane period, n = 19 for post-hurricane period).
cated that the annual flux fluctuated and linearly increased at an average rate of about 27 kg∙C∙ha−1∙yr−1 before the hurricane. The slow and linear increase in soil CO2 before the hurricane was likely resulted from two factors, an increase in biomass, including roots and leaf that can be the main factor leading to an increase soil CO2 flux, and the increase in air temperature which can cause a small increase in SOC decomposition [64] because the temperature increased at an average rate of 0.21˚C per decade during the time period from 19501988 (the pre-hurricane period) [11]. However, the inter-annual soil CO2 flux fluctuation in the same period was principally related to the changes in soil moisture regime (see more discussion below). Figure 5 also showed that the hurricane significantly influenced soil CO2 flux. This was because the hurricane left a large amount of debris on the forest floor and dead roots in the soils, and those fine and small residues can decompose fast under the subtropical climate, producing a high CO2 flux within a short period after the hurricane.
3.4. Impact of Climatic Variability on CO2 Sequestration
We only analyzed the C dynamics in this forest in the period from 1950-1988 in order to understand well the impact of climate variability on C sequestration due to without a hurricane perturbation in the period. The results from simulation showed that climatic variability hardly influenced C sequestration to the forest product in this study catchment during the period from 1950-1988 (before the hurricane), including without substantial impacts of the variation in temperature (R2 = 0.0004) and precipitation (R2 = 0.015). However, the climate variability influenced C sequestration to the forested ecosystems, even if there were no impacts of hurricanes. The NEE increase significantly with a decrease in precipitation before the hurricane in this forested watershed (P < 0.02) (Figure 6), but insignificantly with an increase or decrease in temperature (R2 = 0.01, P > 0.1). The increase in NEE was principally resulted from an increase in soil CO2 flux caused by the changes in soil moisture regime regulating C dynamics in this watershed. Soil CO2 flux from this forest was lower in the wet years than in dry years because the soil was saturated for a long period in wet years [62]. For example, mean soil CO2 flux from this watershed in 2004 was over 1 Mg∙C∙ha−1 higher than the flux in the two adjacent years (2003 and 2005) because 2003 and 2005 were much wetter than 2004, about 710 and 580 mm precipitation higher than 2004, respectively, but the temperature in the three years was approximate. High soil CO2 flux in dry years is primarily as wetlands loss to a decrease in the water table level regulated by precipitation and evapotranspiration in this forest. This result was similar to the finding of Pietsch et al. [7] that water table level decrease in their sites led to an increase in soil carbon loss. This result implies that global warming can lead more soil CO2 release from this type of forested wetlands because the warming does not bring more rain to this subtropical area [10,11].
3.5. Impact of Hurricane Hugo on Carbon Sequestration
Carbon sequestration in this forest did not monoto-
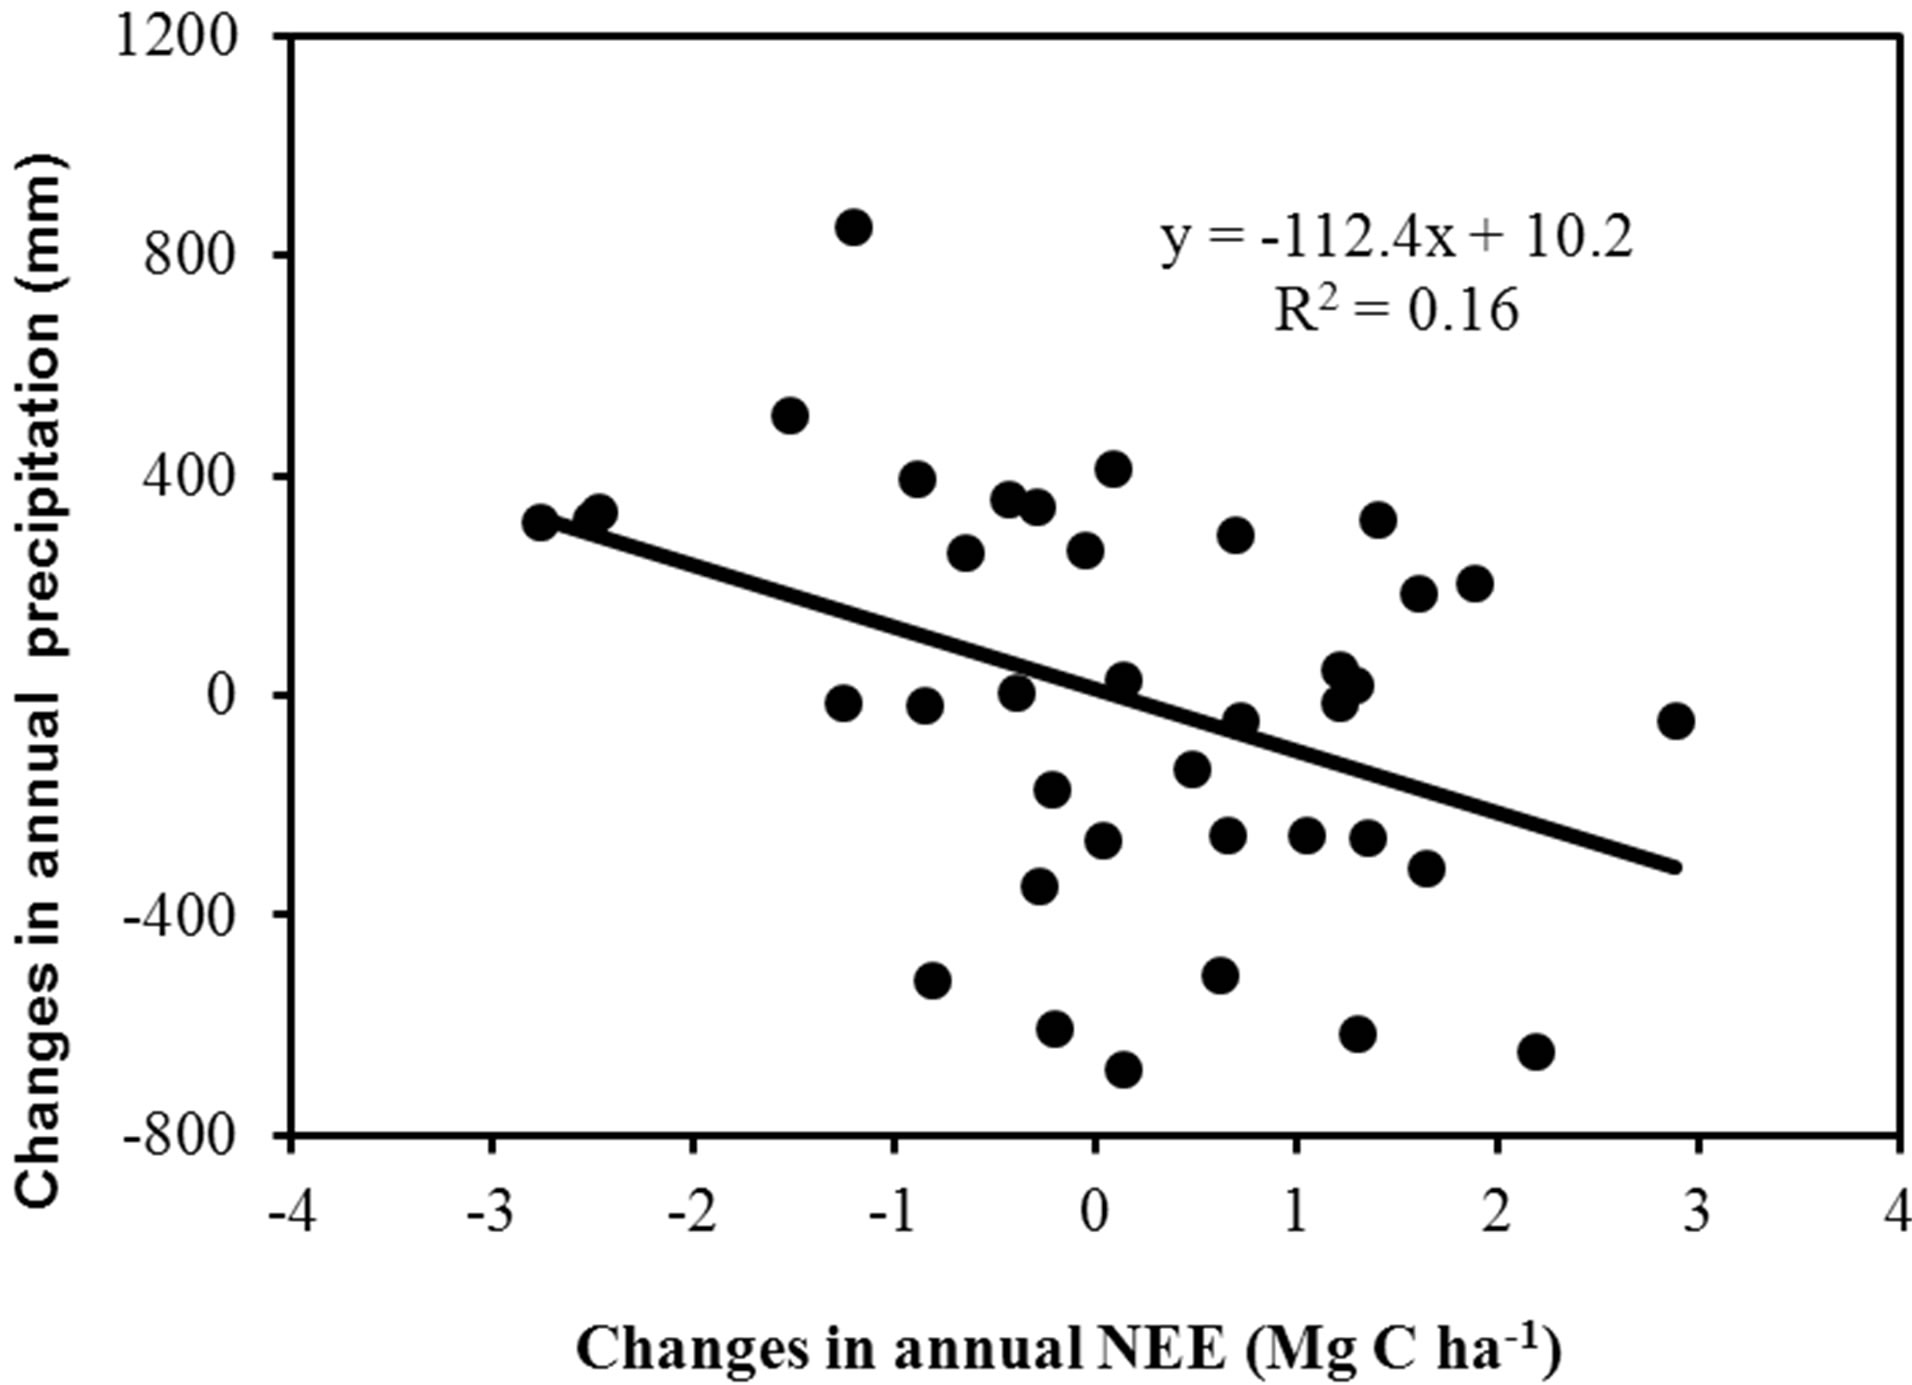
Figure 6. Impact of precipitation on NEE during the period from 1950-1988 (n = 39, the pre-hurricane period).
nously change in time, although the forest has not been managed near six decades, because there was a large fault (Figure 3(e)). The fault of C sequestration in the forest is primarily resulted from the disastrous storm, Hurricane Hugo in 1989, which blew down over 80% of trees in this watershed [19]. Both the simulation and measurements showed the hurricane substantially influenced C storage in the stands in this forest. The simulated mean aboveground biomass altered from 79.3 Mg∙C∙ha−1 before the hurricane to 12.1 Mg∙C∙ha−1 after the hurricane; the measured biomass reduced from78.0 Mg∙C∙ha−1 to 13.9 Mg∙C∙ha−1. These results indicated that the hurricane reduced the wood biomass C storage in the stands by over 82% in the forest in 1989.
Hurricane Hugo did not only cut the C storage in the stands of the forest, but also it impacted the soil CO2 flux due to the decomposition of the residues left by the hurricane (Figure 5). A substantial increase in CO2 flux (the abnormal high flux) occurred in this forest within several years after the hurricane. The abnormal CO2 flux after the hurricane is primarily as the result of this catchment (WS80) serving as a control watershed within the paired watershed system (see Figure 1) that is used to study forest and hydrology (see Section of Materials and Methods). Accordingly, all fallen trees and debris (about 64 Mg∙C∙ha−1) left by the hurricane remained on the forest floor, led to a subsequent increase in CO2 flux due to the decomposition of those residues. Another factor with respect to an increase in soil CO2 flux is the dead roots, about 19.2 Mg∙C∙ha−1 estimated on the basis of the radio of aboveground biomass to the roots [59,60], left in the soils due to the destruction of the forest. However, the impact of the dead roots on soil CO2 flux has become very small about 10 years late after the hurricane due to decomposing year-by-year with an exponential decrease in the mass [66].
4. CONCLUSIONS
This study indicates that Forest-DNDC with a spatially explicit modeling approach is applicable for estimating C sequestration for the coastal forested watershed with a mosaic landscape consisting of wetlands and uplands. The agreement result between observation and simulation for biomass with a disastrous hurricane disturbance shows that this model can simulate C sequestration not only for the forested ecosystems without impacts of hurricanes but also for the similar forested ecosystems with hurricane perturbations.
This study indicates that hurricane can substantially influence CO2 sequestration in the coastal forest ecosystems, including reducing C storage in the stands and increasing soil CO2 flux within a short period. Climate variability and change can alter soil CO2 flux from this forested watershed. CO2 fluxes can increase with a decrease in water table level regulated by climate. Projecting those impacts to future climate change, soil CO2 flux can increase due to temperature rise without bringing more precipitation to this forest, leading to an increase in evapotranspiration demands that incurs a decrease in water table level.
REFERENCES
- Hansen, J., Sato, M., Ruedy, R., Lo, K., Lea, D.W. and Medina-Elizade, M. (2006) Global temperature change. Proceedings of the National Academy of Sciences of the United States of America, 103, 14288-14293. doi:10.1073/pnas.0606291103
- Trenberth, K.E., Jones, P.D., Ambenje, P., Bojariu, R., Easterling, D., Klein Tank, A., Parker, D., Rahimzadeh, F., Renwick, J.A., Rusticucci, M., Soden, B. and Zhai, P. (2007) Observations: Surface and atmospheric climate change. In: Solomon, S., Qin, D., Manning, M., Chen, Z., Marquis, M., Averyt, K.B., Tignor, M. and Miller, H.L., Eds., Climate Change 2007: The Physical Science Basis, Contribution of Working Group I to the Fourth Assessment Report of the Intergovernmental Panel on Climate Change, Cambridge University Press, Cambridge and New York.
- Trettin, C.C. and Jurgensen, M.F. (2003) Carbon cycling in wetland forest soils. In: Kimble, J., Birdsie, R. and Lal, R., Eds., Carbon Sequestration in US Forests, CRC Press LLC, Boca Raton.
- Trettin, C.C., Laiho, R., Minkkinen, K. and Laine, J. (2006) Influence of climate change factors on carbon dynamics in northern forested peatlands. Canadian Journal of Soil Science, 86, 269-280. doi:10.4141/S05-089
- Miehle, P., Livesley, S.J., Feikema, P.M., Li, C. and Arndt, S.K. (2006) Assessing productivity and carbon sequestration capacity of Eucalyptus globules plantation using the process model Forest-DNDC: Calibration and validation. Ecological Modeling, 192, 83-94. doi:10.1016/j.ecolmodel.2005.07.021
- Pan, Y., Birdsey, R.A., Fang, J., Houghton, R., kauppi, P.E., Kurz, W.A., Phillips, O.L., Shvidenko, A., Lewis, S.L., Canadell, J.G., Ciais, P., Jackson, R.B., Pacala, S.W., McGuire, D.A., Piao, S., Rautiainen, A., Sitch, S. and Hayes, D. (2011) A large and persistent carbon sink in the world’s forests. Science, 333, 988-993. doi:10.1126/science.1201609
- Pietsch, S.A., Hasenauer, H., Kucera, J. and Cermak, J. (2003) Modeling effects of hydrological changes on the carbon and nitrogen balance of oak in floodplains. Tree Physiology, 23, 735-746. doi:10.1093/treephys/23.11.735
- Riveros-Iregui, D.A. and McGlynn, B.L. (2009) Landscape structure control on soil CO2 efflux variability in complex terrain: Scaling from point observation to watershed scale fluxes. Journal of Geophysical Research: Biogeosciences, 114, G02010. doi:10.1029/2008JG000885
- Pacific, V.J., McGlynn, B.L., Riveros-Iregui, D.A., Epstein, H.E. and Welsch, D.L. (2009) Differential soil respiration response to changing hydrologic regimes. Water Resources Research, 45, W07201. doi:10.1029/2009WR007721
- Zhang, X., Zwiers, F.W., Hegerl, G.C., Hugo Lambert, F., Gillett, N.P., Solomon, S., Stott, P.A. and Nozawa, T. (2007) Detection of human influence on twentieth-century precipitation trends. Nature, 448, 461-465. doi:10.1038/nature06025
- Dai, Z., Amatya, D.M., Sun, G., Trettin, C.C., Li, C. and Li, H. (2011) Climate variability and its impact on forest hydrology on South Carolina Coastal Plain, USA. Atmosphere, 2, 330-357. doi:10.3390/atmos20x000x
- Lu, J., Sun, G., McNulty, S.G. and Comerford, N. (2009) Sensitivity of pine flatwoods hydrology to climate change and forest management in Florida, USA. Wetlands, 29, 826-836. doi:10.1672/07-162.1
- Mulhouse, J.M., Steven, D.D., Lide, R.F. and Sharitz, R.R. (2005) Effects of dominant species on vegetation change in Carolina bay wetlands following a multi-year drought. The Journal of the Torrey Botanical Society, 132, 411-420. doi:10.3159/1095-5674(2005)132[411:EODSOV]2.0.CO;2
- Pielke, R.A., Landsea, C., Mayfield, M., Laver, J. and Pasch, R. (2005) Hurricanes and global warming. Bulletin of the American Meteorological Society, 86, 1571-1575. doi:10.1175/BAMS-86-11-1571
- Pezza, A.B. and Simmonds, I. (2005) The first South Atlantic hurricane: Unprecedented blocking, low shear and climate change. Geophysical Research Letters, 32, L15712. doi:10.1029/2005GL023390
- Trenberth, K. (2005) Uncertainty in hurricanes and global warming. Science, 308, 1753-1754. doi:10.1126/science.1112551
- Elsner, J.B. (2006) Evidence in support of the climate change—Atlantic hurricane hypothesis. Geophysical Research Letters, 33, L16705. doi:10.1029/2006GL026869
- Landsea, C.W., Harper, B.A., Hoarau, K. and Knaff, J.A. (2006) Can we detect trends in extreme tropical cyclones? Science, 313, 452-454. doi:10.1126/ science.1128448
- Hook, D.D., Buford, M.A. and Williams, T.M. (1991) Impact of Hurricane Hugo on the South Carolina coastal plain forest. Journal of Coastal Research, 8, 291-300.
- Sheikh, P.A. (2006) The impact of Hurricane Katrina on biological resources. http://assets.opencrs.com/rpts/RL33117_20051018.pdf
- Chapman, E.L., Chambers, J.Q., Ribbeck, K.F. and Baker, D.B. (2008) Hurricane Katrina impacts on forest of Louisiana’s Pearl River basin. Forest Ecology and Management, 256, 883-889. doi:10.1016/j.foreco.2008.05.057
- Oswalt, S.N. and Oswalt, C.M. (2008) Relationships between common forest metrics and realized impacts of Hurricane Katrina on forest resources in Mississippi. Forest Ecology and Management, 255, 1692-1700. doi:10.1016/j.foreco.2007.11.029
- Middleton, B.A. (2009) Effects of Hurricane Katrina on the forest structure of Taxodium Distichum swamps of the Gulf coast, USA. Wetlands, 29, 80-87. doi:10.1672/08-73.1
- Wang, Y.P. and Jarvis, P.G. (1990) Description and validation of an array model—MAESTRO. Agricultural and Forest Meteorology, 51, 257-280. doi:10.1016/0168-1923(90)90112-J
- Li, C., Aber, J., Stang, F., Butter-Bahl, K. and Papen, H. (2000) A process-oriented model of N2O and NO emissions from forest soils. 1. Model development. Journal of Geophysical Research: Atmospheres, 105, 4369-4384. doi:10.1029/1999JD900949
- Thornton, P.E., Law, B.E., Gholz, H.L., Clark, K.L., Falge, E., Ellsworth, D.S., Goldstein, D.S., Monson, R.K., Hollinger, D., Falk, M., Chen, J. and Sparks, J.P. (2002) Modeling and measuring the effects of disturbance history and climate on carbon and water budgets in evergreen needleleaf forests. Agricultural and Forest Meteorology, 113, 185-222. doi:10.1016/S0168-1923(02)00108-9
- Battaglia, M., Sands, P., White, D. and Mummery, D. (2004) CABALA: A linked carbon, water and nitrogen model of forest growth for silvicultural decision support. Forest Ecology and Management, 193, 251-282. doi:10.1016/j.foreco.2004.01.033
- Hanson, P.J., Amthor, J.S., Wullschleger, S.D., Wilson, K.B., Grant, R.F., Hartley, A., Hui, D., Hunt, E.R., Johnson Jr., D.W., Kimball, J.S., King, A.W., Lou, Y., McNulty, S.G., Sun, G., Thornton, P.E., Wang, S., Williams, M., Baldocchi, D.D. and Cushman, R.M. (2004) Oak forest carbon and water simulations: Model intercomparisons and evaluations against independent data. Ecological Monographs, 74, 443-489. doi:10.1890/03-4049
- Stange, F., Butterbachl, K., Papen, H., Zechmeister-Boltenstern, S., Li, C. and Aber, J. (2000) A process-oriented model of N2O and NO emissions from forest soils. Journal of Geophysical Research: Atmospheres, 105, 4385- 4398. doi:10.1029/1999JD900948
- Zhand, Y., Li, C., Trettin, C.C., Li, H. and Sun, G. (2002) An integrated model of soil, hydrology, and vegetation for carbon dynamics in wetland ecosystems. Global Biogeochemical Cycles, 16, 1-17. doi:10.1029/2001GB001838
- Li, C., Cui, J., Sun, G. and Trettin, C.C. (2004) Modeling impacts of management on carbon sequestration and trace gas emissions in forested wetland ecosystems. Environmental Management, 33, S176-S186. doi:10.1007/s00267-003-9128-z
- Kesik, M., Ambus, P., Baritz, R., Bruggemann, N., Butterbach-Bahl, K., Damm, M., Duyzer, J., Horvath, L., Kiese, R., Kitzler, B., Leip, A., Li, C., Pihlate, M., Pilegaard, K., Seufert, G., Simpson, D., Skiba, U., Smiatek, G., Vesala, T. and Zechmeister-Boltenstern, S. (2005) Inventories of N2O and NO emissions from European forest soils. Biogeosciences, 2, 353-375. doi:10.5194/bg-2-353-2005
- Kesik, M., Bruggemann, N., Forkel, R., Kiese, R., Knoche, R., Li, C., Seufert, G., Simpson, D. and Butterbach-Bahl, K. (2006) Future scenarios of N2O and NO emissions from European forest soils. Journal of Geophysical Research: Atmospheres, 111, G02018.
- Kurbatova, J., Li, C., Varlagin, A., Xiao, X. and Vygodskaya, N. (2008) Modeling carbon dynamics in two adjacent spruce forests with different soil conditions in Russia. Biogeosciences, 5, 969-980. doi:10.5194/bg-5-969-2008
- Dai, Z., Trettin, C.C., Li, C., Li, H., Sun, G. and Amatya, D.M. (2012) Effect of assessment scale on spatial and temporal variations in CH4, CO2 and N2O fluxes in a Forested Watershed. Water, Air, and Soil Pollution, 223, 253-265. doi:10.1007/s11270-011-0855-0
- Butterbach-Bahl, K., Stange, F. and Papen, H. (2001) Regional inventory of nitric oxide and nitrous oxide emissions for forest soils of southeast Germany using the biogeochemical model PnET-N-DNDC. Journal of Geophysical Research: Atmospheres, 106, 34155-34166. doi:10.1029/2000JD000173
- Cui, J., Li, C. and Trettin, C.C. (2005) Analyzing the ecosystem carbon and hydrologic characteristics of forested wetland using a biogeochemical process model. Global Change Biology, 11, 278-289. doi:10.1111/j.1365-2486.2005.00900.x
- Li, C. (2007) Quantifying greenhouse gas emissions from soils: Scientific basis and modeling approach. Soil Science and Plant Nutrition, 53, 344-352. doi:10.1111/j.1747-0765.2007.00133.x
- DHI (2005) DHI water and environment. Danish Hydraulic Institute, Denmark.
- Harder, S.V., Amayta, D.M., Callahan, T.J., Trettin, C.C. and Hakkila, J. (2007) Hydrology and Water Budget for a Forested Atlantic Coastal Plain Watershed, South Carolina. Journal of American Water Resources Association, 43, 563-575.
- Trettin, C.C., Amatya, D.M., Kaufman, C., Levine, N. and Morgan, R.T. (2008) Recognizing change in hydrologic functions and pathways due to historical agricultural use—Implications to hydrologic assessments and modeling. The 3rd Interagency Conference Research in the Watersheds, Estes Park, 8-11 September 2008, 1-5.
- Hook, D.D., Buford, M.A. and Williams, T.M. (1996) Impact of Hurricane Hugo on the South Carolina coastal plain forest. In: Haymond, J.L., Hook, D.D. and Harms W.R., Eds., Hurrican Hugo: South Carolina Forest Land Research and Management Related to the Storm, Southern Research Station, USDA Forest Service, Ashville, 540.
- Sun, G., Lu, J., Gartner, D., Miwa, M. and Trettin, C.C. (2000) Water bugets of two forested watersheds in South Carolina. In: Higgins, R.W., Ed., Proceedings of the Spring Special Conference, American Water Resources Association, Miami, 199-202.
- Federal Register (1994) Changes in hydric soils of the United States, July 13, 1994. https://www.federalregister.gov/articles/
- Federal Register (2002) Hydric soils of the United States, September 18, 2002. http://soildatamart.nrcs.usda.gov/
- Long, B.M. (1980) Soil survey of Berkeley County, South Carolina. United States Department of Agriculture, Washington DC.
- Fissore, C., Giardian, C.P., Kolka, R.K. and Trettin, C.C. (2009) Soil organic carbon quality in forested mineral wetlands at different mean annual temperature. Soil Biology & Biochemistry, 41, 458-466. doi:10.1016/j.soilbio.2008.11.004
- Soil Survey Staff (2011) Natural Resources Conservation Service, United States Department of Agriculture. Soil Survey Geographic (SSURGO) Database for Berkeley County, South Carolina. http://soildatamart.nrcs.usda.gov
- Nix, L.E., Hook, D.D., Williams, J.G. and Blaircom, D.V. (1996) Assessment of hurricane damage to the santee experimental forest and the Francis Marion National Forest with a geographic information system. In: Haymond, J.L., Hook, D.D. and Harms, W.R., Eds., Hurricane Hugo: South Carolina Forest Land Research and Management Related to the Storm, US Department of Agriculture, Asheville.
- Wilson, L., Amatya, D., Callahan, T. and Trettin C. (2006) Hurricane impact on stream flow and nutrient exports for a first-order forested watershed of the lower coastal plain, South Carolina. 2nd Interagency Conference on Research in the Watersheds, Otto, 16-18 May 2006, 169-179.
- Amatya, D.M. and Trettin, C.C. (2007) Development of watershed hydrologic research at Santee Experimental Forest, Coastal South Carolina. In: Furniss, M.J., Clifton, C.F. and Ronnenberg, K.L., Eds., Advancing the Fundamental Sciences: Proceedings of the Forest Service National Earth Sciences Conference, US Department of Agriculture, Forest Service, Pacific Northwest Research Station, San Diego.
- Amatya, D.M., Miwa, M., Harrison, C.A., Trettin, C.C. and Sun, G. (2006) Hydrology and water quality of two order forested watersheds in coastal South Carolina. In: Williams, T., Ed., Proceedings of the 2006 International Conference on Hydrology and Management of Forested Wetlands Conference, St. Joseph, 8-12 April 2006, 15-25.
- Sulzman, E.W., Brant, J.B., Bowden, R.D. and Lajtha, K. (2005) Contribution of aboveground litter, belowground litter, and rhizosphere respiration to total soil CO2 efflux in an old growth coniferous forest. Biogeochemistry, 73, 231-256. doi:10.1007/ s10533-004-7314-6
- Saucier, J.R. and Clark III, A. (1985) Tables for estimating total tree and product weight and volume of major southern tree species groups. Southwide Energy Committee, American Pulpwood Association Inc., Washington DC.
- Smith, J.E., Heath, L.S. and Jenkins, J.C. (2003) Forest volume-to-biomass models and estimates of mass for live and standing dead trees of US forests. US Department of Agriculture, Forest Service, Northeastern Research Station, Newtown Square.
- Schroth, G. (1995) Tree root characteristics as criteria for species selection and systems design in agroforestry. Agroforestry Systems, 30, 125-143. doi:10.1007/BF00708917
- IPCC (2003) Chapter 3. In: Penman, J., Gytarsky, M., Hiraishi, T., Krug, T., Kruger, D., Pipatti, R., Buendia, L., Miwa, K., Ngara, T., Tanabe, K. and Wagner, F., Eds., Good Practice Guidance for Land Use, Land-Use Change and Forestry, IPCC, Kanagawa, 3.1-3.150.
- Dai, Z., Li, C., Trettin, C.C., Sun, G., Amatya, D.D. and Li, H. (2010). Bi-criteria evaluation of the MIKE SHE model for a forested watershed on the South Carolina coastal plain. Hydrology and Earth System Sciences, 14, 1033-1046. doi:10.5194/hess-14-1033-2010
- Nash, J.E. and Sutcliffe, J.V. (1970) River flow forecasting through conceptual models part I: A discussion of principles. Journal of Hydrology, 10, 282-290. doi:10.1016/0022-1694(70)90255-6
- Hawley, N.R. (1949) The old rice plantation in and around the Santee Experimental Forest. Agricultural History, 23, 86-91.
- Omsby, T., Napoleon, E., Burke, R., Groessl, C. and Feaster, L. (2004) Getting to know ArcGIS desktop: The basics of ArcView, ArcEditor, and ArcInfo Updated for ArcGIS 9. ESRI Press, Redlands, 569.
- Dai, Z., Trettin, C.C., Li, C., Amatya, D.M., Sun, G. and Li, H. (2010) Sensitivity of stream flow and water table depth to potential climatic variability in a coastal forested watershed. Journal of American Water Resources Association, 46, 1036-1048. doi:10.1111/j.1752-1688.2010
- Moriasi, D., Arnold, J., Liew, M.W.V., Bingner, R., Harmmel, R. and Veith, T.L. (2007) Model evaluation guidelines for systematic quantification of accuracy in watershed simulations. American Society of Agricultural and Biological Engineers, 50, 885-899.
- Xu, M. and Qi, Y. (2001) Soil-surface CO2 eflux and its spatial and temporal variations in a young ponderosa pine plantation in northern California. Global Change Biology, 7, 667-677. doi:10.1046/j.1354-1013.2001.00435.x
- Miller, R.D. and Johnson, D.D. (2002) The effect of soil moisture tension on carbon dioxide evolution, nitrification, and nitrogen mineralization. Soil Science Society of America, 28, 644-647. doi:10.2136/sssaj1964.03615995002800050020x
- Ludovici, K.H., Zarnoch, S.J. and Richter, D.D. (2002) Modeling in-situ pine root decomposition using data from a 60-year chronosequence. Canadian Journal of Forest Research, 32, 1675-1684. doi:10.1139/x02-073