Natural Science
Vol.4 No.10(2012), Article ID:23960,6 pages DOI:10.4236/ns.2012.410106
Investigation of electronic structure of Nd2O3: Experiment and theory
![]()
1Department of Physics, College of Science, University of Tikreet, Tikreet, Iraq; *Corresponding Author: dr_Farid2006@yahoo.com
2Department of Physics, College of Science, University of Kirkuk, Kirkuk, Iraq; abdlhadik@yahoo.com
3Department of Physics, University College of Science, M. L. Sukhadia University, Udaipur, India; blahuja@yahoo.com
Received 3 June 2012; revised 10 July 2012; accepted 20 July 2012
Keywords: Electronic Structure; Nd2O3; Density Functional Theory; Gamma Ray; Fermi Level
ABSTRACT
In the present paper, first ever experimental Compton profile of Nd2O3 have been measured using 137Cs Compton spectrometer at an intermediate resolution of 0.34 a.u. Theoretical profile are computed using PP-DFT-GGA, PP-DFTLDA and PP-DFT-SOGGA within the frame work of LCAO scheme in, and are compared with experimental results. Theoretical anisotropies in directional Compton profiles are explained in term of degenerate states along the Fermi level.
1. INTRODUCTION
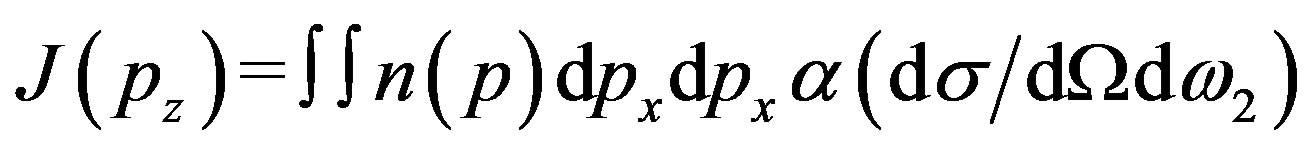
Compton scattering is a well known technique to scrutinize the electronic properties of materials [1-2]. In Compton scattering technique one measures the double differential scattering cross-section, which is directly proportional to the Compton profile of the material. The Compton profile (CP), J(pz), is the one dimensional projection of electron momentum density n(p) along the scattering vector and is given by.
 (1)
(1)
where pz is the component of electron momentum along the z-axis and ω2 is the energy of photon after scattering. Equation (1) is valid only within the impulse approximation (IA) [3]. According to IA interaction between photon and electron is so fast that electron does not have any chance to move in the potential well and hence to change its energy. Thus the moving and bound electron can be considered as a free and at rest.
Rare earth sesquioxides (Ln2O3, Ln = rare earth metal) are the typical compound of rare earth metals. In these compounds all the lanthanides are trivalent. Ln2O3 are wide band gap semiconductors. Due to the wide band gap they are technically very important materials [4]. Out of these compounds, Nd2O3 have attracted the several researchers due to its wide range of applications. Nd2O3 is used in ceramic capacitors, color TV tubes, high temperature glazes, coloring glass, carbon-arc-light electrodes and vacuum deposition. It is also used to dope glass, including sunglasses and in making solid-state lasers. Nd2O3 doped glass turns purple due to the absorbance of yellow and green light and is used in welding goggles. It is also used as a polymerisation catalyst. Nd2O3 crystallise in hexagonal structure with the space group P63/mmm [5] have determined the structural parameters of Nd2O3 and Nd2O2S from the refinement of neutron powder diffraction data at 4 K. They found that structures of Nd2O3 at 4 and 300 K are not significantly different. Band gap variation for the series of rare earth sesquioxides, sulphides and selenides are determined by [6]. A periodicity in the band gap variation for the Ln2O3 series has been observed by the authors [7] have measured the reflectivity spectra of Ln2O3 in the energy range from 0.5 to 50 eV at 300 K. They have also explained the electronic structure of these compounds from the reflectivity data. Structural properties of the Ln2O3 are reported by [8] using density functional theory (DFT). They have investigated the lattice parameters and Wyckoff positions of Ln2O3 compounds in hexagonal and cubic structures and have compared their results with the available data. [9] have studied the rare earth valencies in their dioxides and sesquioxides using the self interaction corrected local spin density approximation. Authors have calculated the energy band gap and optical properties of these compounds. Using the full potential linearised augmented plane wave method, [10] have investigated the electronic and optical properties of Ln2O3 (Ln = La, Pr, Nd). They have reported the energy bands, density of states and band gap in these compounds.
The main objectives of the present work were i) to measure the first ever isotropic CP of Nd2O3 using 661.65 keV  -radiations ii) to compute the theoretical CPs of Nd2O3 using the CRYSTAL09 code iii) to compute the anisotropies in theoretical CPs and analyse them in term of energy bands iv) to compute the electronic band, density of states (DOS) of Nd2O3, and v) to deduce the band gap in Nd2O3 and to compare it with the available data. Due to the non-availability of the large size (diameter 13 mm and thickness 3 mm) single crystal of Nd2O3 we have measured the isotropic Compton profile of Nd2O3.
2. EXPERIMENT
To measure the Compton profile of Nd2O3, we have used our 20Ci137Cs Compton spectrometer [11]. In the present experiment  -radiations of energy 661.65 keV were made to incident on the sample. Pellet of Nd2O3 (purity 99.9% +) of diameter 26 mm and thickness 3.3 mm was used as the target. The scattered radiations at an angle of 160 ± 0.6˚ were detected using high purity germanium (HPGe) detector (Canberra made, model GL 0510P) and the associated electronic like, pre-amplifier, amplifier, multi channel analyser, analog to digital convertor, etc. The data were accumulated for the 260 h to get a total intensity of 1.5 × 10⁷ counts at the Compton peak. To extract the true CP from the raw data, data were corrected for a series of several corrections namely, background, instrumental resolution, Compton scattering crosssection, multiple scattering correction, etc using the code prescribe by Warwick group [12,13]. For background correction, background was separately measured for 4 days after removing the sample from the sample holder. Finally data were normalized on the free atom [14] area viz. 57.81 e–. The stability of the system was check time to time using two weak sources 57Co and 133Ba.
3. COMPUTATIONAL DETAILS
To interpret our experimental CPs, we have computed theoretical CPs, energy bands and DOS of Nd2O3 using CRYSTAL09 [15,16] code of Torino group. It is worth mentioning that the CRYSTAL09 package includes various DFT schemes like local density approximation (LDA), generalised gradient approximation (GGA) and second order generalised gradient approximation (SOGGA). In this code, the one electron crystalline orbitals are the linear combination of Bloch functions given as
 (2)
(2)
The Bloch functions, which are the solutions of one electron equations, are built from local atom by the linear combination of nG individual Gaussian-type functions.
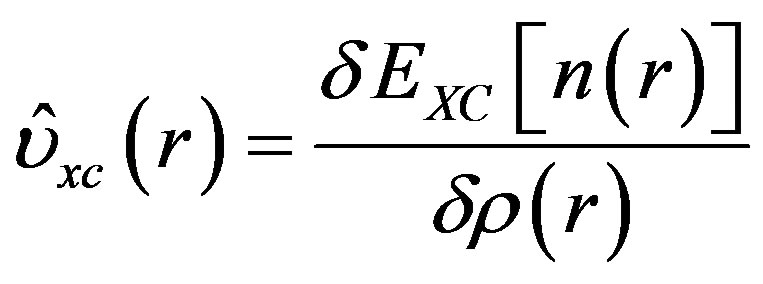
In the DFT scheme, the one particle Hamiltonian operator involves exchange and correlation potential operator  which is defined as,
 (3)
(3)
here EXC is the exchange-correlation density functional energy and ρ is the electronic density at a point r.
In LDA, the exchange-correlation energy of an electronic system is constructed by assuming that the exchange-correlation energy per electron at a point r in the electron gas, is equal to the exchange-correlation energy per electron in a homogenous electron gas that has the same electron density at the point r. It follows that
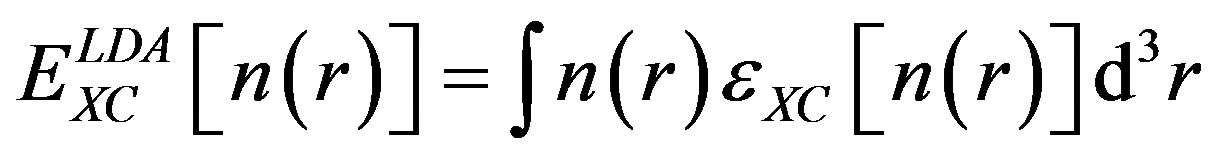 (4)
(4)
In the GGA, the appropriate exchange energy form for slowly varying densities is
 (5)
(5)
where the variable s is the reduced density gradient, given by the formula
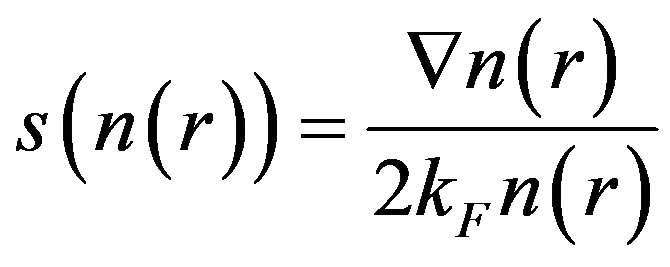
![]() (6)
(6)
and kF is defined by
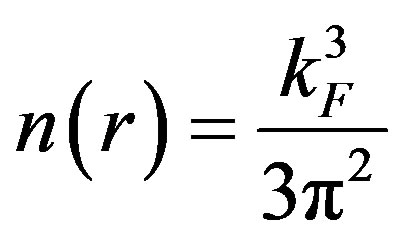
The functional  present in Equation (5), is the exchange enhancement function of the GGA and in the case of PBE it is given by
 (7)
(7)
where the constants are 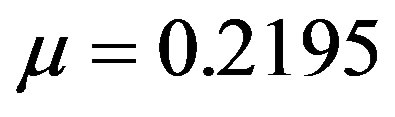 and
and 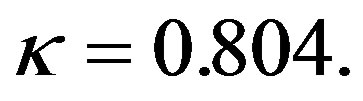
In the case of SOGGA, exchange enhancement factor is taken as equal mixing (50% each) of the PBE [17] and revised PBE (RPBE) [18] exchange functional. Mathematically,
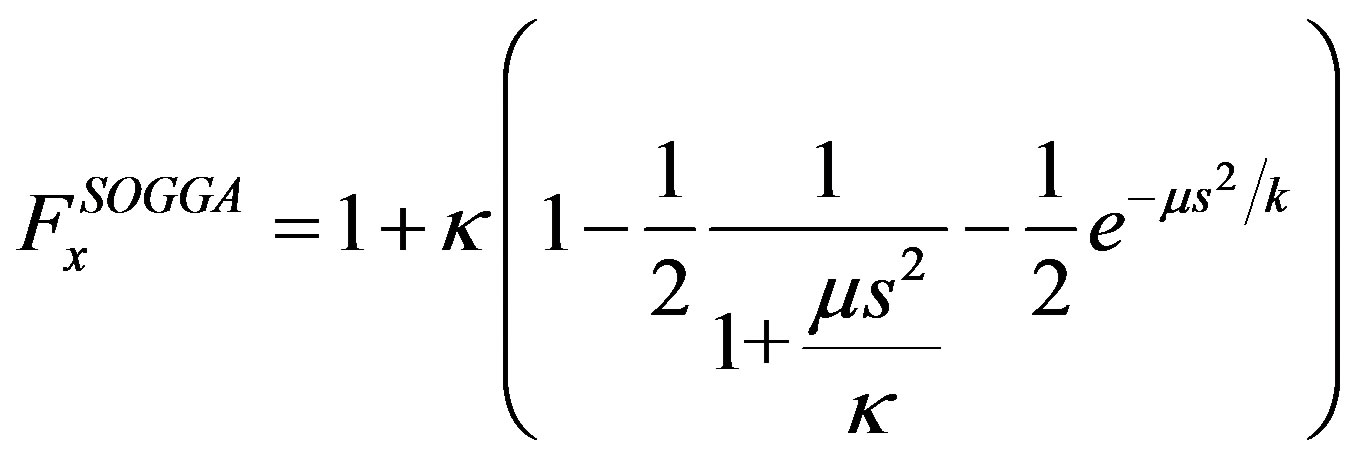 (8)
(8)
The parameters μ and κ are redefined as μ =μGE = 0.552 and 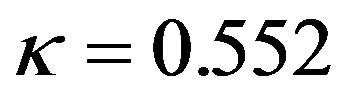 using Lieb-Oxford bound [19].
In the present computation we have taken exchange of Dirac-Slater [20] for LDA and Wu-Cohen [21] for GGA computations, whereas correlation function of PBE[17] has been used for LDA, GGA and SOGGA. Due to the non-availability of all electron basis sets of Nd, we have used the pseudopotential (PP) basis sets from the website http://www.theochem.uni-stuttgrat.de [22,23] while all electrons Gaussian basis sets for O were taken from www.tcm.phy.cam.ac.uk/~mdt26/basis_sets. The energy optimization of the basis sets was undertaken using the Billy software [15]. The lattice parameters and Wyckoff positions in the present computations are taken from the earlier reported data of [10]. The tolerance on the totalenergy convergence in the iterative solution of the Kohn-Sham equations is set to 10–6 Hartree. BRODYEN scheme [24] was used to achieve the fast convergence.
4. RESULTS AND DISCUSSIONS
4.1. Energy Bands and Density of States
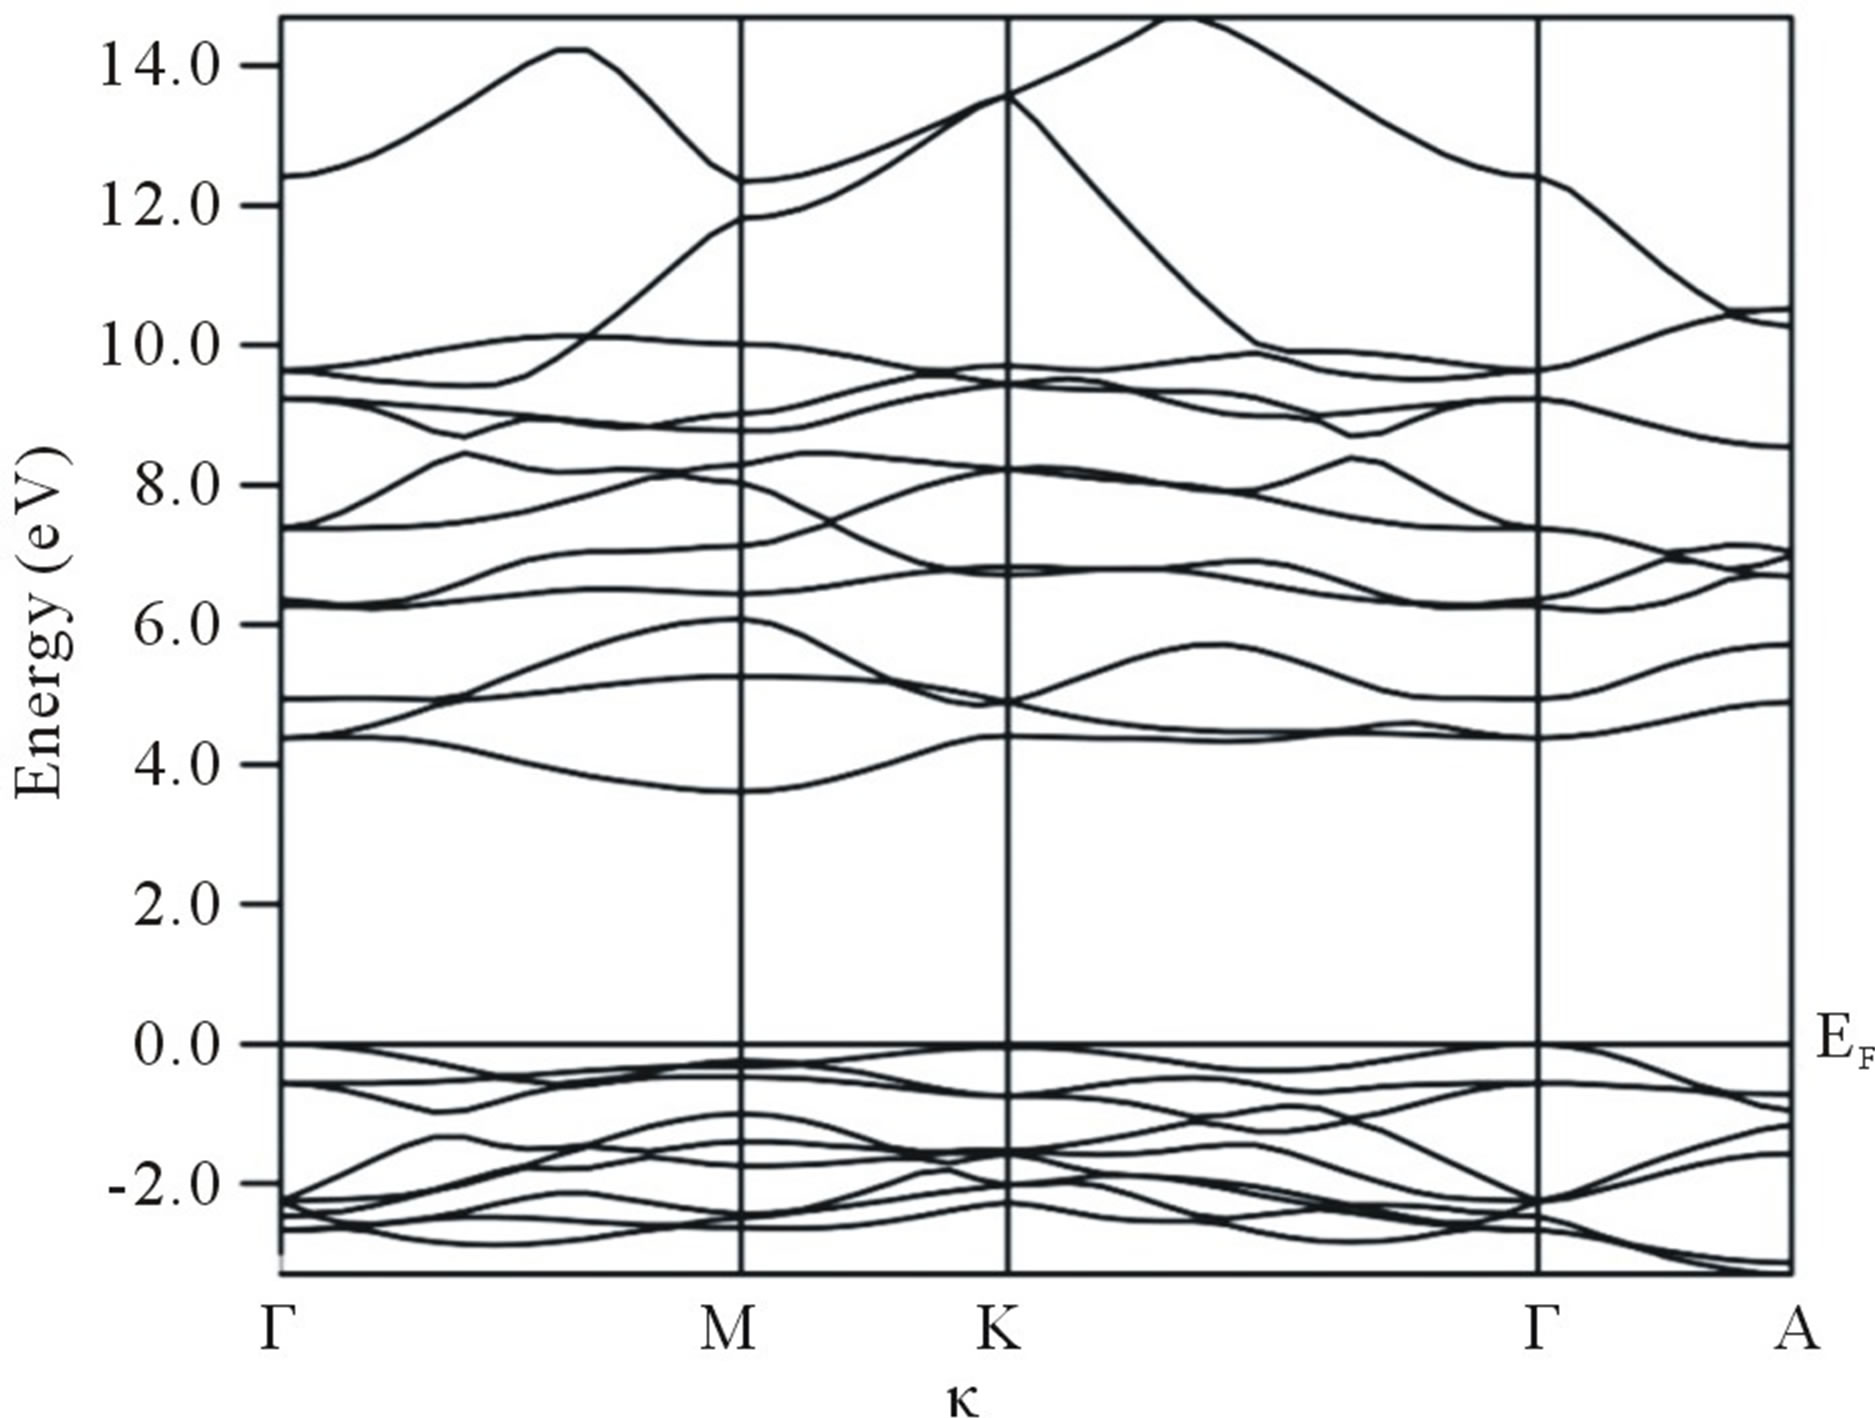
In Figures 1(a) and (b) energy bands and total and partial DOS of Nd2O3, using PP-DFT-GGA, are presented.
 (a)
(a)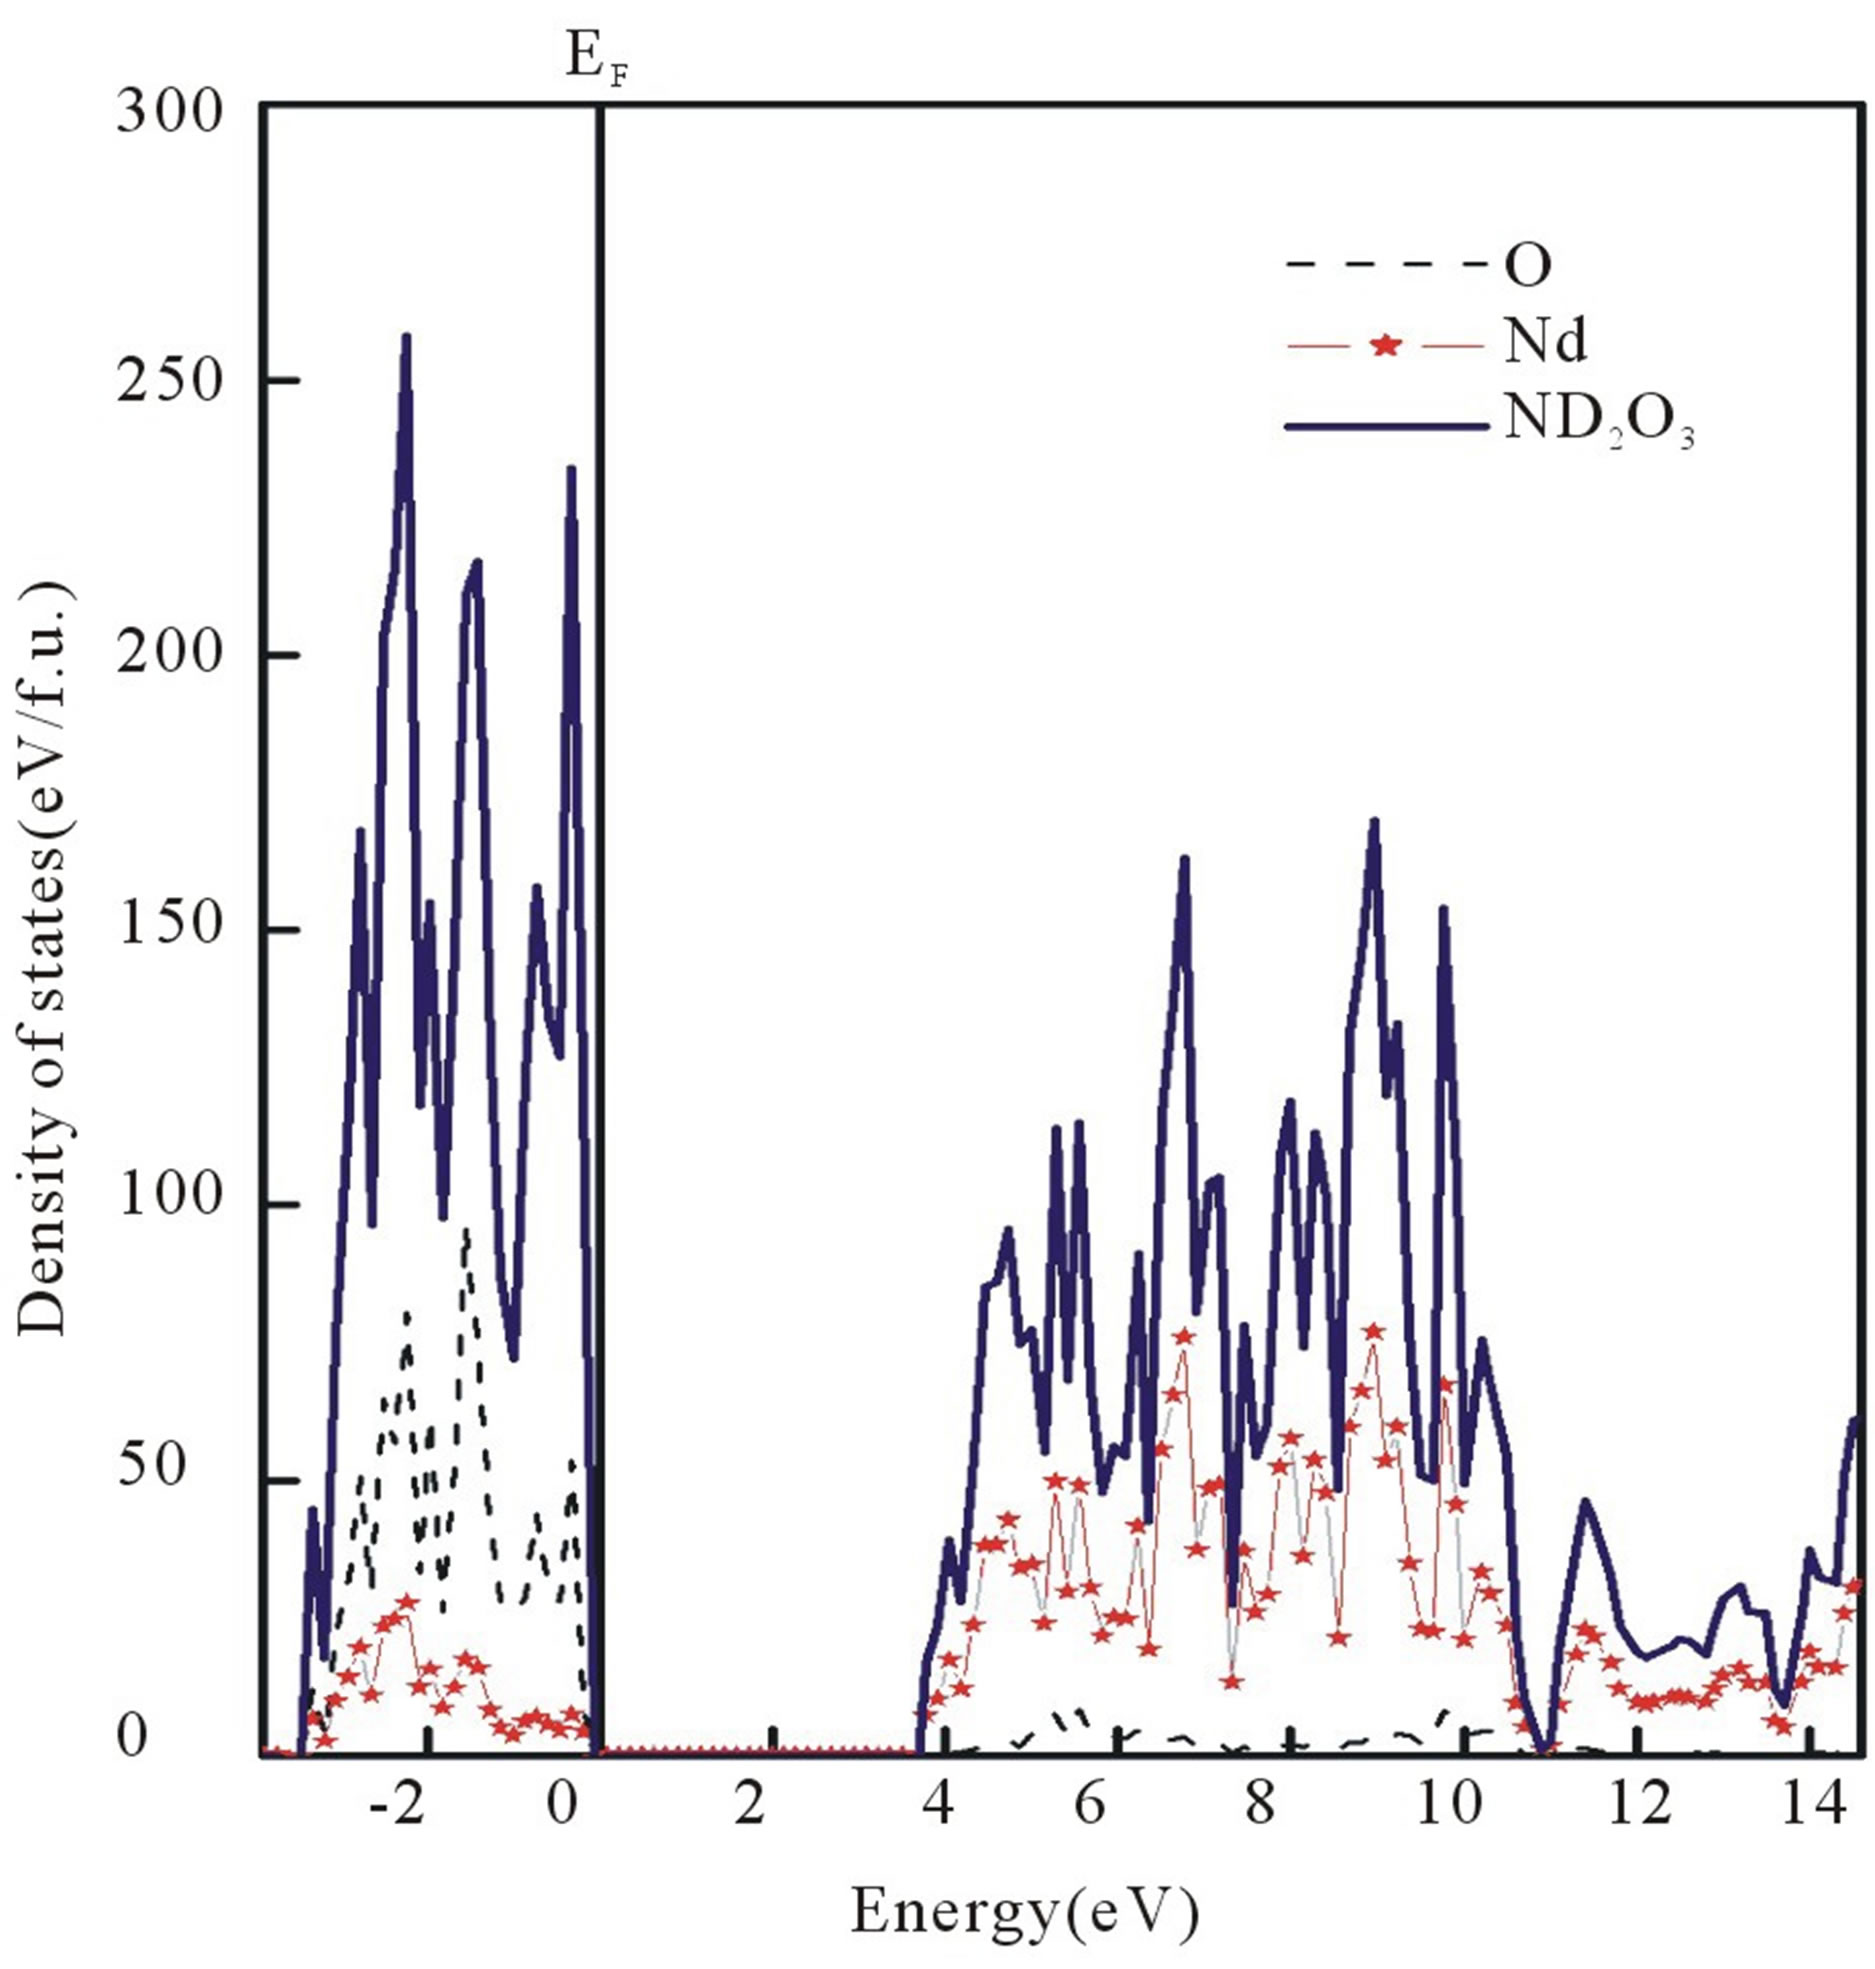 (b)
(b)
Figure 1. (a) Energy bands (E-k relation) for Nd2O3 along the high symmetry directions of the first Brillion zone, computed from PP-DFT-GGA approach; (b) Total and partial density of states for Nd2O3.
Overall shapes of energy bands computed using PP-DFTLDA/SOGGA are same as in PP-DFT-GGA, therefore we have not shown the bands and DOS of PP-DFTLDA/SOGGA scheme. Except some fine structures, our energy bands and DOS are seen to be in good agreement with the earlier reported data [9,10]. Our data also confirm the indirect band gap in Nd2O3. Some silent features of energy bands and density of states are as follows:
Energy bands of Nd2O3 can be divided into two parts. The energy bands below the Fermi energy (EF) are denser to that of present above the EF. The energy bands below the Fermi level are mainly due to the O atom. A small contribution of Nd is also visible. While the energy bands above this level are mainly originated by the Nd atom.
The contribution of O atom above the EF is almost negligible. This can also be seen from the DOS of Nd2O3. In the energy bands an indirect band gap between the Γ-K points is observed.
The band gap from the PP-DFT-GGA comes out to be 3.57 eV. In Table 1, we present the energy band gap in Nd2O3 from the different schemes used in the present work. The band gap reported by the other workers is also presented in table. Our theoretical band gap is smaller as compared to the experimental one reported in [6] but is close to the other reported theoretical results.
4.2. Compton Profiles
In Figure 2 we present the difference between the experimental and convoluted theoretical CPs of Nd2O3. All the isotropic theoretical profiles were convoluted at 0.34 a.u., to incorporate the effect of instrumental resolution in theoretical profiles. In Table 2, we have given the experimental and unconvoluted theoretical CPs for Nd2O3. At higher momentum side differences between experimental and theoretical profiles are negligible, owing to
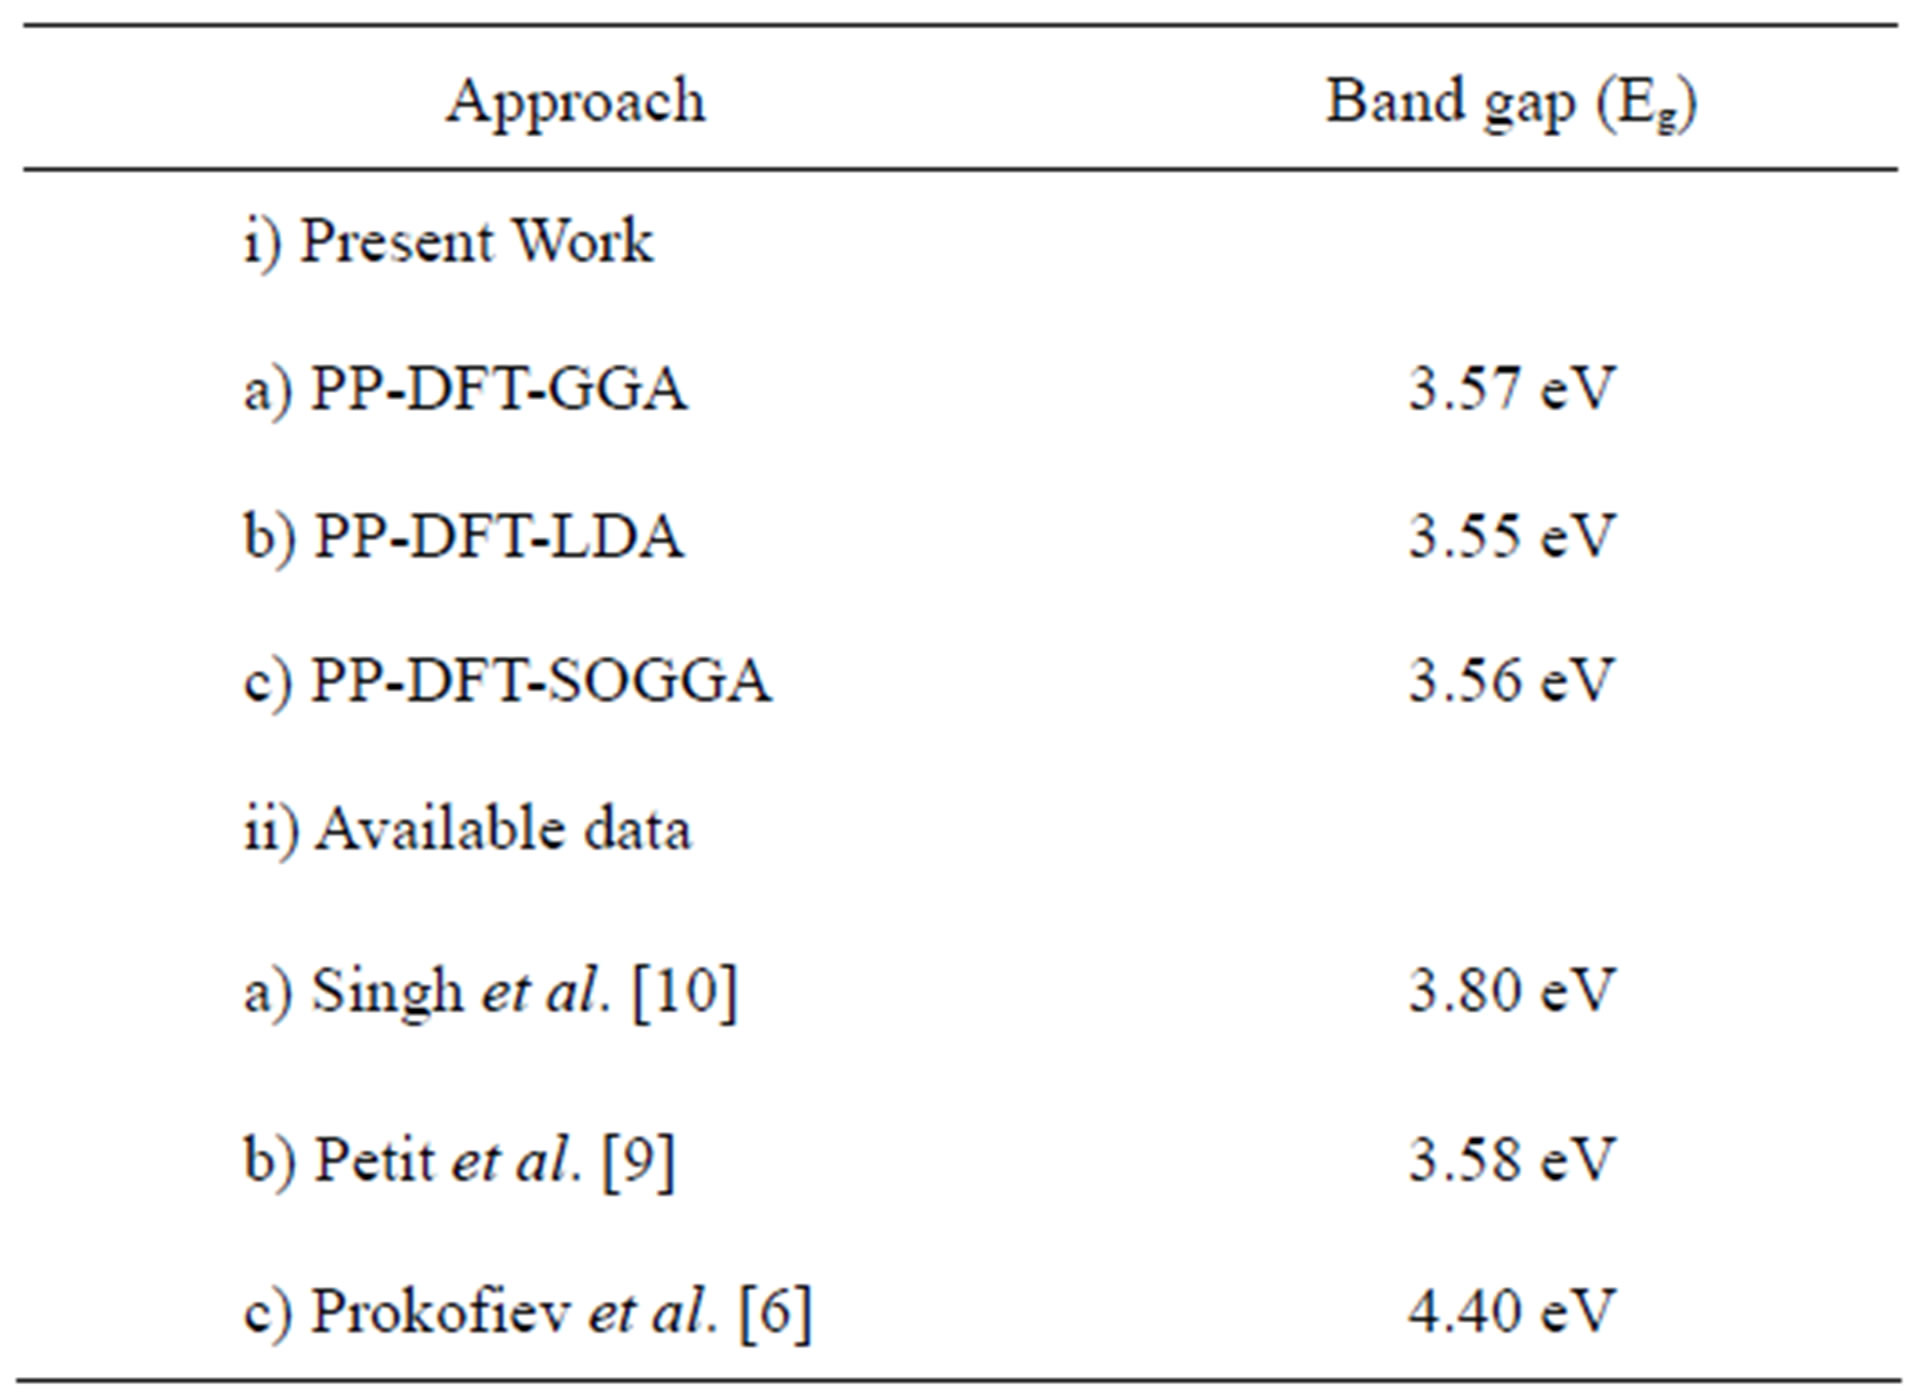
Table 1. Energy band gap (Eg in eV) for Nd2O3 calculated using the various first princile methods along with the available data.
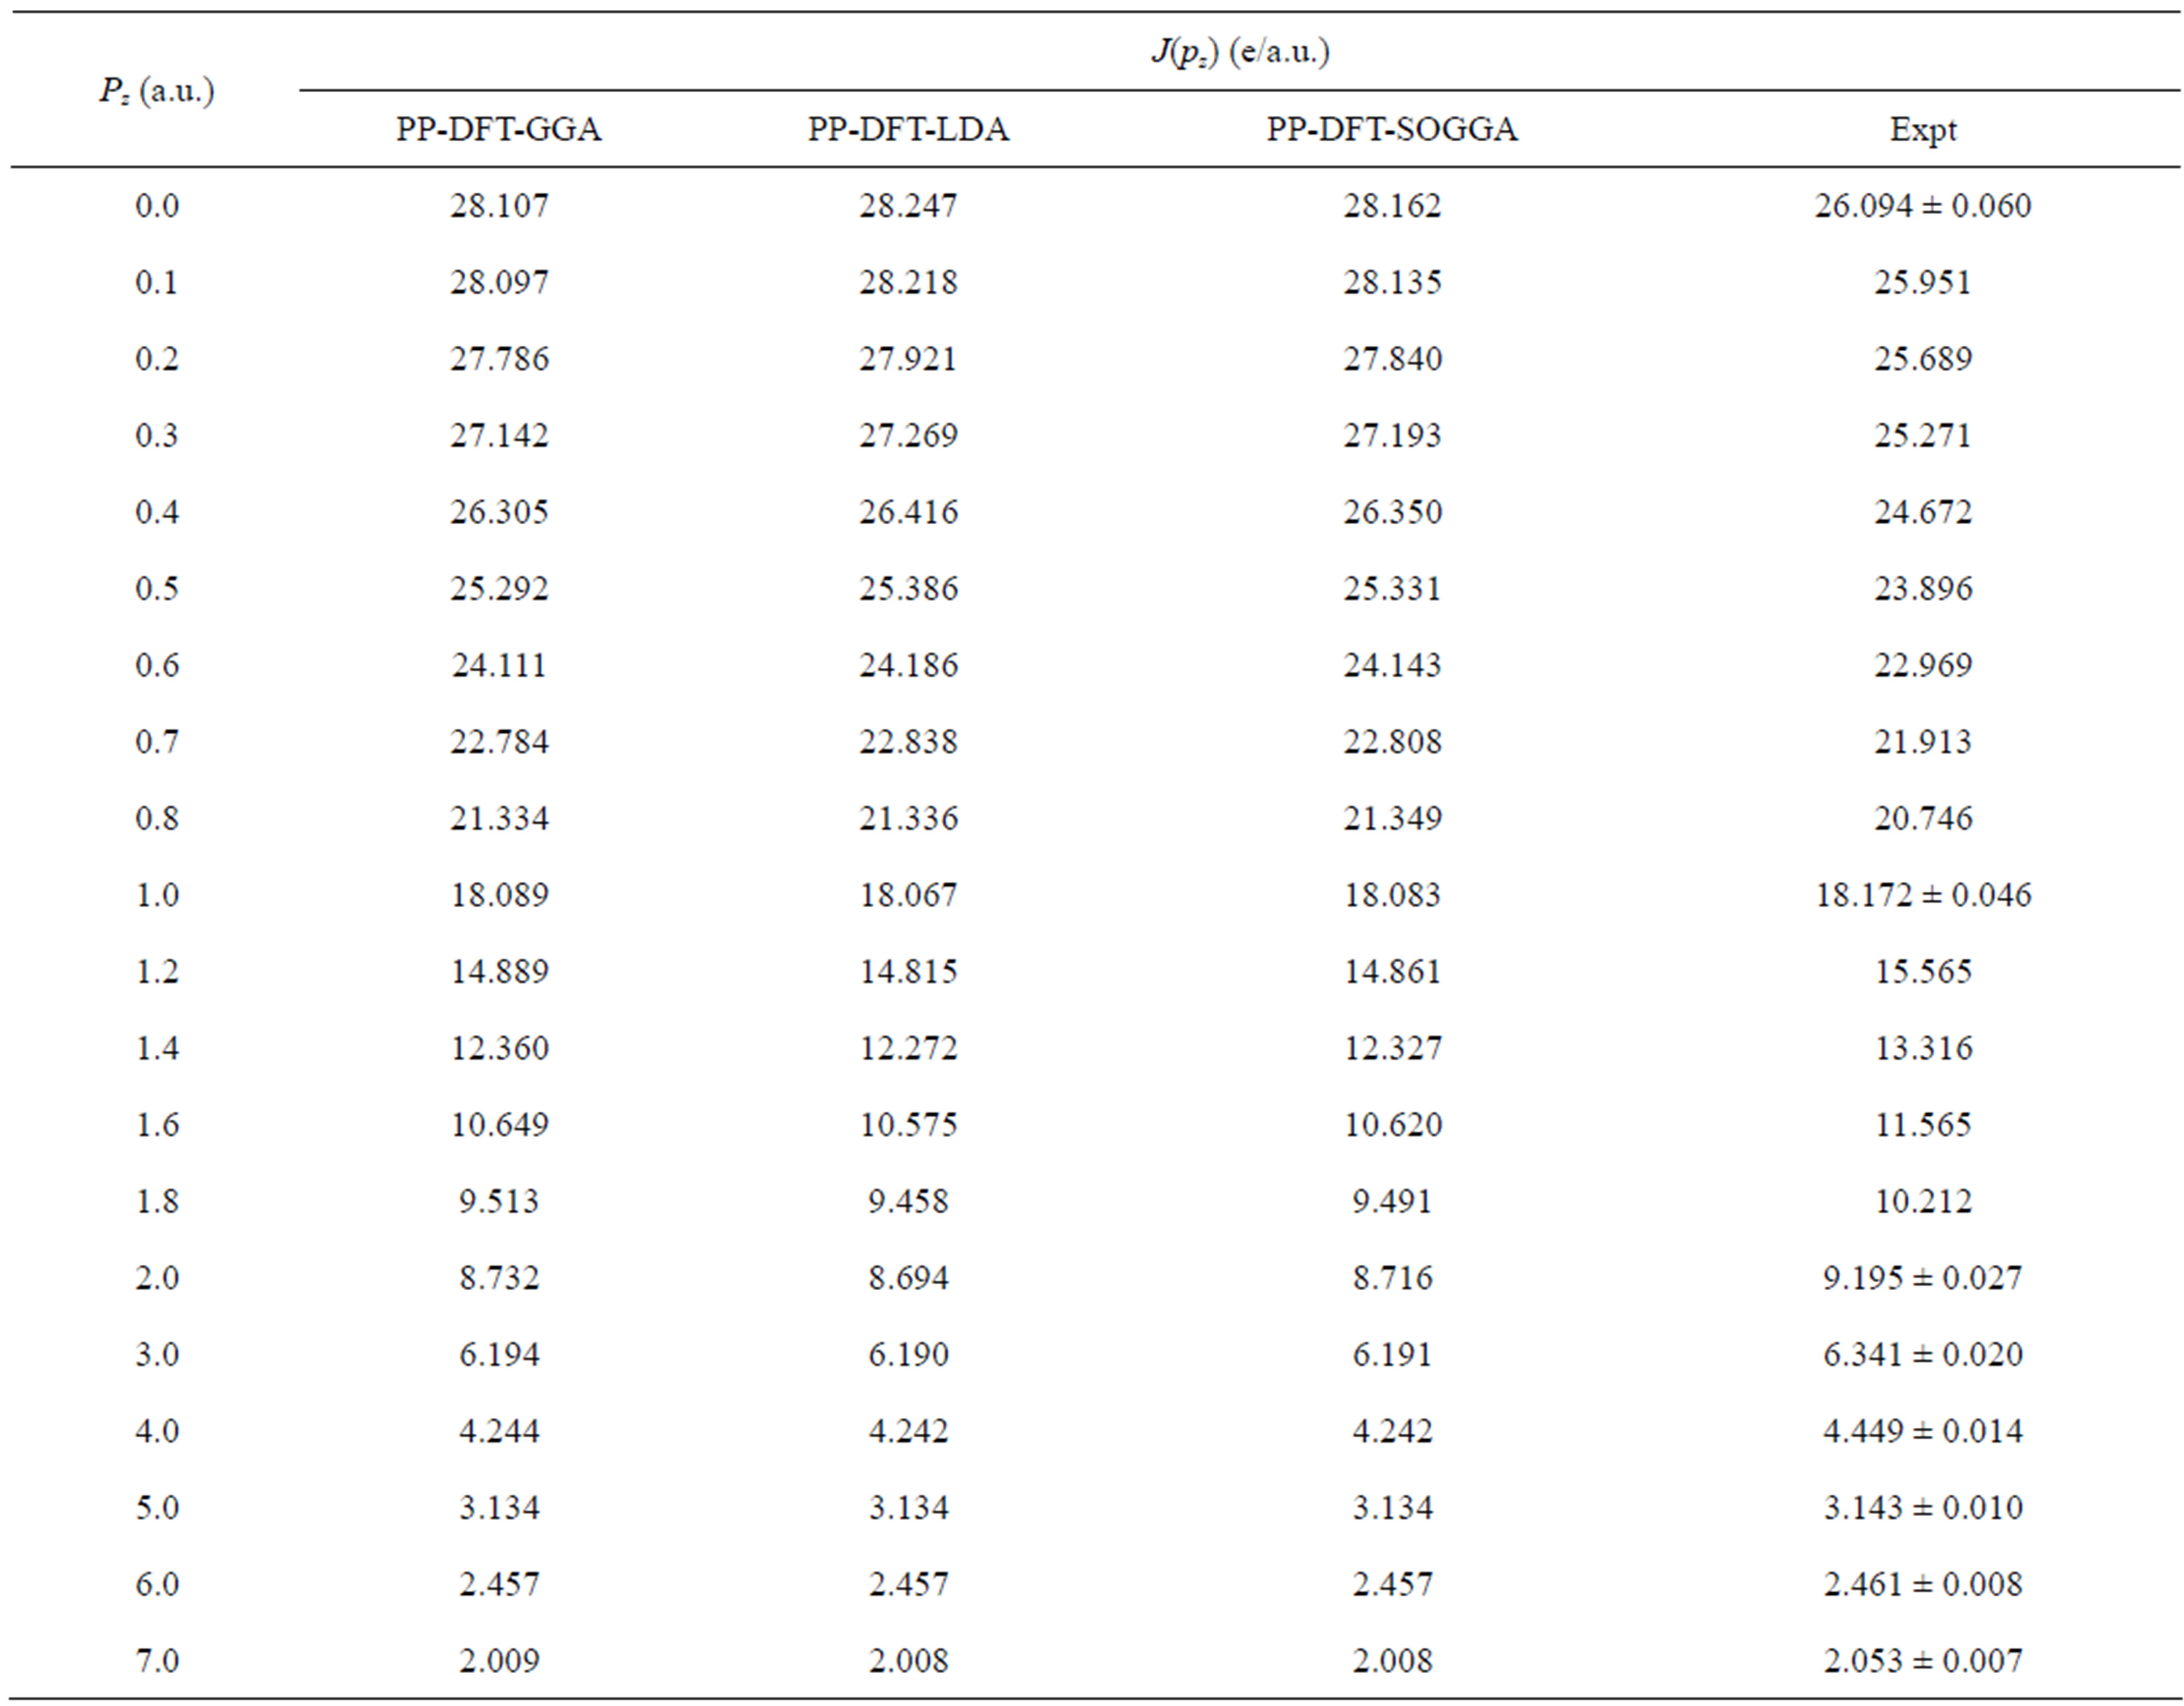
Table 2. Isotropic theoretical (unconvoluted) Compton profiles of Nd2O3 deduced from the PP-DFT-LDA, PP-DFT-GGA and PP-DFT-SOGGA schemes. The values of experimental Compton profiles are also given in the last column. Statistical error (±σ) is shown at a few experimental points.
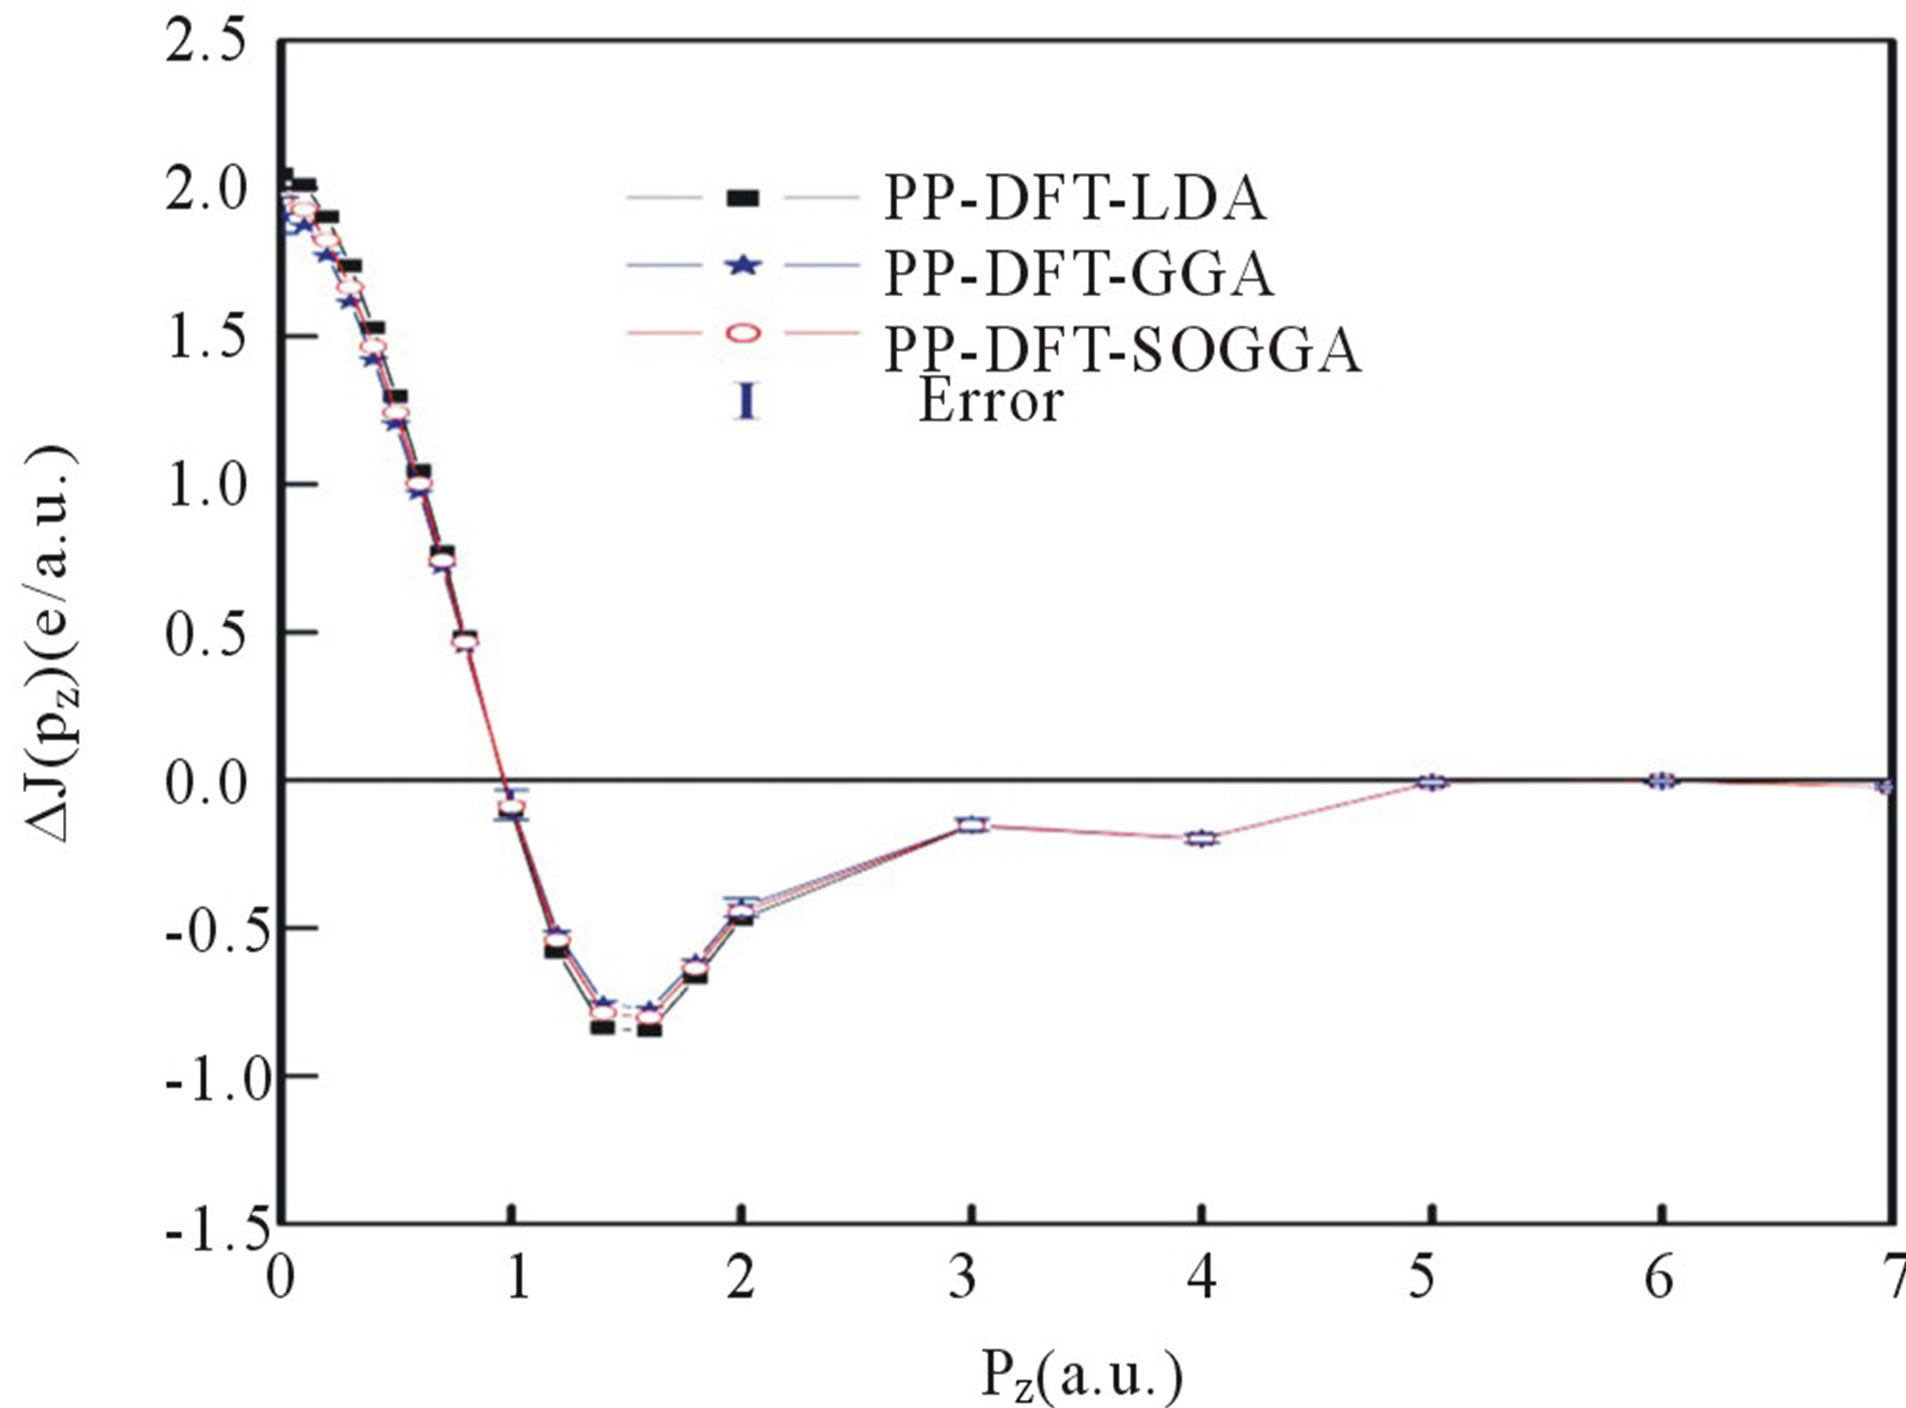
Figure 2. (Color online) Difference between the isotropic experimental and convoluted theoretical Compton profiles deduced from PP-DFT-LDA, PP-DFT-GGA and PP-DFTSOGGA approaches. Experimental errors (±σ) are within the size of the symbols used.
the fact that on higher momentum side CPs are govern by the core electrons (which are well defined by the free atom wave functions) of material or the contribution of valence electrons is very small.
The directional differences in momentum densities using PP-DFT-GGA, PP-DFT-LDA and PP-DFT-SOGGA for Nd2O3 are shown in Figure 3. The anisotropies in the directional Compton profiles depict characteristic oscillations, which are governed by the energy bands A general trend of oscillations in the directional differences J10.0 − J11.0, J11.0 − J00.1 and J00.1 − J10.0 is almost similar, except some fine structures in low momentum region. The anisotropies above the pz = 3 a.u. are hardly visible. It is also seen that the anisotropies in momentum densities derived from different approximations are almost same. Now we will explain the trend of oscillations in anisotropies in term of degenerate states along the EF. For example anisotropies in J10.0 − J11.0 direction can be explained on the basis of degenerate states in Γ-M [100]
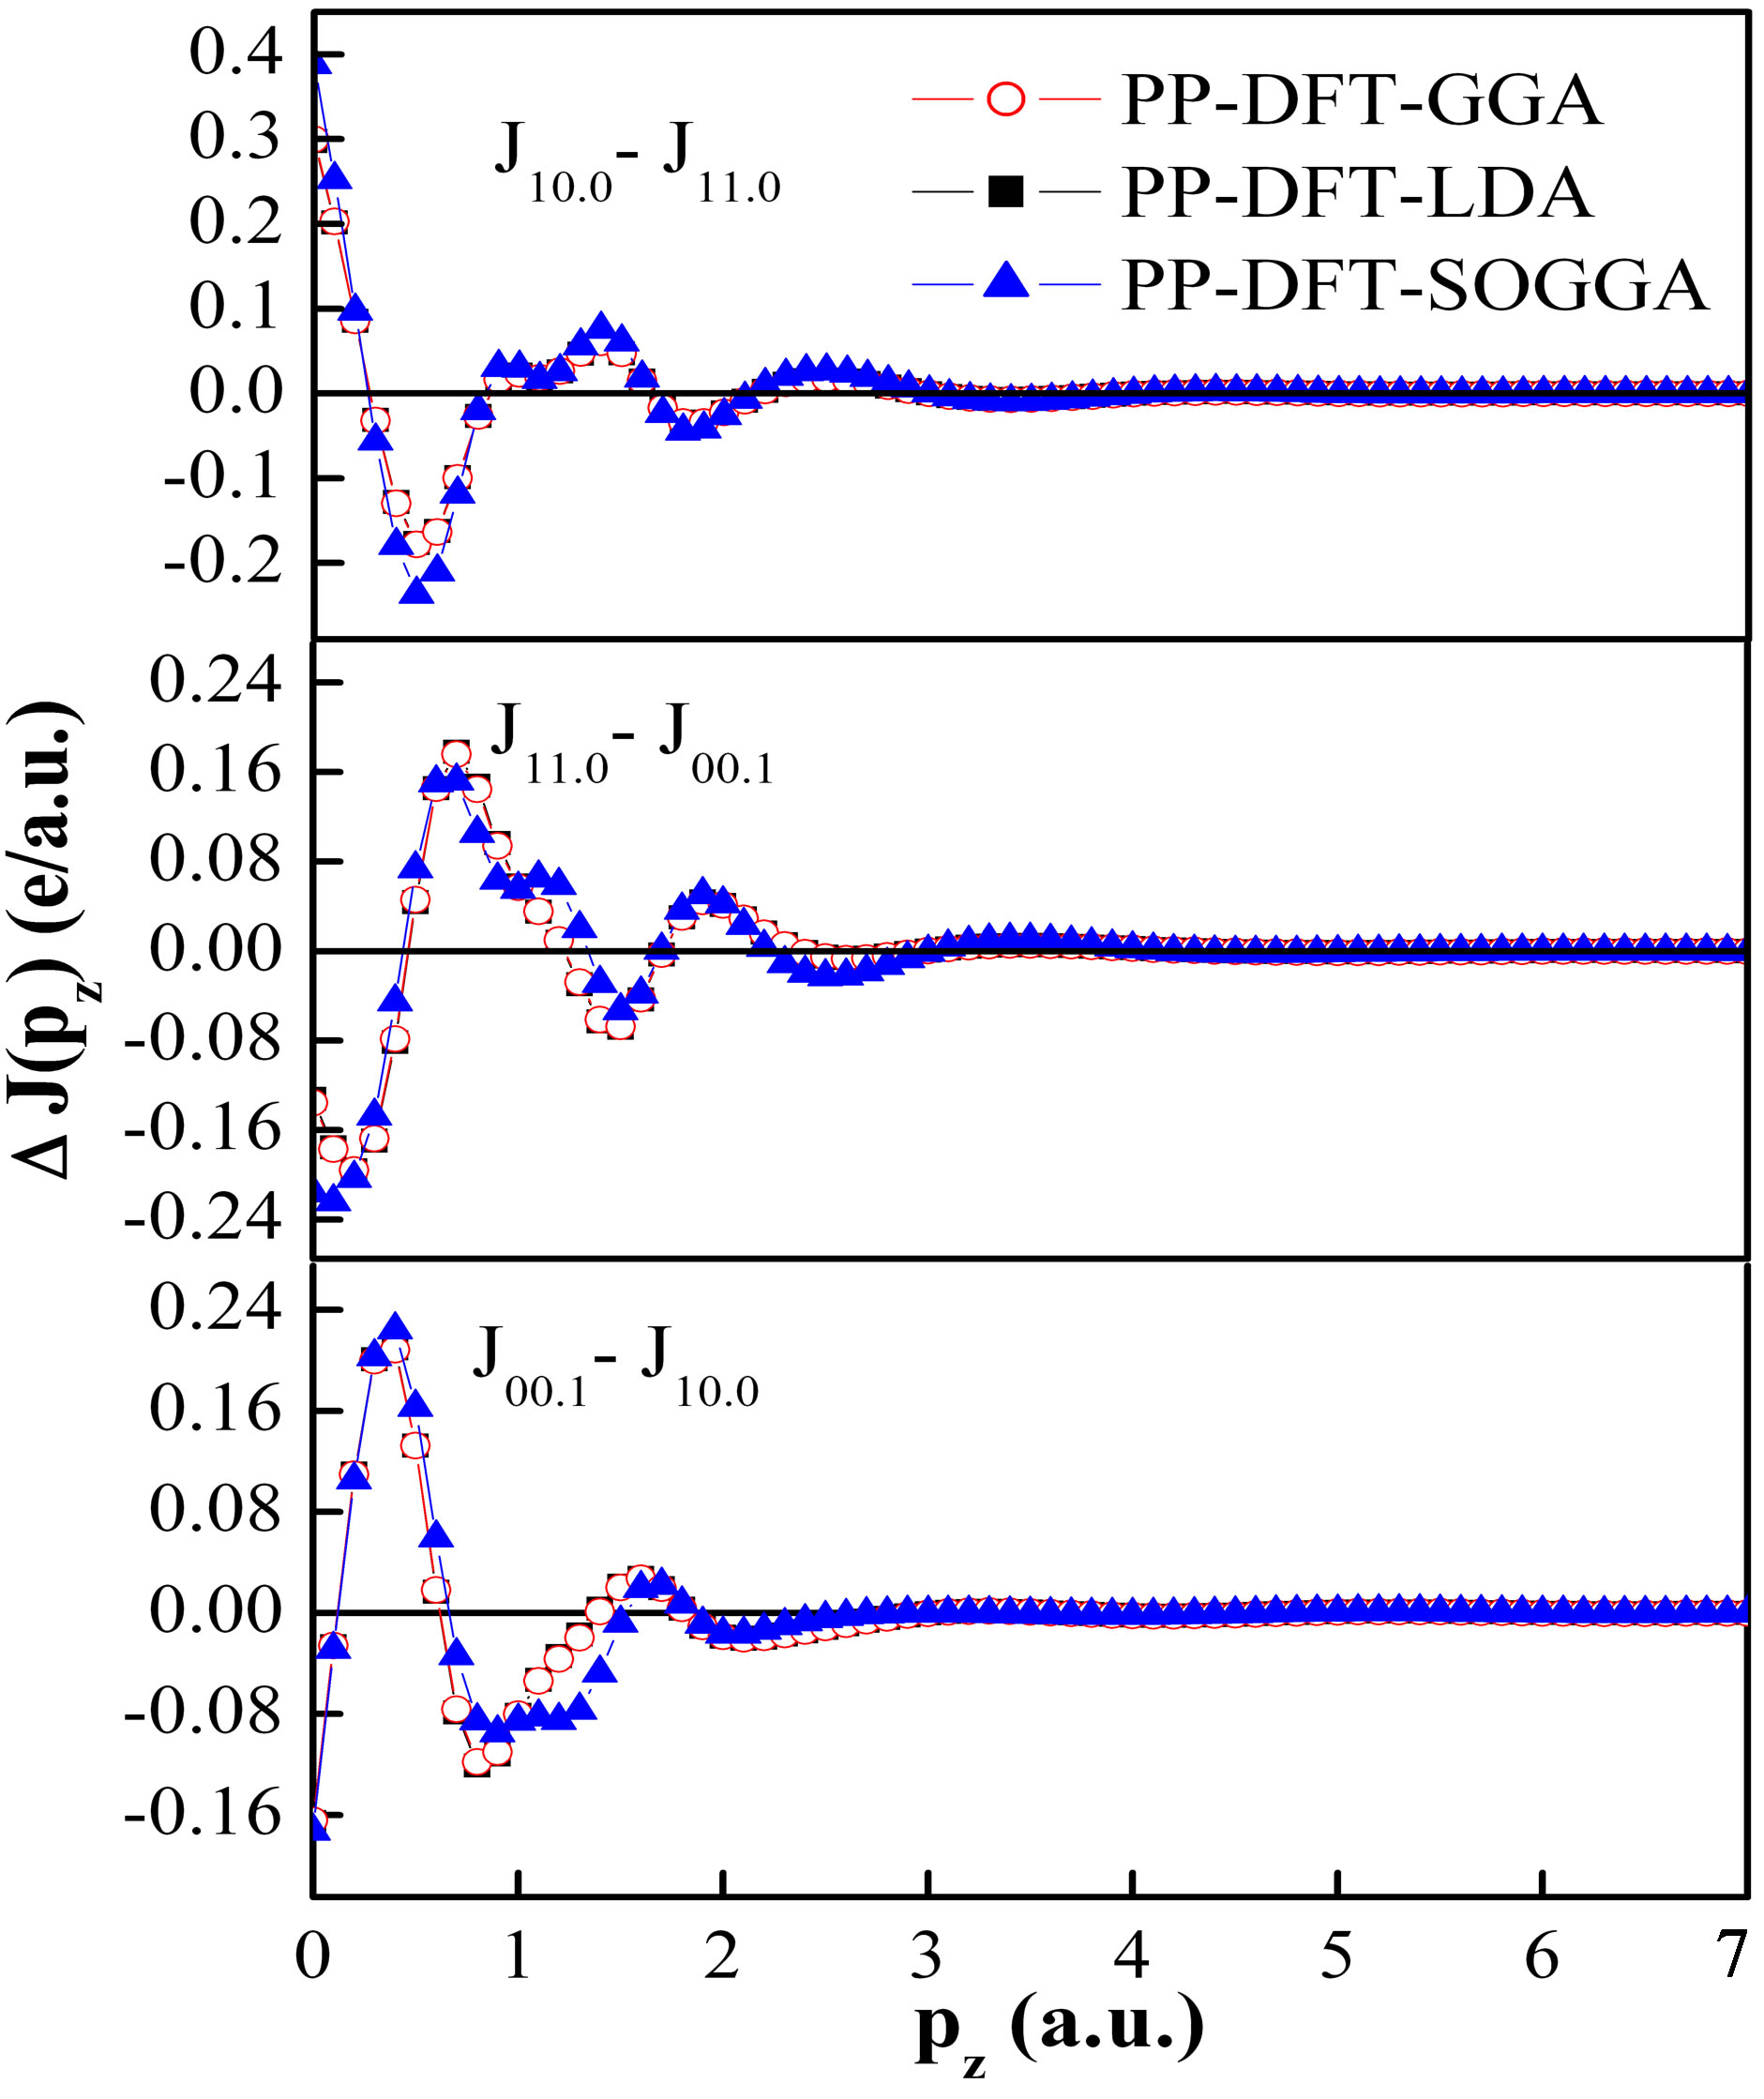
Figure 3. (Color online) Anisotropy in the convoluted theoretical Compton profiles of Nd2O3 calculated using different density functional schemes within the effective pseudo-core potential. Since the statistical error ±σ is within the size of symbols used, it is not clearly visible. The solid lines are drawn to guide the eyes.
and Γ-K [110] branches. In Γ-M [100] branch more degenerate states at Γ point are responsible for higher momentum densities in Γ-M branch as compared to Γ-K branch. This leads to positive amplitude of J10.0 − J11.0 in the low momentum region. In the similar way, we can also explain the other positive and negative anisotropies in different directions.
5. CONCLUSIONS
In the present paper, first ever experimental Compton profile of Nd2O3 have been measured using 137Cs Compton spectrometer at an intermediate resolution of 0.34 a.u. Experimental Compton profiles are compared with theoretical profiles. Theoretical profiles are computed using PP-DFT-GGA, PP-DFT-LDA and PP-DFT-SOGGA with in the frame work of LCAO scheme. Electronic bands, density of states of Nd2O3 are also presented using DFT-GGA. We have calculated the energy band gap in Nd2O3 and compared our data with the earlier reported data. Theoretical anisotropies in directional Compton profiles are explained in term of degenerate states along the Fermi level.
Finally, in consider of advantages and disadvantages of these three methods, we used an LCAO calculation that contains three methods, therefore we choose the best one of these methods which is closer to the practical result.
6. ACKNOWLEDGEMENTS
The authors are thankful to the group of Prof. R Dovesi for providing the CRYSTAL09 code. This work is supported by.
REFERENCES
- Cooper, M.J. (1985) Compton scattering and electron momentum determination. Reports on Progress in Physics, 48, 415. doi:10.1088/0034-4885/48/4/001
- Cooper, M.J., Mijnarends, P.E., Shiotani, N., Sakai, N. and Bansil, A. (2004) X-ray Compton scattering. Oxford University Press, New York. doi:10.1093/acprof:oso/9780198501688.001.0001
- Kaplan, I.G, Barbiellini, B. and Bansil, A. (2003) Compton scattering beyond the impulse approximation. Physical Review B, 68, 235104. doi:10.1103/PhysRevB.68.235104
- Zhang, F.X., Lang, M., Wang, J.W., Becker, U. and Ewing, R.C. (2008) Structural phase transitions of cubic Gd2O3 at high pressures. Physical Review B, 78, 064114. doi:10.1103/PhysRevB.78.064114
- Faucher, M., Pannetier, J., Charreire, Y. and Caro, P. (1982) Refinement of the Nd2O3 and Nd2O2S structures at 4 K. Acta Crystallographica Section B, 38, 344. doi:10.1107/S056774088200288X
- Prokofiev, A.V., Shelykh, A.I. and Melekh, B.T. (1996) Periodicity in the band gap variation of Ln2X3 (X = O, S, Se) in the lanthanides series. Journal of Alloys and Compounds, 242, 41. doi:10.1016/0925-8388(96)02293-1
- Kimura, S., Arai, F. and Ikezawa, M., (2000) Optical study and electronic structure of rare earth sesquixoides. Journal of the Physical Society of Japan, 69, 3451. doi:10.1143/JPSJ.69.3451
- Hirosaki, N., Ogata, S. and Kocer, C. (2003) Ab intio calculation of the crystal structure of the lanthanide Ln2O3 sesquioxides. Journal of Alloys and Compounds, 351, 31. doi:10.1016/S0925-8388(02)01043-5
- Petit, L., Svane, A., Szotek, Z. and Temmerman, W.M. (2005) First principle study of rare earth oxides. Physical Review B, 72, 205118. doi:10.1103/PhysRevB.72.205118
- Singh, N., Saini, S.M., Nautiyal, T. and Auluck, S. (2006) Electronic structure and optical properties of rare earth sesquioxides (R2O3, R = La, Pr and Nd). Journal of Applied Physics, 100, 083525. doi:10.1063/1.2353267
- Ahuja, B.L., Sharma, M. and Mathur, S. (2006) Anisotropy in the momentum density of tantalum. Nuclear Instruments and Methods in Physics Research Section B, 244, 419. doi:10.1016/j.nimb.2005.10.011
- Timms, D.N. (1989) Ph.D. Thesis, University of Warwick, England.
- Felsteiner, J., Pattison, P. and Cooper, M.J. (1974) Effect of multiple scattering on experimental Compton profiles: A Monte Carlo calculation. Philosophical Magazine, 30, 537. doi:10.1080/14786439808206579
- Biggs, F., Mendelsohn, L.B. and Mann, J.B. (1975) Hartree—Fock Compton profiles. Atomic Data and Nuclear Data Tables, 16, 201. doi:10.1016/0092-640X(75)90030-3
- Dovesi, R., Saunders, V.R., Roetti, C., Orlando, R., Zicovich-Wilson, C.M., Pascale, F., Civalleri, B., Doll, K., Harrison, N.M., Bush, I.J., D’Arco, Ph. and Llunell, M., (2009) CRYSTAL09 user’s manual, University of Torino, Torino.
- Dovesi, R., Orlando, R., Civalleri, B., Roetti, C., Saunders, V.R. and Zicovich-Wilson, C.M. (2005) CRYSTAL: A computational tool for the ab-initio study of the electronic properties of crystals. Zeitschrift für Kristallographie, 220, 571. doi:10.1524/zkri.220.5.571.65065
- Perdew, J.P., Burke, K. and Ernzerhof, M. (1996) Generalised gradient approximation made simple. Physical Review Letters, 77, 3865. doi:10.1103/PhysRevLett.77.3865
- Hammer, B., Hansen, L.B. and Norskov, J.K. (1999) Improved adsorption energetics within density-functional theory using revised Perdew-Burke-Ernzerhof functionals. Physical Review Letters, 59, 7413.
- Zhao, Y. and Truhlar, D.G. (2008) Construction of a generalized gradient approximation by restoring thedensity-gradient expansion and enforcing a tight Lieb-Oxford bound. The Journal of Physical Chemistry B, 128, 184109. doi:10.1063/1.2912068
- Towler, M.D., Zupan, A. and Causa, M. (1996) Density functional theory in periodic system using local Gaussian basis sets. Computer Physics Communications, 98, 181. doi:10.1016/0010-4655(96)00078-1
- Wu, Z. and Cohen, R.E. (2006) More accurate generalised gradient approximation for solids. Physical Review B, 73, 235116. doi:10.1103/PhysRevB.73.235116
- Dolg, M., Stoll, H., Savin, A. and Preuss, H. (1989) Energy-adjusted pseudopotentials for the rare earth elements. Theoretical Chemistry Accounts, 75, 173. doi:10.1007/BF00528565
- Dolg, M., Stoll, H. and Preuss, H. (1993) A combination of quasirelativistic pseudopotential and ligand field calculations for lanthanoid compounds. Theoretical Chemistry Accounts, 85, 441. doi:10.1007/BF01112983
- Johnson, D.D. (1998) Modified Broyden’s method for accelerating convergence in self-consistent calculations. Physical Review B, 38, 12807. doi:10.1103/PhysRevB.38.12807