Natural Science
Vol.4 No.2(2012), Article ID:17330,4 pages DOI:10.4236/ns.2012.42020
Dielectric spectroscopy of diglycidyl ether of bisphenol-A at glass transition temperature
![]()
Department of Physics, University of Sistan and Baluchestan, Zahedan, Iran; soheil.sharifi@gmail.com
Received 29 December 2011; revised 20 January 2012; accepted 8 February 2012
Keywords: Dielectric Relaxation; Nano-Size Motion; Secondary Relaxation; Pressure and Temperature
ABSTRACT
We used broadband dielectric spectroscopy in the frequency range from 10–2 Hz up to 107 Hz and we found dynamics of the primary (- and intermolecular Johari-Goldstein (JG) (-processes are strongly correlated in diglycidyl ether of bisphenol-A over a wide temperature from 193 to 283K and pressure P range from 0.1 to 600 MPa. Analysing the temperature and pressure behavior of the (- and (JG) (-processes, a clear correlation has been found between the structural relaxation time, the Johari-Goldstein relaxation time and the dispersion of the structural relaxation. These results support the idea that the JohariGoldstein relaxation acts as a precursor of the structural relaxation and therefore of the glass transition phenomenon.
1. INTRODUCTION
In glass former materials close to the glassy state the relaxation scenario evolves over many times decades, from very fast processes (b-processes) on the scale of nanoseconds to very slow ones (structural process) occurring on the scale of seconds, [1,2]. On this respect, it is of fundamental importance to verify the universal occurrence of a non cooperative relaxation of the whole molecule before the cooperative one reflecting in the structural relaxation, [3]. So, it is challenging to distinguish between intermolecular and intramolecular b-processes also in systems with a complex molecular structure, even showing more than one b-process. Intermolecular b-processes observed in rigid molecule is called Johari-Goldstein bprocesses (JG-processes).
Among secondary relaxations, those originated by intra-molecular transitions naturally bear no relation to the structural relaxation. However, some relation may be expected for intermolecular secondary relaxations [1-3], originated by local motions of the entire molecule. These processes, possibly relevant for the glass transition, are now referred to as the Johari-Goldstein (JG) secondary or JG b-relaxation to honor their discovery of secondary relaxation even in totally rigid molecules without internal degree of freedom. A rational of relaxation dynamics in such terms is for example proposed by the Coupling Model [4].
In this paper we contribute to such discussion by investigating the relation between the structural and the JG b-relaxation in a system, namely diglycidyl ether of bisphenol-A (DGEBA), in an interval of pressure ranging from 0.1 to 600 MPa and temperature from 193 to 283 K. A great advantage in such a study is provided by the possibility of studying the variation of relaxation dynamics with temperature and pressure. Variation of pressure acts on the density only of the systems while variation of temperature acts on the thermal energy and on the density. By controlling both thermodynamic parameters it is possible to study the relaxation dynamics of the same system with different density and thermal energy values. In such conditions we can evidence any, if exists, relation between the dynamics properties of the different relaxation processes.
2. EXPERIMENT
2.1. Methods
The complex dielectric constant  was measured in the frequency range from 10–2 Hz up to 107 Hz at different isothermal and isobaric conditions using Novocontrol Alpha analyser. The temperature at atmospheric pressure was varied from 100 and 320 K by means of a conditioned nitrogen flow cryostat. The high pressure experiment was carried out by means of an hydrostatic press and silicon oil as a pressure transmitting medium. A Teflon membrane prevented the oil to contact the dielectric cell. The temperature of the whole pressure chamber was controlled by a thermal jacket connected to a liquid circulator.
2.2. Materials
Poly(Bisphenol A-co-epichlorohydrin), glycidyl endcapped (DGEBA), with average molecular weight ~380 g/mol, corresponding to n = 0.14 in the chemical formula Figure 1, and glass transition temperature 255 ± 1 K was purchased from Shell Co. under the trade name of Epon 828. In the glassy state two secondary processes are present and the slower one was identified as the JG process [4-7].
3. RESULTS
Dielectric loss spectra,  , of DGEBA were measured from above to below the glass transition. In Figure 2, the different thermodynamic paths are reported along which we investigated the relation between the structural and the secondary relaxation close to Tg(P). Dashed lines show isothermal paths and solid lines show isobaric paths followed during the vitrification. For all the systems here investigated the secondary process were analysed only in the glassy state close and below Tg.
We acquired dielectric spectra along isothermal paths by varying pressure from 0.1 MPa up to the maximum value of 600 MPa, with step of 10 MPa in the supercooled liquid and step of 50 MPa in the glass, Figure 3. We also measured dielectric spectra by varying temperature at high pressure from 344 to 233 K with step of 3 K in supercooled liquid and 5 K in the glass, Figure 3. The
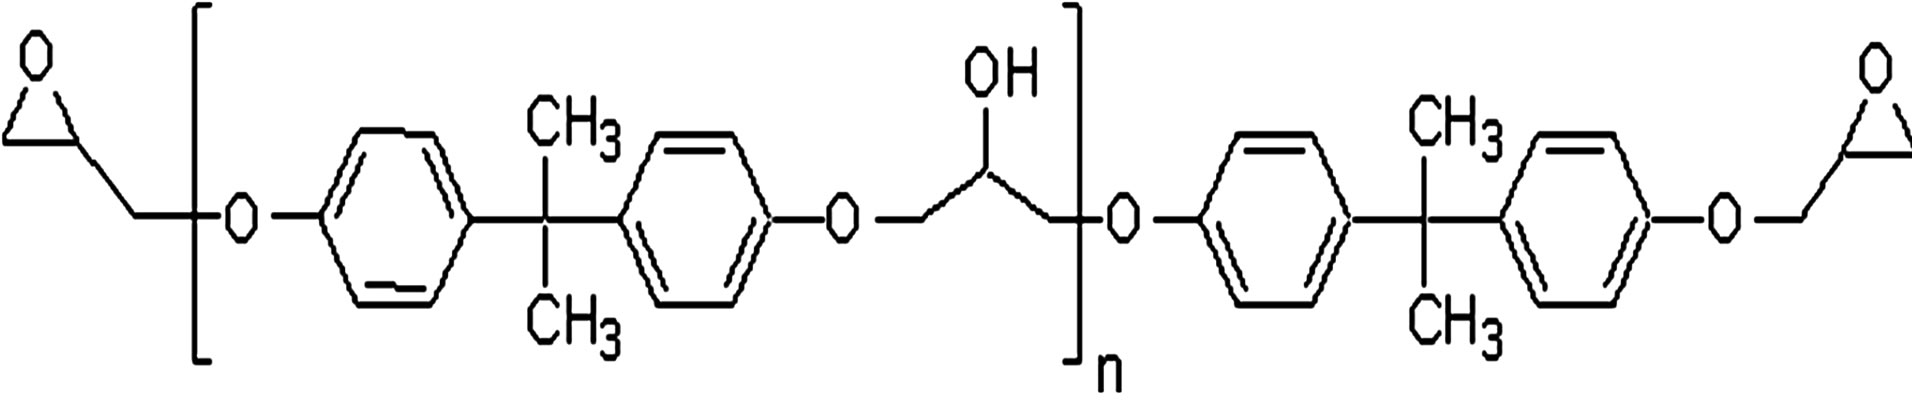
Figure 1. Chemical structure of Poly (BisphenolA-coepichlo rohydrin), glycidyl end-capped.
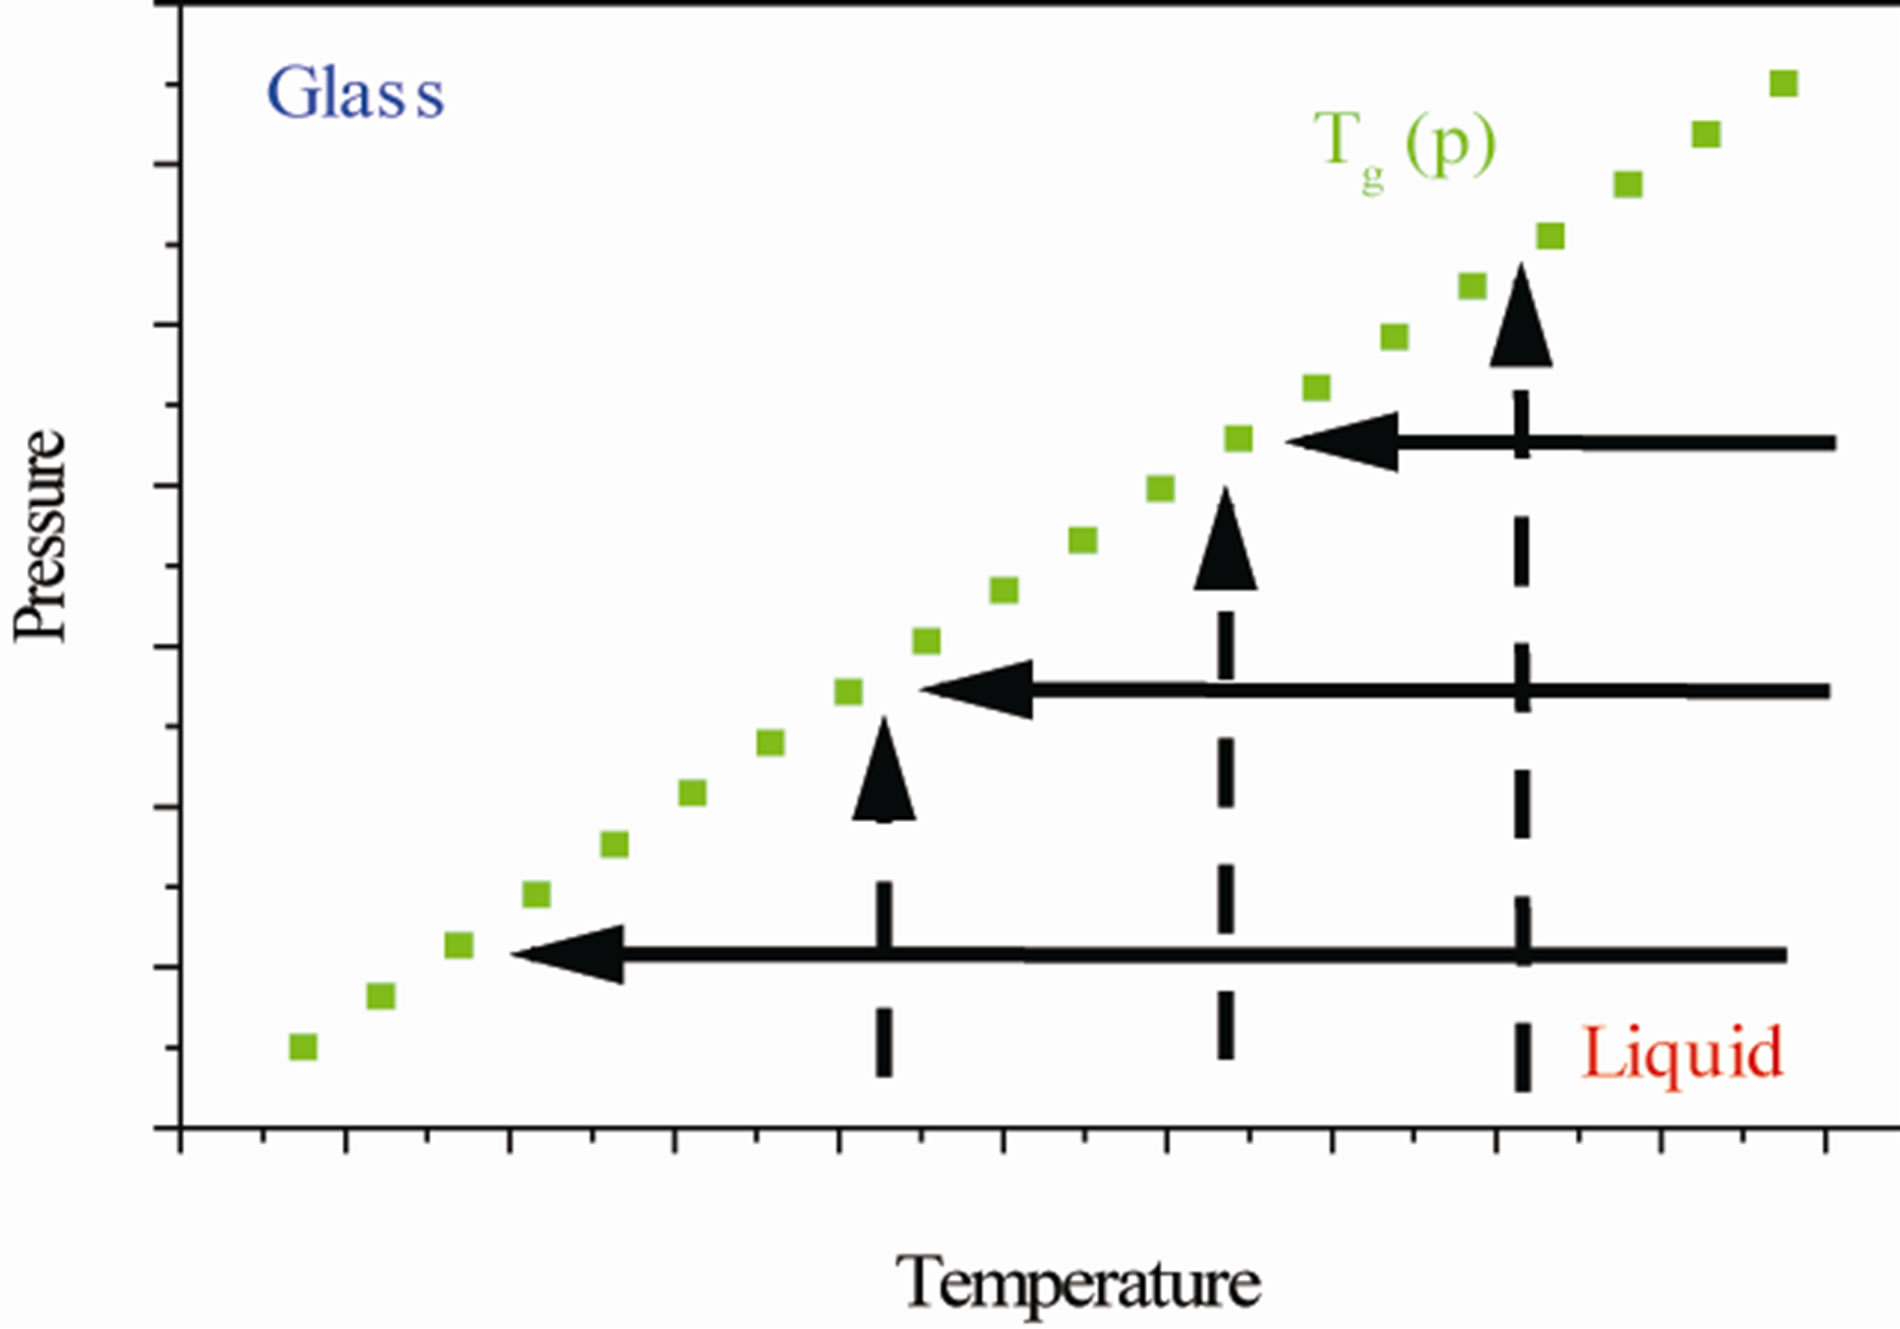
Figure 2. Schematic representation of the thermodynamic paths used during the measurements reported in this chapter. Squares (green points) represent the glass transition temperature at different pressure. Dashed and continuous lines represent isothermal and isobaric paths to the glass transition.
 (a)
(a)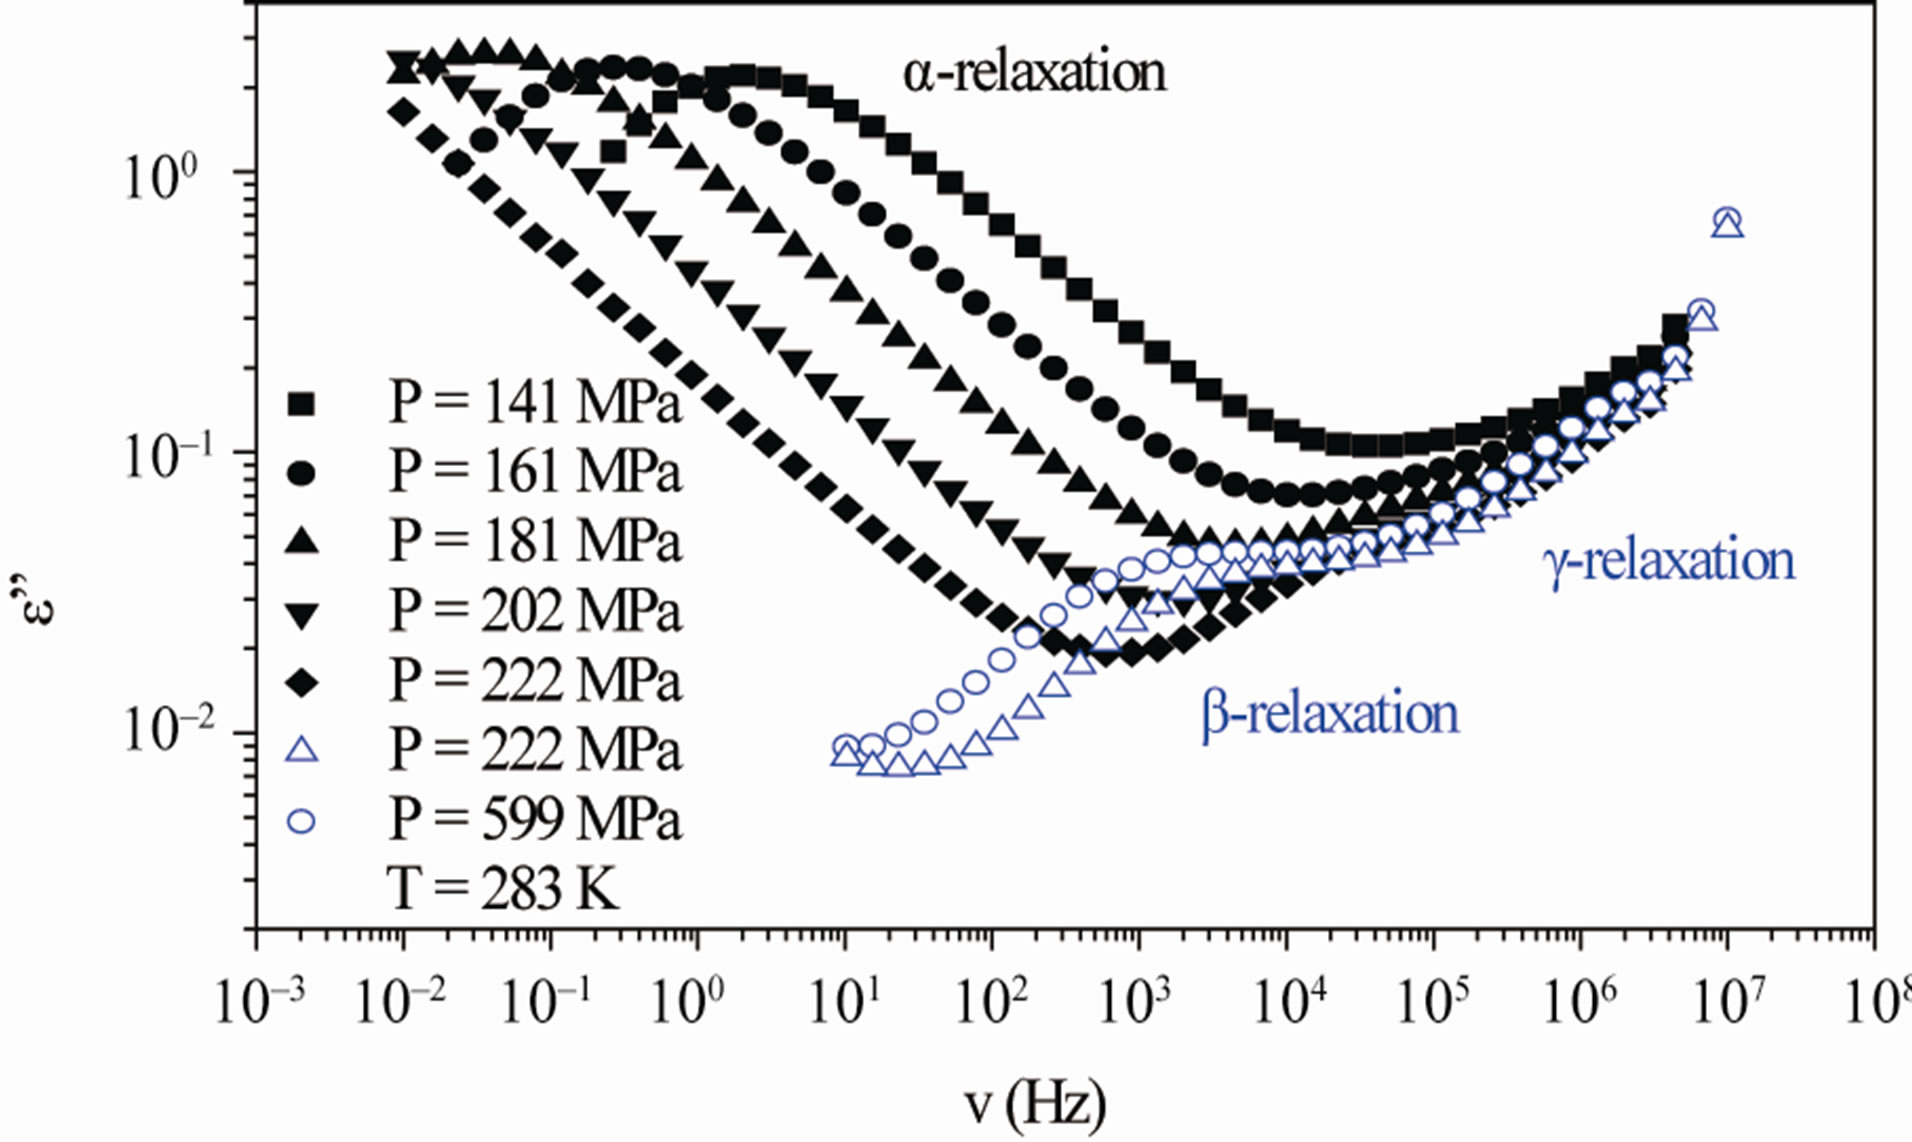 (b)
(b)
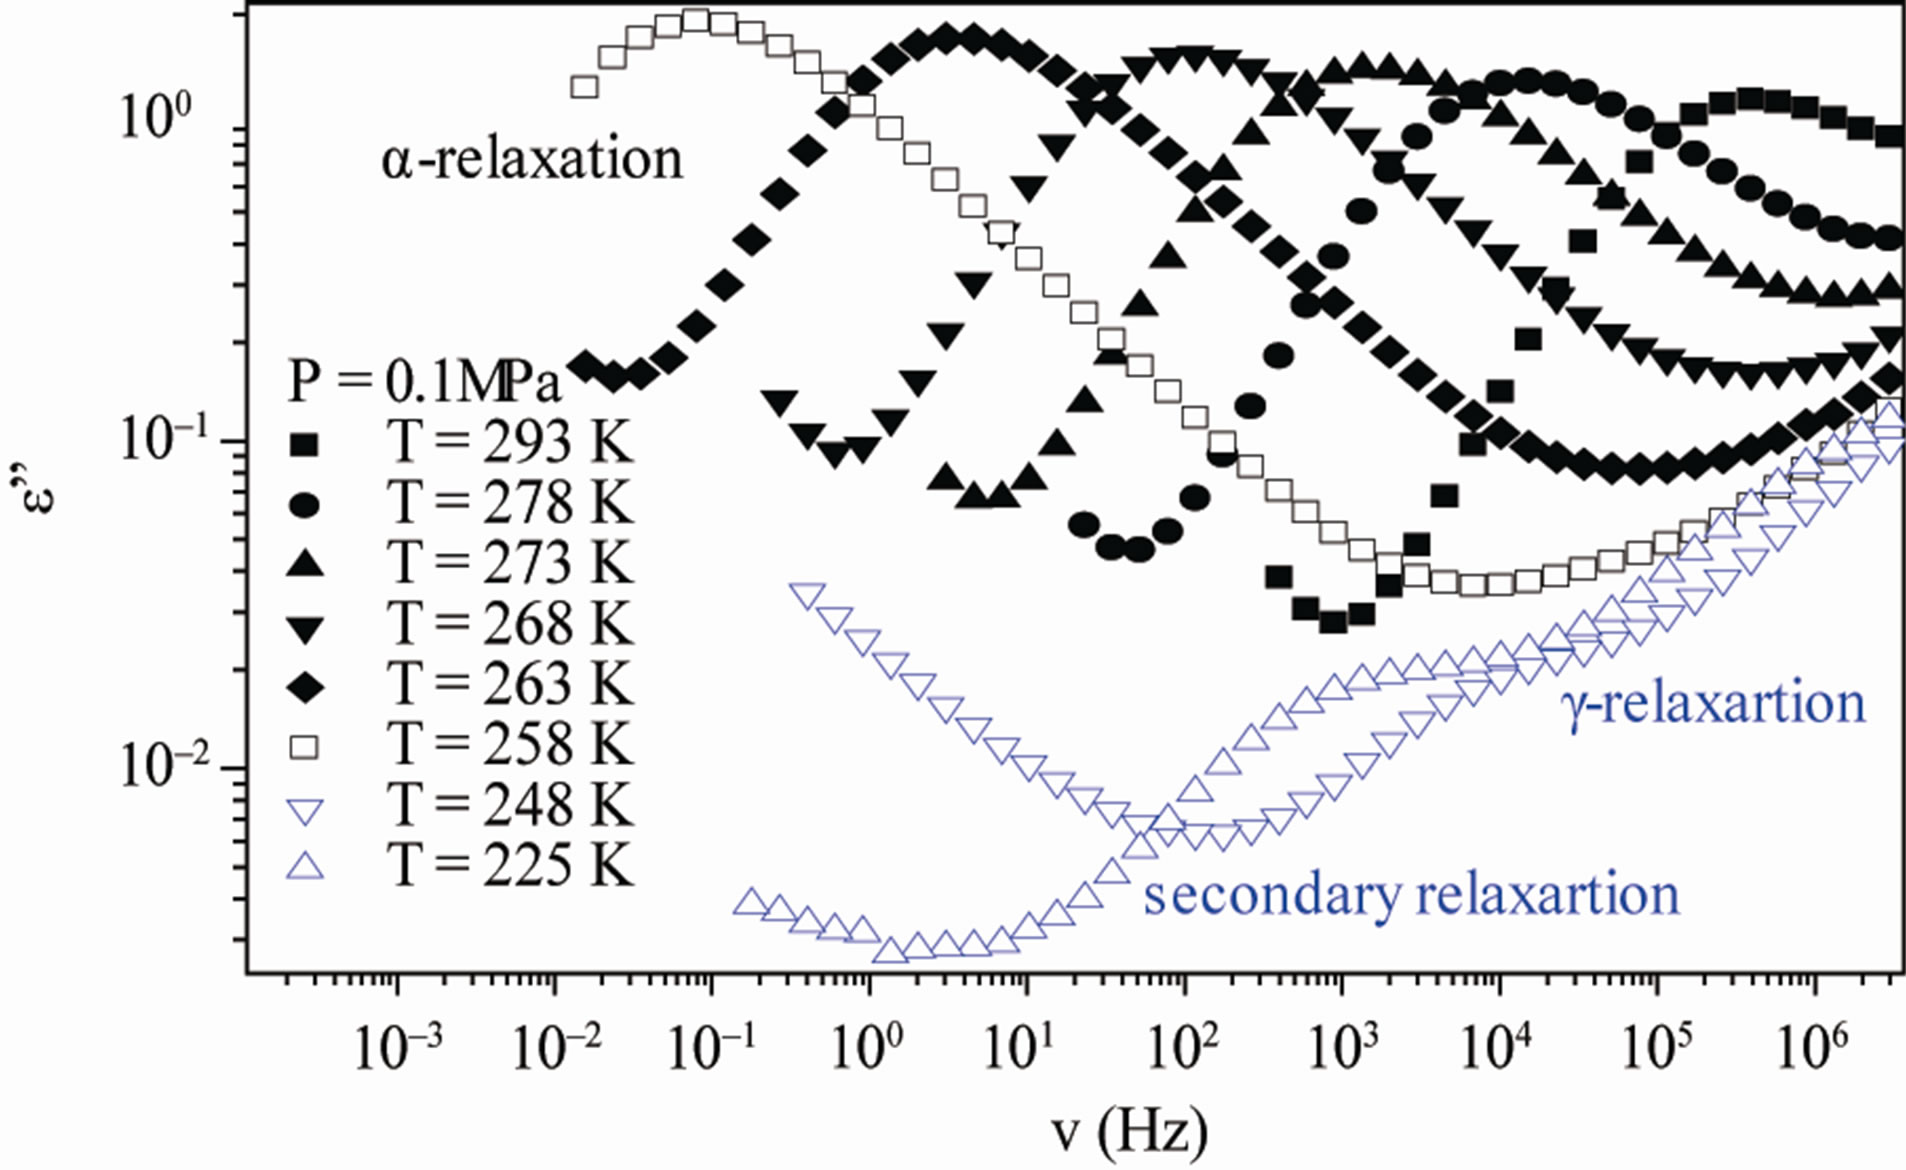
Figure 3. (a) Isobaric (0.1 MPa) dielectric loss spectra of DGEBA measured at different temperatures (values reported in the figure); (b) Isothermal (283 K) dielectric loss spectra of DGEBA measured at different pressure (values reported in the figure). The black spectra are measured in the supercooled liquid and are dominated by the α-peak and the blue open symbols spectra are measured in the glassy state.
increase of pressure slows down the structural relaxation similarly to the decrease of temperature: the structural relaxation peak shifts to lower frequencies until the structure of the liquid is eventually arrested in a glassy state. At ambient pressure in DGEBA only the a-structural process is visible above Tg, when spectra are collected in the frequency interval 10–2 - 106 Hz. In the case of DGEBA, for temperatures below Tg two further relaxation processes, b-, and, g-, are visible in the frequency interval, Figure 3. All the observed relaxation processes move towards lower frequencies on decreasing temperature or increasing pressure, the a-process being the most sensitive and the gthe less. The g-process occurs only at very high frequency and in our frequency window can be measured only at very low temperature at ambient pressure, but never at high pressure due to limitation of the temperature interval, Figure 3.
Dielectric spectra were fitted with a superposition of different HN functions, one for each relaxation process, [1-3]:
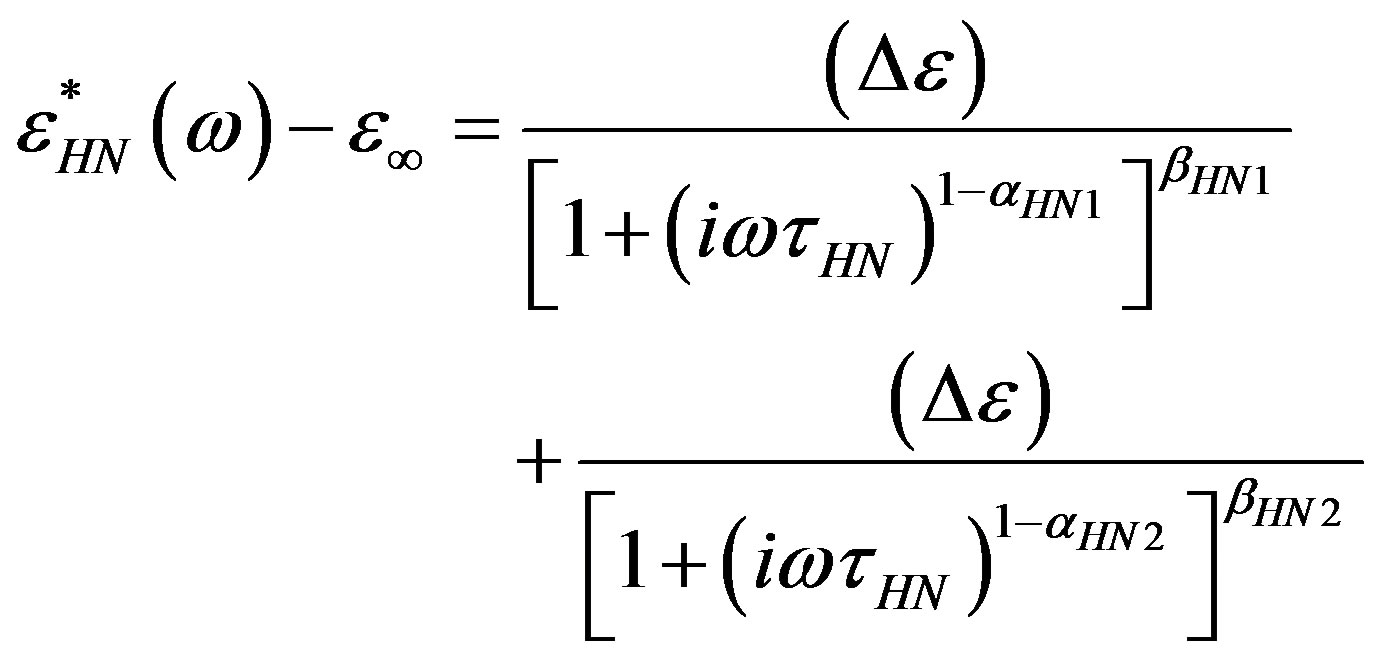 (1)
(1)
where the shape parameters αHN, βHN (0 < (1 – αHN); βHN (1 – αHN) ≤ 1) describe the symmetric and asymmetric broadening of the complex dielectric function.
Since for any value of temperature not more than two relaxation processes appear, in the fitting procedure we never used more than two relaxation functions. Moreover, the b-process was usually described by the CC function(β = 1), and the contribution of the g-process at high pressure (DGEBA), was accounted by an HN function with only Deg and tg as free parameters, and the ag and bg parameters fixed to the values found at ambient pressure and very low temperature. The fitting program, based on a least square minimizing procedure, contemporary fits the real and the imaginary part of the dielectric spectrum and furnishes the values of the parameters and the corresponding errors. Table 1, report some representative values of the parameters a and b for the considered systems at different pressure and temperature.
The structural relaxation in diglycidylether of bisphenol A (DGEBA) with variations of temperature has been examined studied with three spectroscopic methods: dielectric spectroscopy (DS), dynamic light scattering-photon correlation spectroscopy (LS), and mechanical spectroscopy (MS) [7-9]. The DS and LS measurements were carried out as a function of both temperature and pressure. Moreover, pressure-volume-temperature measurements were obtained for the DGEBA. These data allow an assessment of the relative contributions of thermal energy and free volume to structural relaxation in DGEBA.
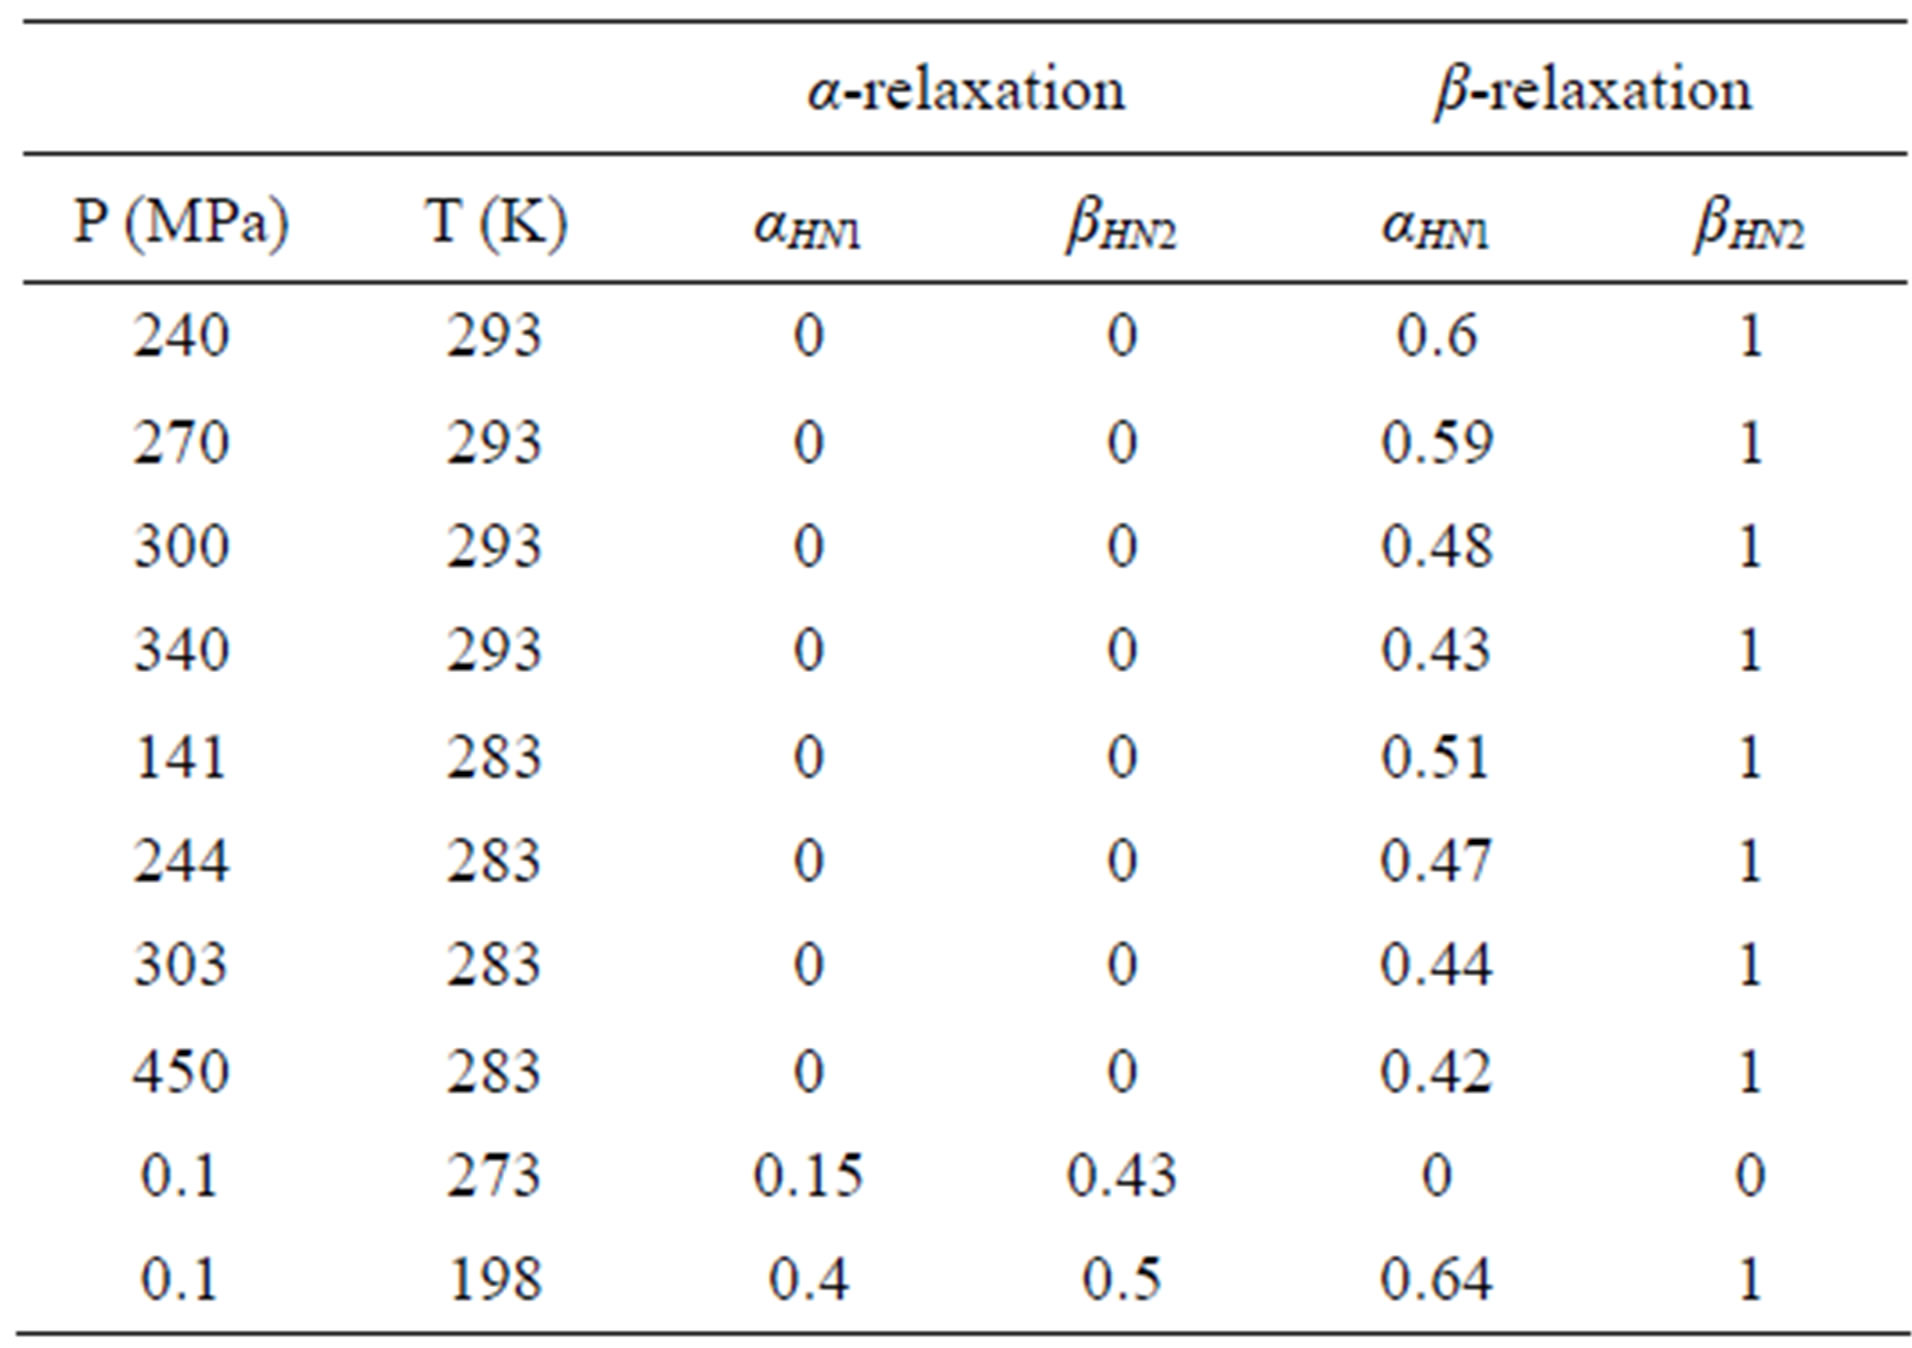
Table 1. P is pressure and T is temperature and the αHN1 and βHN2 are parameters of α-(structural), αHN1 and βHN2 of β-(secondary) relaxation (Eq.1) at different pressures and temperatures for DGEBA.
The results clearly show a substantial role for both thermal and free volume in the dramatic slowing down of the dynamics. The combined temperatureand pressure-dependences of the dielectric and light scattering relaxation times were analyzed using the Avramov equation, showing that the fragility (normalized temperature dependence) is pressure independent over the studied range of pressures. Conformance to the time-temperature-pressure superposition principle was also observed for all measurement techniques. As model independent parameter for the characteristic time scale of the process we considered the maxima of frequency, 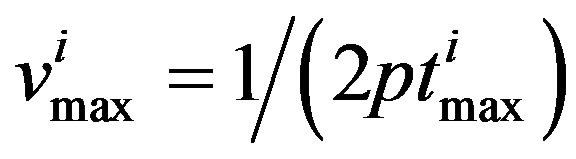 corresponding to the loss peak maximum frequency, which was calculated by
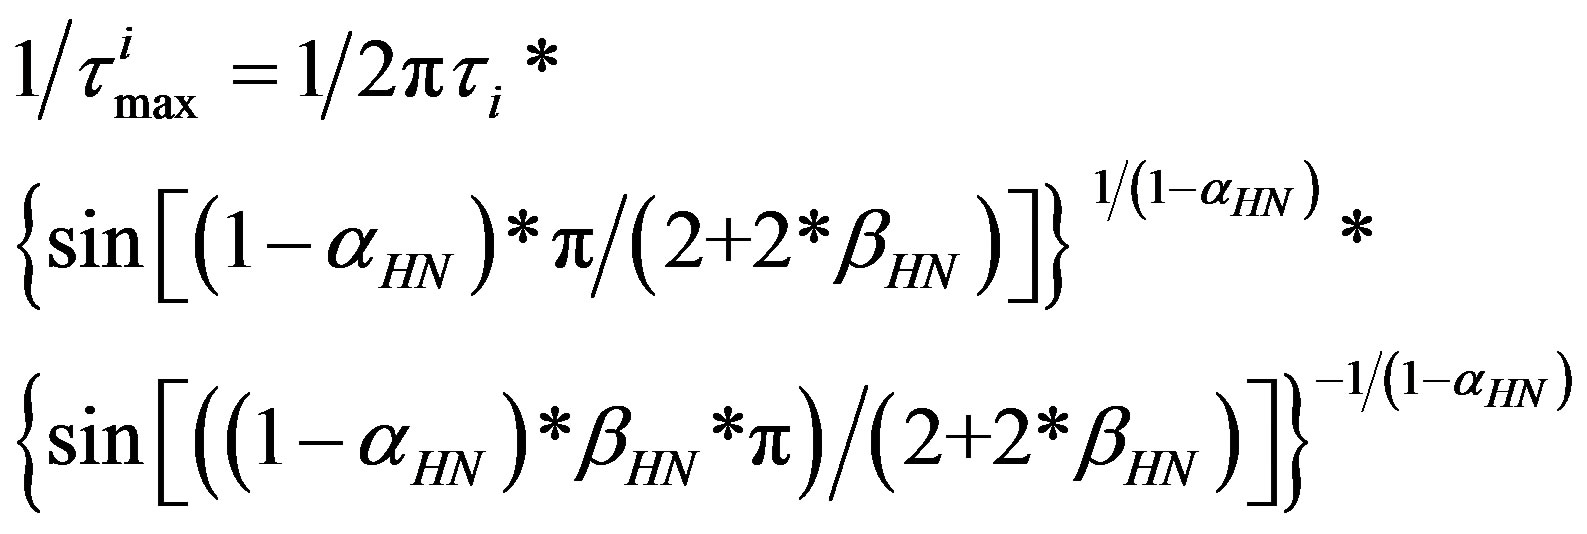 (2)
(2)
where the symbols have the same meaning as in Eq.1. Those results of relaxation time as function of temperature and pressure are presented in the Figure 4. The value of the glass transition temperature, Tg, determined by ta (Tg) = 10 s at ambient temperature is (T = 257 ± 1 K) for DGEBA. The pressure dependence of Tg can be
 (a) (b)
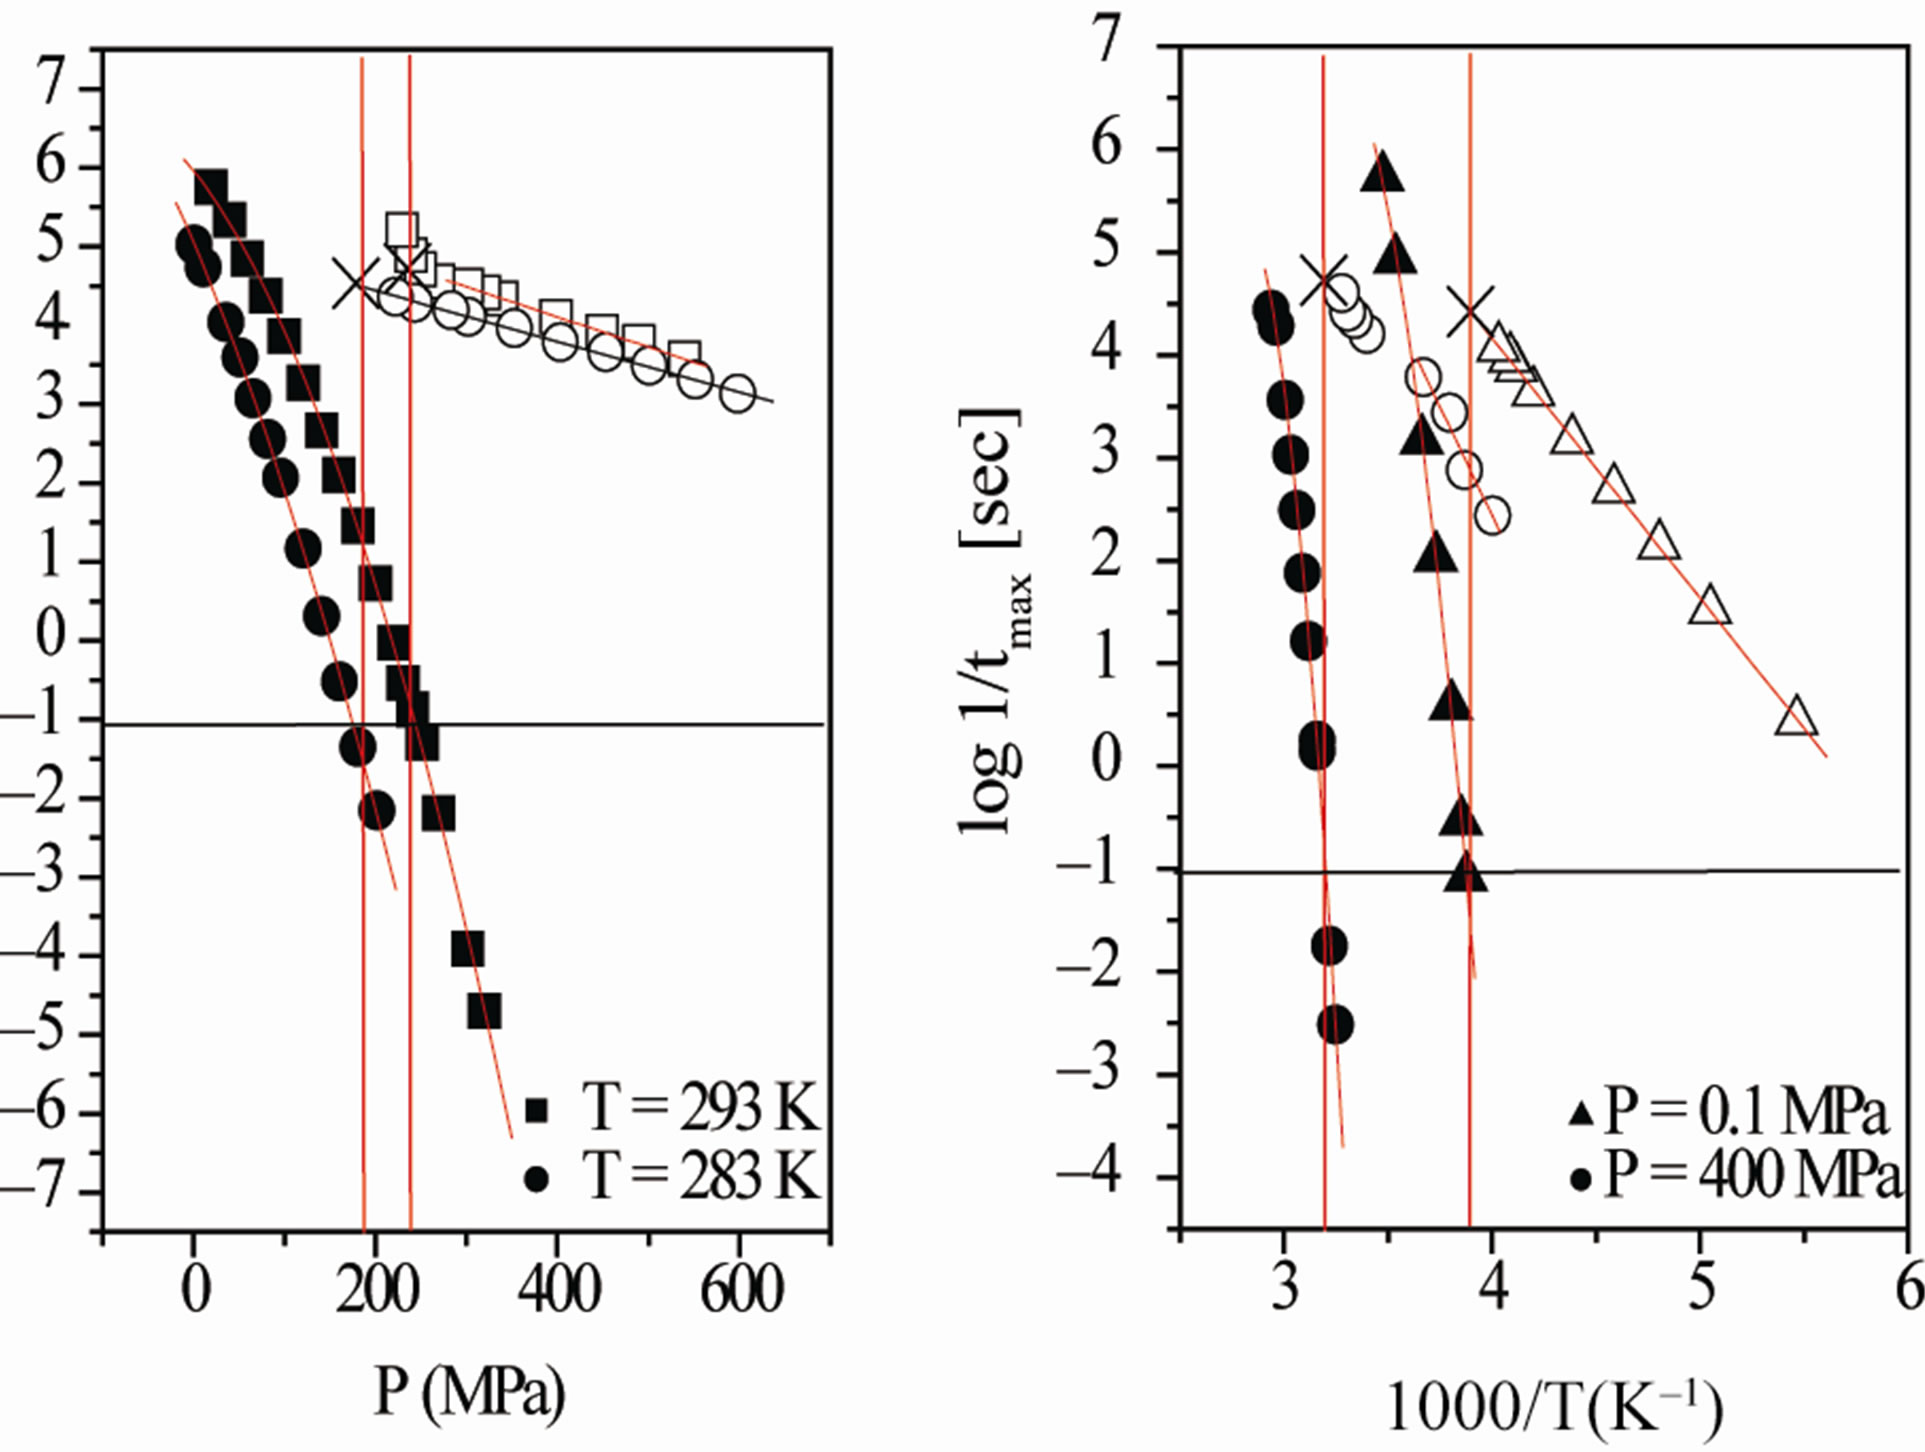
Figure 4. (a) Pressure dependence of the logarithmic of tmax of DGEBA (Eq.1) for the a-(full symbols) and the b-process (open symbols), at two different values of T: 293 K (squares), and 283 K (circles). (b) Temperature dependence of the logarithmic of  of DGEBA for the a-(full symbols) and the b(Secondary)-process (open symbols), at two different values of pressure: 0.1 MPa (triangles), and 500 MPa (circles). In both panels the continuous lines represent fit with the VFT (a-relaxation) and Arrhenius (b-relaxation) equations. The horizontal continuous lines show the relaxation time value used to define the glass transition. Crosses represent the values of
  at (T,P)g.
expressed by polynomial function, Tg(P) = 259.89 + 0.1*P – 5.42*10–5 *P2 K for DGEBA, Figure 5. The temperature dependence of  can be well fitted by a Vogel-Fulcher-Tammann, VFT, equation,
 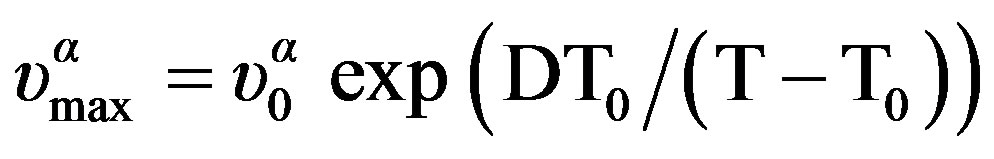 over the entire temperature interval. The pressure dependence of
  can be well fitted by a Vogel-Fulcher-Tammann like, PVFT, equation,
 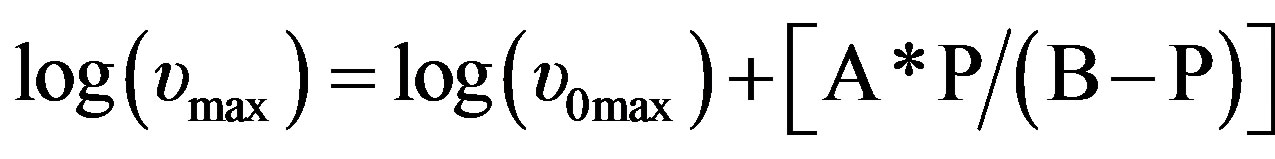 over the entire pressure interval. In the isothermal paths, pressure dependence of
  below Tg is well reproduced by the Arrhenius equation,
 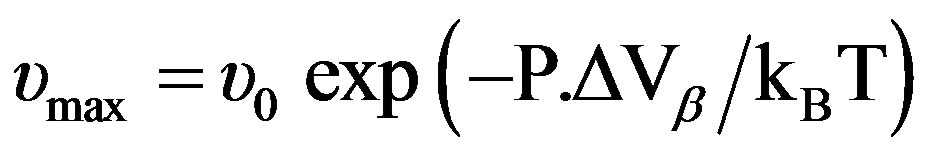 (where ΔVβ is the activation volume of the secondary b-relaxation) and in isobaric condition the temperature dependence of
  below Tg is well reproduced by the Arrhenius equation,
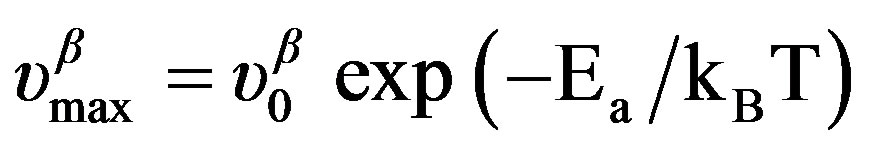 . The different VFT and Arrhenius parameters for the isobaric dielectric relaxation spectra of the different are listed in Table 2.
4. DISCUSSION
The combined variation of both temperature and pressure allows reaching dynamic states characterized by the same value of structural relaxation time, but different
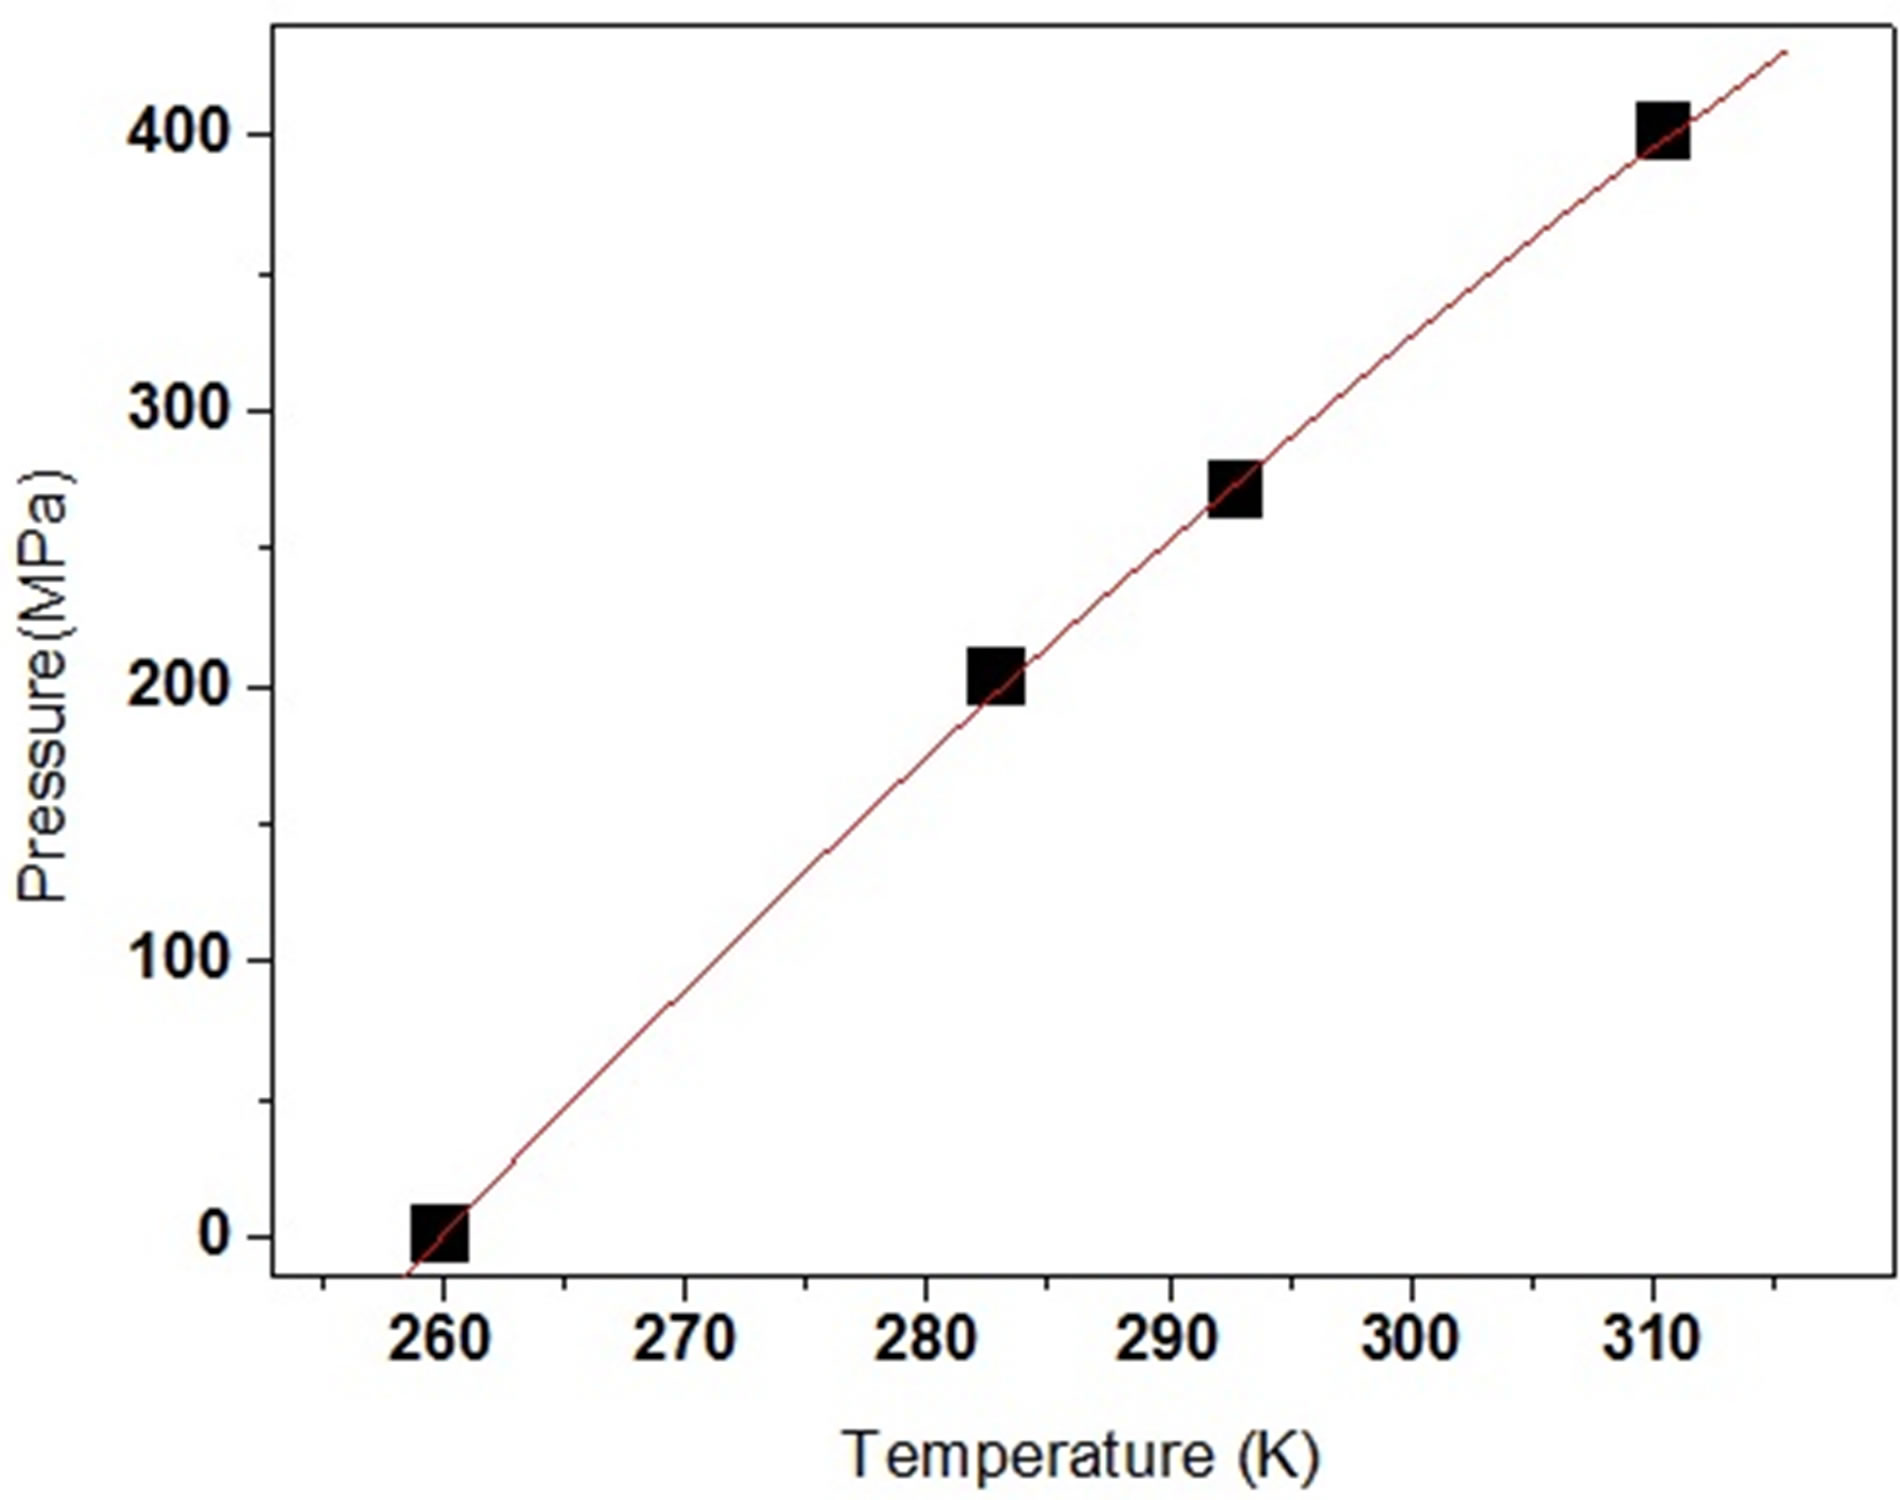
Figure 5. Values (symbols) of Tg as a function of P for DGEBA. The continuous line is a fit with a second order polynomial.
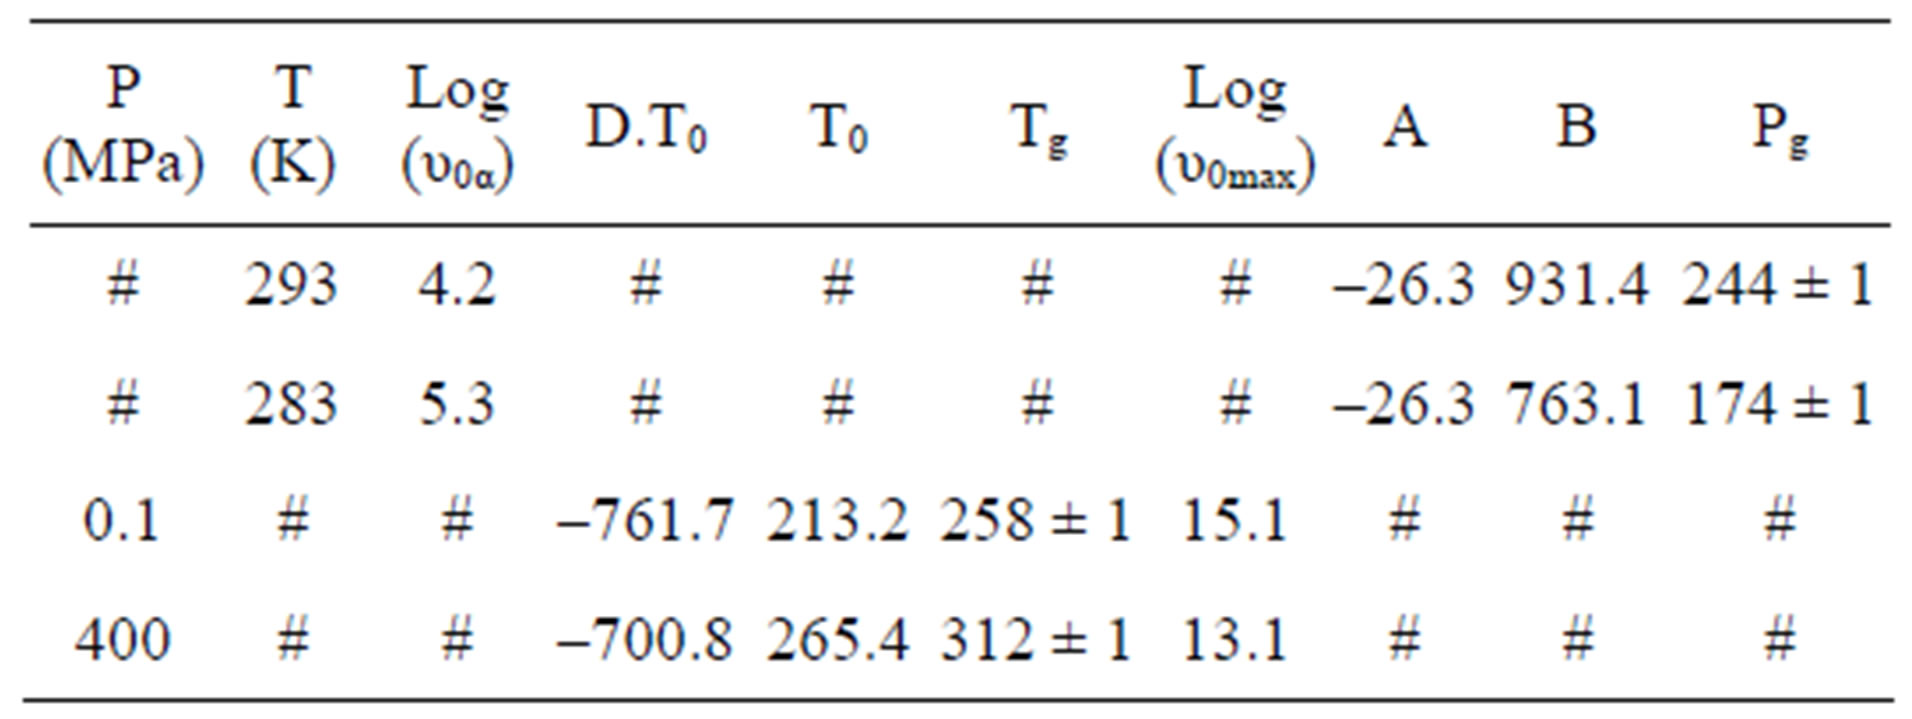
Table 2. The glass transition temperature and the relevant VFT parameter for three different systems, as determined by dielectric relaxation measurement [parameter of A and B come from the equation, log(υmax) = log (υ0max)+ A·P/(B – P)].
thermal energies and densities. The relative role of density and thermal energy on the slowing the structural relaxation on approaching the glass transition is a matter of study. Even if a similar behavior can be found for materials belonging to the same class, the details of their relative role vary for each system. From the dynamic point of view the glass transition is traditionally defined by considering the structural relaxation time being a fixed long value. According to our definition ta (Tg) = 10 and the glass transition can be obtained for different couples of values of pressure and temperature, whose relation in our case is expressed by polynomials function for pressure values up to 500 MPa, Figure 5. It is interesting to deepen the investigation about the b-JG process, also in systems with complex molecular structure, and its eventual connection with the glass formation phenomenon. Since one of the most prominent aspects related to the glass formation is of dynamic nature it seems reasonable to find out a dynamic relation between the two processes. If we scrutinizing in our systems the behaviour of the brelaxation for different values of (T,P)g but the same value ta, for example at the glass transition, it appears that also the values of tmax is almost constant, Figure 4. In fact, for DGEBA we observe a maximum variation of tmax of less than half a decade for all the different temperature and pressure conditions. In other words, locating the glass transition line (Tg, Pg) as isochronal locus of the structural process, irrespective of the fact that the conditions of temperature and of pressure are different the ratio ta(P,T)/tb(P,T)P,T is constant. We know that pressure and temperature act to a different extent on the structural dynamics. The same is also for the b-process, and a limiting case is represented by those processes that are almost insensitive to pressure variations, but are temperature dependent [10-12]. The evidence that at the glass transition the aand b-time scales are correlated suggests that the dependence of the characteristic times of the two processes on the external parameters must be correlated. This result is compatible with the hypothesis of the complex relaxation scenario as a continuous evolution from localized (almost non cooperative) to fully cooperative motions, both involving the motion of the whole molecule. It is likely to suppose that the connection between aand b-dynamics is not a universal feature of all b-processes, but only of those local processes intimately connected to the cooperative structural dynamics. DGEBA present two b-processes, and it would be important to check this idea not only on the slower bprocess but also on the faster g-process. However, since experimental limitation the g-process was not measured at high pressure and such test cannot be done. However, to support the idea that such type of investigation can distinguish b-processes with a particular origin, we can refer to data of decahydroisoquinoline in, ref [12]. This result was also found in some different systems. The different temperature and pressure paths of mixtures containing the rigid polar molecule quinaldine (QN) (obtained from Aldrich, Tg = 180 K) and tristyrene (obtained from PSS, Tg = 234 K), with concentration ranging from 5 to 100 wt%. Tristyrene was mixed well with QN, and was studied for being used as the non active component in dielectric measurements because of the weak dipole moment of repeat unit, Figure 6, ref. [12].
5. CONCLUSION
We investigated the relation between secondary and structural dynamics of diglycidyl ether of bisphenol-A (DGEBA) under variations of temperature and pressure. We propose a model independent analysis for scrutiny a possible relation between structural and secondary relaxations. The analysis consists in investigating the ratio ta/tb for different values of pressure and temperature (density and thermal energy), but the same value of structural relaxation time. According to such analysis we evidenced that the b-process in DGEBA is clearly related with the structural dynamics, and then to the glass transition. In fact, for different thermodynamic conditions of pressure and temperature corresponding to  for DGEBA, we observe that the relaxation time of the
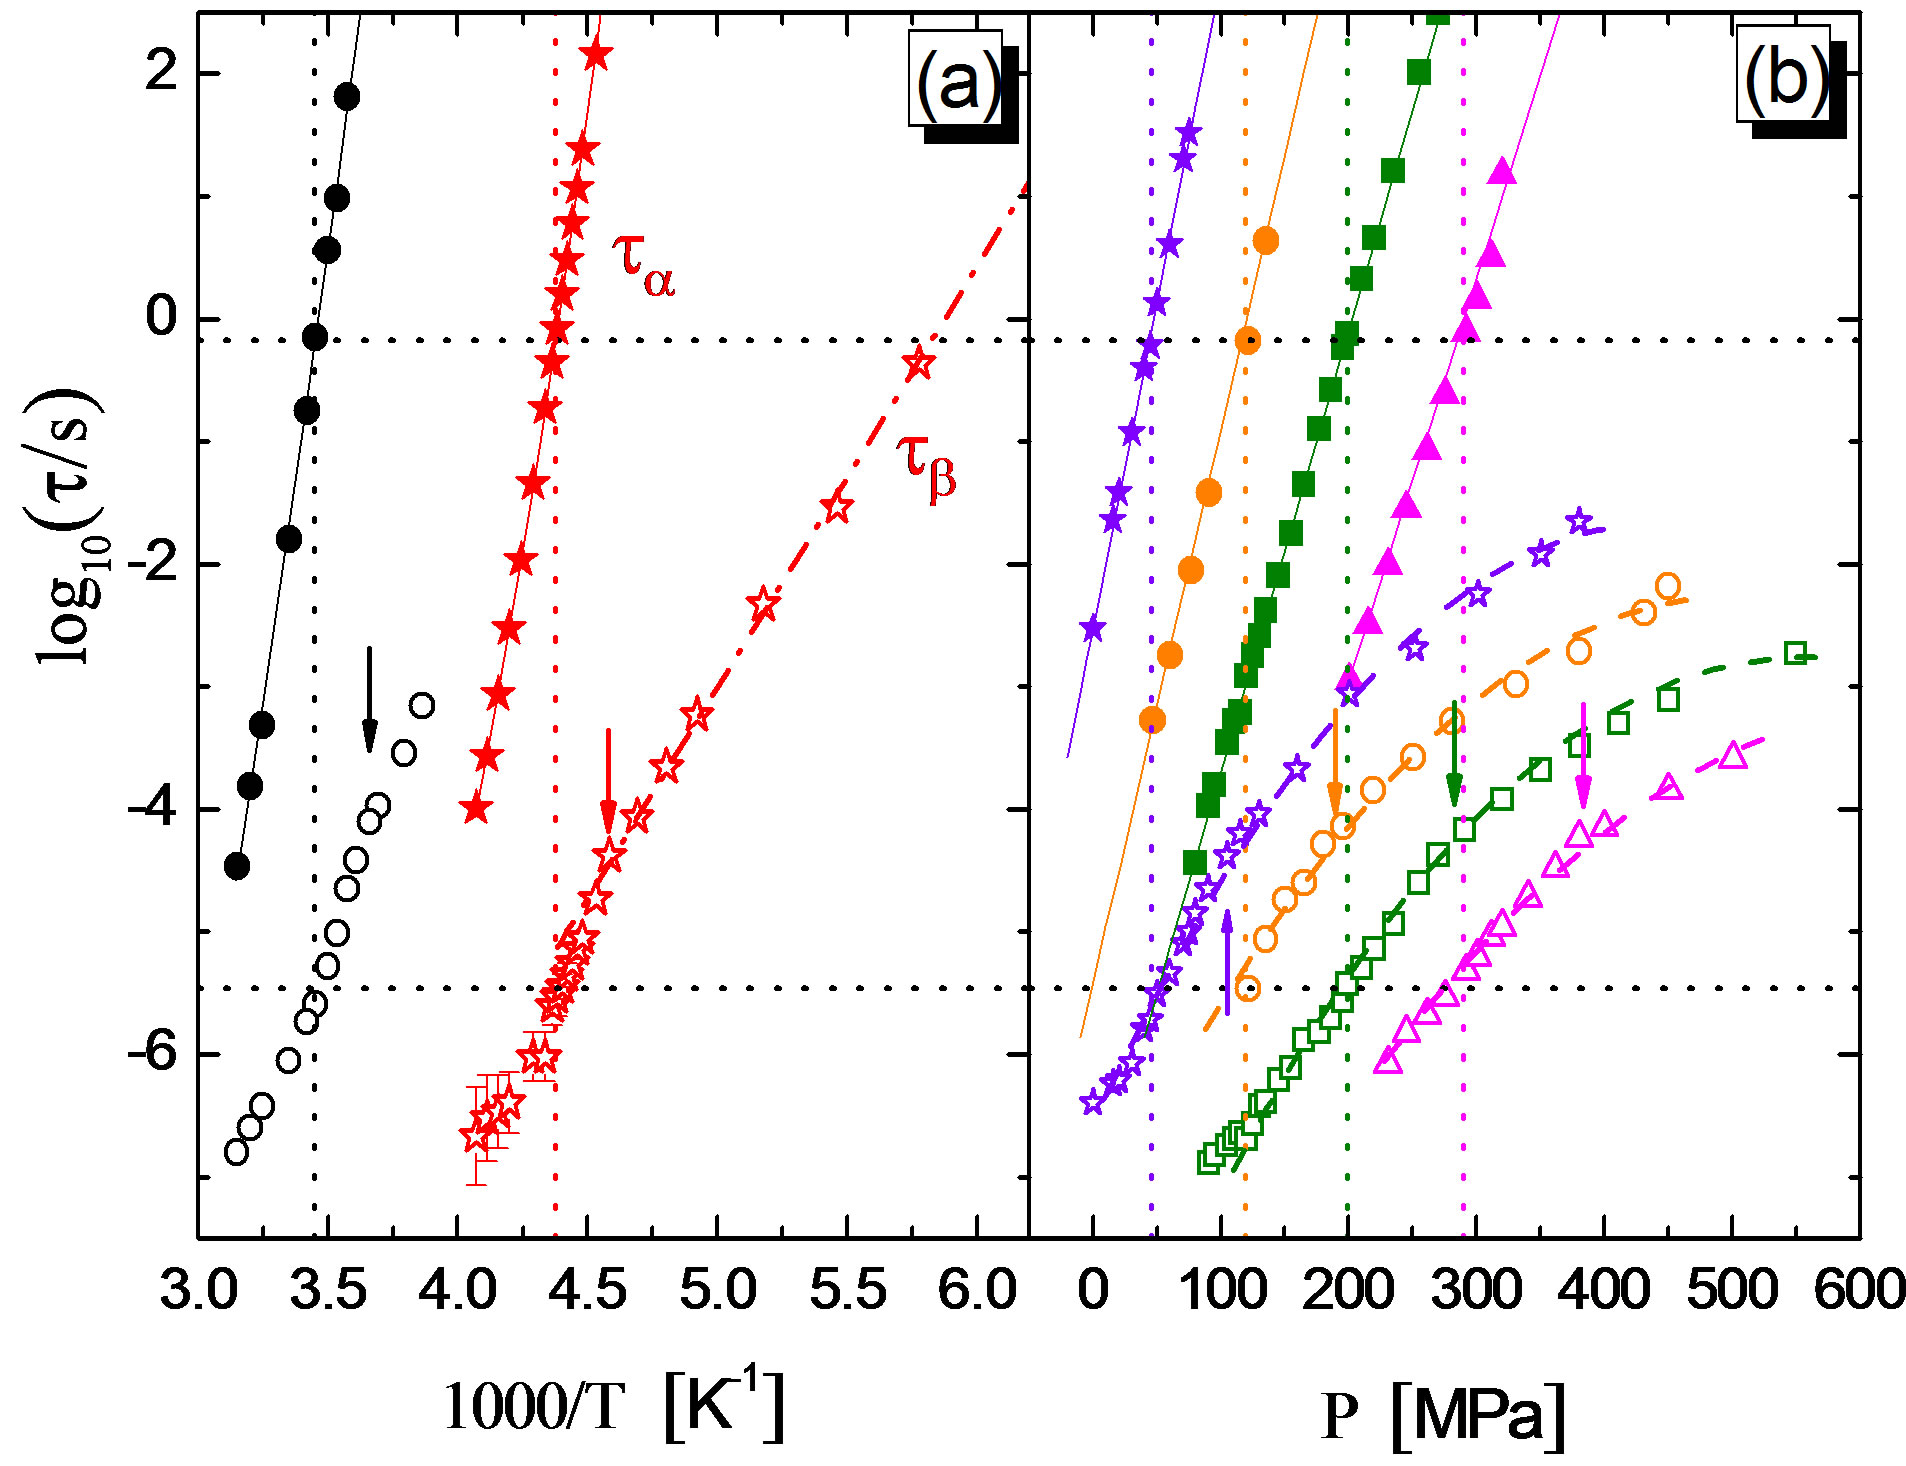
Figure 6. Relaxation map for the mixture 10% QN in tristyrene. (a) Isobaric data: 0.1 MPa (stars), 380 MPa (circles). (b) Isothermal data: 238 K (stars), 253 K (circles), 263 K (squares), 278 K (triangles). Closed and open symbols are for ta and tJG respectively. Continuous lines through the ta data represent Vogel-Fulcher fits in (a), and linear fits in (b). The dashed-dotted line through tJG in (a) is an Arrhenius fit to the ambient pressure data at T < Tg, and the dashed curves in (b) are guides for eyes in following its P-dependence. Upper and lower horizontal dotted lines indicate log10(ta) = –0.17 (i.e. ta = 0.67 s) and log10(tJG) = –5.46 (tJG = 3.5 ms), vertical dotted lines mark the corresponding x-axis values. Vertical arrows correspond to the values of x-axis for which log10(ta) = 3 and mark the change of dynamics for tJG, ref. [12].
b-process is almost constant. These results are fully consistent with those contemporarily found for mixtures of glass formers materials.
6. ACKNOWLEDGEMENTS
This work was supported by the University of Sistan and Baluchestan.
REFERENCES
- Sharifi, S. (2011) Temperature dependence of the activation volume of secondary relaxation in glass formers. ISRN Materials Science, 460751.
- Sharifi, S. and Asl, J.M. (2011) Secondary relaxation inside the glass. ISRN Materials Science, 201, 764874.
- Sharifi, S. (2011) Activation volume of secondary relaxation. Materials Sciences and Applications, 2, 624-628. doi:10.4236/msa.2011.26084
- Ngai, K.L. (2003) An extended coupling model description of the evolution of dynamics with time in supercooled liquids and ionic conductors. Journal of Physics: Condensed Matter, 15, S1107. doi:10.1088/0953-8984/15/11/332
- Grzybowska, K., Grzybowski, A., Ziolo, J., Paluch, M. and Capaccioli, S. (2006) Dielectric secondary relaxations in polypropylene glycols. Journal of Chemical Physics, 125, 044904. doi:10.1063/1.2219112
- Sharifi, S., Capaccioli, S., Lucchesi, M., Rolla, P. and Prevosto, D. (2011) Temperature and pressure dependence of secondary process in an epoxy system. Journal of Chemical Physics, 134, 044510. doi:10.1063/1.3518972
- Dlubek, G., Kilburn, D. and Alam, M.A. (2005) Temperature and pressure dependence of α-relaxation and free volume in poly(vinyl acetate). Macromolecular Chemistry and Physics, 206, 818-826. doi:10.1002/macp.200400495
- Tyagi, M., Aleg, A. and Colmenero, J. (2007) Broadband dielectric study of oligomer of poly(vinyl acetate): A detailed comparison of dynamics with its polymer analog. Physical Review E, 75, 061805. doi:10.1103/PhysRevE.75.061805
- Paluch, M., Patkowski, A. and Fisher, E.W. (2000) Temperature and pressure scaling of the α relaxation process in fragile glass formers: A dynamic light scattering study. Physical Review Letters, 85, 2140-2143. doi:10.1103/PhysRevLett.85.2140
- Comez, L., Fioretto, D., Palmieri, L., Verdini, L., Rolla, P.A., Gapinski, J., Pakula, T., Patkowski, A., Steffen, W. and Fischer, E.W. (1999) Light-scattering study of a supercooled epoxy resin. Physical Review E, 60, 3086-3096. doi:10.1103/PhysRevE.60.3086
- Zorn, R., Arbe, A., Colmenero, J., Frick, B., Richter, D. and Buchenau, U. (1995) Neutron scattering study of the picosecond dynamics of polybutadiene and polyisoprene. Physical Review E, 52, 781-795. doi:10.1103/PhysRevE.52.781
- Colmenero, J., Arbe, A. and Alegria, A. (1993) Crossover from Debye to non-Debye dynamical behavior of the α relaxation observed by quasielastic neutron scattering in a glass-forming polymer. Physical Review Letters, 71, 2603-2606. doi:10.1103/PhysRevLett.71.2603
- Kessairi, K., Capaccioli, S., Prevosto, D., Lucchesi, M., Sharifi, S. and Rolla, P.A. (2008) Interdependence of primary and johari-goldstein secondary relaxations in glass-forming systems. Journal of Physical Chemistry B, 1112, 4470.