Health
Vol.08 No.10(2016), Article ID:68821,8 pages
10.4236/health.2016.810102
Association between Geographic Accessibility of Home Care Clinics and Hospitalization in Japan Using Geographic Information Systems and Insurance Claim Data
Takashi Naruse*, Hiroshige Matsumoto, Natsuki Yamamoto, Satoko Nagata
Department of Community Health Nursing, Graduate School of Medicine, The University of Tokyo, Tokyo, Japan

Copyright © 2016 by authors and Scientific Research Publishing Inc.
This work is licensed under the Creative Commons Attribution International License (CC BY).
http://creativecommons.org/licenses/by/4.0/


Received 3 June 2016; accepted 19 July 2016; published 22 July 2016
ABSTRACT
Measuring and improving home care clinic resource volume and geographic allocation are an important public health issue regarding prolonging home care system usage among disabled elderly people. This study examined clinic volume and accessibility’s association with hospitalization duration among disabled elderly people in 13 municipalities in Japan; additionally, this study compared clinic volume and accessibility’s ability to explain hospitalization duration in this population. Home care clinics’ service volume and geographic accessibility were calculated for 17 municipalities using public data and geographic information systems. We analyzed medical claim data from October 2012; the sample included 22,662 persons who were aged ≥75 years, certified as disabled in daily living, and lived in 13 municipalities regarding which data could be obtained for all examined municipality characteristics. Multilevel logistic models with random intercepts were constructed for municipalities and individual- and municipality-level independent variables in order to examine home care clinic volume and accessibility’s correlation with hospitalization duration. Clinic volume ranged from 0 to 9.53 per 10,000 elderly people; clinic accessibility ranged from 0% to 83%. Clinic volume and accessibility were both significantly negatively correlated with hospitalization duration of ≥10 days (odds ratios, 0.944 and 0.713; confidence intervals, 0.914 - 0.974 and 0.553 - 0.921, respectively). Clinics were not homogeneously geographically distributed; clinic accessibility explained hospitalization duration better than clinic volume. Clinic accessibility may more accurately indicate care clinic allocation appropriateness than clinic volume.
Keywords:
Geographic Accessibility, Home Care Clinic, Hospitalization

1. Introduction
Prolonging home care system usage is recommended in order to reduce hospital stay duration and medical costs among disabled people. In Japan, public health professionals in local municipalities are responsible for improving home care systems that care for disabled elderly people [1] . Among the most important aspects of home care systems in each municipality is the equitable provision of accessible services. Public health professions in Japanese municipalities are also required to assess and improve regional resources accessible to home care services [1] . In Japan, home care clinics play a significant role in communities: they are differed from general clinic, and provide uninterrupted service to home-dwelling disabled adults. Home care clinics are expected to promote home death and the continuity of home dwelling and reduce institutionalization among elderly community members.
The Andersen-Newman model [2] has been extensively used as a conceptual guide to human function and service use. This model includes resource volume (i.e., the amount of available resources compared to the population’s size) and resources’ geographical distribution as factors of service resource quality, as resource volume alone does not adequately indicate service availability if resources are not homogeneously geographical distributed. Long-term care services’ geographic accessibility may be quantified by measuring the distance from residents’ homes to service locations: a larger number of residents living near services in a given municipality are equivalent to greater geographic service accessibility in that municipality. Earlier research has extensively examined the effects of geographic service accessibility on health care allocation: residents who live closer to services are more likely to visit service buildings, leading to better outcomes [3] - [5] . Many of these studies determined the distance from residences to service buildings using Geographic Information Systems (GIS) and traffic networks. One study measured the population reachable from the nearest general practice and community pharmacy services, and consequently calculated geographic areas’ “reachable proportion” as an index of service accessibility [5] .
This study examined the association between clinic volume, geographic accessibility, and hospitalization among disabled elderly people in 13 municipalities in A prefecture, Japan. This study additionally compared clinic volume and geographic accessibility’s ability to explain hospitalization in this population.
2. Methods
This study used a secondary analysis method to analyze home care clinic addresses and publicly available data describing elderly people in A prefecture, Japan. These data were used to calculate clinic allocation characteristics for each municipality. This study also examined health care and long-term care insurance claim data. These data were analyzed to examine individual elderly persons’ hospitalization duration and municipalities’ clinic allocation characteristics. This study was conducted as part of a joint research project in the Institute of Gerontology Study. We received written consent to use insurance claim data in an anonymous electronic format from the A Prefecture National Health Insurance Organization. This organization insures all 17 municipalities of A Prefecture and manages claim data. Insured individuals were informed of the research through a public relations paper issued by A prefecture. The ethics committee of the Graduate School of Medicine at the University of Tokyo committee approved this study.
2.1. Volume and Geographical Accessibility of Clinic
Each municipality’s volume of clinics was calculated by dividing the number of home care clinics in the municipality by the population of individuals aged ≥75 years in that municipality (data obtained from the 2010 Japan National Population Survey [6] ).
Clinics’ geographical accessibility was quantified by calculating the proportion of elderly people living near home care clinics in each municipality. Accessibility could range between 0 (no elderly people in the municipality lived near a clinic) to 1 (all elderly people in the municipality lived near a clinic). We divided each municipality into 0.5-square-kilometre areas (termed “meshes”), each of which was subsequently associated with the number of people living in the area aged ≥75 years (data obtained from the 2010 Japan National Population Survey [6] ). We then located all clinics on this map of divided municipalities and established each clinic’s “reachable area” using the ArcGIS program (Esri, Redlands, CA, USA). Clinics’ reachable area covered the geographical area ≥10 minutes’ travel from the agency by car, not using highways. Figure 1 shows clinics with black triangles and reachable areas with gray shadows. Meshes fully within a reachable area were coded as “reachable meshes”; the population in these meshes was coded as “reachable population.” We calculated each municipality’s total reachable population. Finally, we calculated each municipality’s “reachable proportion” (i.e., the reachable population divided by the total elderly population. Reachable proportion = reachable population (number)/all of population in a municipality). These methods were developed through discussion with four public health nursing researchers and one geographic science researcher.
2.2. Measurement and Participants
Only disabled individuals (as identified by Japanese long-term care insurance level [7] ) aged ≥75 years were included. A care level of 1 (requires partial support) to 5 (requires maximum support) indicates that the individual requires support for activities of daily living. We analyzed medical insurance claim data from October 2012; the sample included 22,662 persons living in 13 municipalities regarding whom we could obtain data for all municipality characteristics.
2.3. Hospitalization Duration
Data regarding participants’ hospitalization duration were obtained as numerical data from health care claim data. This data was not normally distributed; therefore, it was converted to categorical data (0: ≤10 days in a single month, 1: ≥10 days hospitalized in a month). An additional category was constructed (0: ≤25 days, 1: ≥25 days) to allow this procedure’s effect on sensitivity to be monitored.
2.4. Individual Variables
Examined individual variables included age, sex, municipality of residence, and certified care level in October 2012. Age, sex, residence, and certified care level were collected from long-term care insurance claim data. Data on the presence of conditions or impairments in October 2012 and the following six months were collected from health care insurance claim data to account for these conditions’ or impairments’ subsequent development. Data on ten types of disease were collected, following the 10th version of the International Statistical Classification of Diseases and Related Health Problems; these were as follows: cancer (C00-97), cerebral vascular disorder (I60, I61, I63, I69.0, I69.1, I69.3), arthropathy (M15-19), fracture (S02, S12, S22, S32, S42, S52, S62, S72, S82, S92, T02, T08, T10, T12), pneumonia (J12-18), chronic obstructive pulmonary disease (J41-44), dementia (F01, F03, G30), psychiatric disorder (F20-48), neurological disorder (G00-29, G31-99), and ischemic heart disorder (I20-25).
2.5. Municipality Variables
We examined the quality of collaboration between physicians and care managers in each municipality. Care managers are professionals in Japanese home care management; collaboration between care managers and physicians was considered important to preventing long-term hospitalization and promoting smooth discharge from hospitals. We measured the quality of collaboration between physicians and local care managers using the existing prefecture public survey question “Do physicians and care managers in your municipality share their clients’ goals well?” Responses used a 5-point Likert scale (1 = not at all; 5 = completely); higher scores indicated better collaboration. The question was answered by public health center officers in 13 municipalities [8] .
2.6. Statistical Analysis
Municipality and individual demographic information were collated; hospitalization duration’s bivariate relationship with individual variables was subsequently analyzed. We then tested the fit of multilevel logistic models that included random intercepts for municipalities and individual- and municipality-level independent variables. Odds ratio was calculated for participants’ hospitalization duration (0: ≤10 days in a single month, 1: ≥10 days hospitalized in a month). Individual variables that were significant at p < 0.1 and all municipality variables were included in this model. Regression analysis was conducted using two models with independent variables set as clinic volume and clinic accessibility. All statistical analysis was performed using SPSS v. 21.
3. Results
Table 1 presents municipalities’ characteristics. Clinic volume ranged from 0.0 to 9.53 per 10,000 elderly people. Clinic accessibility ranged from 0.00 to 0.83. Five municipalities’ accessibility was <0.30; two scored >0.80. These indexes’ relationship was nonlinear.
Table 2 presents statistics describing individual variables and hospitalization duration. Among 22,662 participants, 2538 (11.2%) had been hospitalized for ≥10 days. Participants’ average age was 86.7 years; 28.1% were male. Over fifty percent were certified as care level 1 or 2 (25.4% and 24.8%, respectively). The most common condition or impairment was cerebral vascular disorder (11.5%), followed by dementia (11.2%).
Table 3 presents the results of analysis of hospitalization duration. Clinic volume and clinic accessibility were significantly negatively correlated with hospitalization of ≥10 days (OR: 0.944; confidence interval [CI]: 0.914 - 0.974 and OR: 0.713; CI: 0.553 - 0.921, respectively). This result was replicated in the longer ≥25-day duration category (OR: 0.916; CI: 0.870 - 0.963 and OR: 0.660; CI: 0.465 - 0.938, respectively).
4. Discussion
4.1. Clinic Volume and Accessibility
Clinic volume ranged between 0.0 and 9.53 per 10,000 elderly people; clinic accessibility ranged between 0.0 and 0.83. These indexes’ relationship was nonlinear; therefore, greater clinic volume did not entail greater clinic accessibility. Figure 1 illustrates that clinics were often concentrated in parts of each municipality where the population was dense. This trend supports reports on long-term care facility allocation stating that long-term

Table 1. Characteristics and sample size of municipalities.
Note: Quality of coordination: Quality of coordination between physicians and care managers.
Table 2. Participant characteristics and hospitalization duration.
Note: Numbers are N (%).
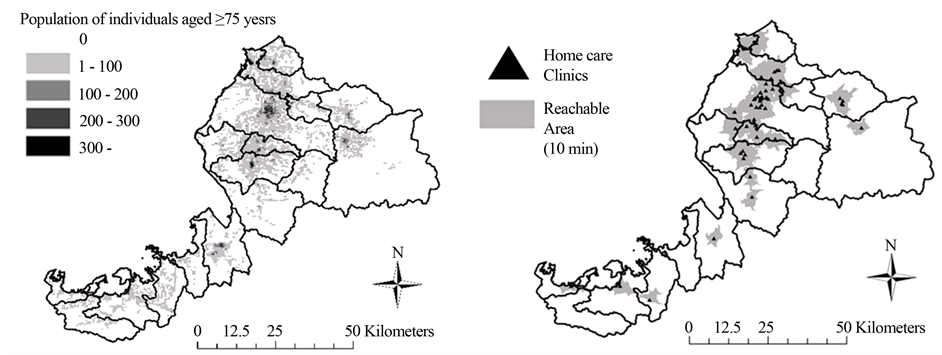
Figure 1. Distributuion of aged population (left) and home care clinics (right) for 17 municipalities.
care service providers are concentrated in urban areas due to greater market opportunities [9] . The clinics examined in this study may be distributed similarly to long-term care service providers, as both treat a similar population of disabled community-dwelling people. And it could relate to better appropriateness of accessibility
Table 3. Factors relating to hospitalization duration.
Note: OR = odds ratio, CI = confidence interval.
that people can receive treatment from outside of their own municipality; nevertheless they lived municipality with poor volume, they can use services from near clinics in neighbor municipality. Home care clinics are not homogeneously geographically distributed and arrowed to provide care for people who lived in other municipalities; therefore, clinics’ geographic accessibility more accurately indicates available clinic resources than clinic volume does.
4.2. Relationship between Accessibility and Hospitalization
Clinic volume and clinic accessibility were both significantly negatively correlated with hospitalization duration. This supports the Andersen-Newman model [2] , which proposes that increasing either service volume or service accessibility promotes service use and improves outcomes. Increased clinic volume or accessibility might be correlated with improved treatment and then reduced hospitalization duration among participants. This association has two likely causes: prevented hospitalization and reduced hospitalization duration. The former may reflect an increase in hospitalization avoidance through maximizing treatment quality; the latter may reflect a direct reduction in hospitalization duration. Continuity of care with the same physician has been found to prevent hospitalization and discharge delays [10] ; home care clinics may provide better continuity of care as they provide services to clients at all times of the day, every day.
The odds ratio of home care clinic volume was close to 1.0, whereas that of clinic accessibility was around 0.7. Nonetheless, due to clinics’ non-homogeneous geographic distribution and contribution in the regression analysis, we concluded that geographic accessibility better explains reductions in hospitalization duration. The implication for home care system development is that only focusing on volume of home care clinics within a community might lead to misunderstanding resource readiness. Communities constructing new home care clinics should prioritize geographic accessibility rather than clinic volume.
4.3. Limitations
This study has the following limitations. Our analysis did not address caregivers’ needs or detailed medical conditions; previous research has found that these factors are related to hospitalization duration [11] . Additionally, one rural prefecture containing 13 municipalities was analyzed; the present results therefore may not generalize to urban municipalities. Because of data limitation, we cannot include usage of home care clinics in analysis.
5. Conclusion
Volume and accessibility of home care clinics are negatively correlated with hospitalization duration. Home care clinics are not distributed homogeneously; clinic accessibility explains hospitalization duration better than clinic volume. Clinic accessibility more accurately indicates clinic allocation appropriateness than clinic volume.
Acknowledgements
Financial support for this study was provided by the Health Labor Sciences Research program in 2013 and 2014 and a Grant-in-Aid for Scientific Research (KAKENHI; Japan) in 2013. Professor Yasushi Iwamoto of the University of Tokyo was the chief of the study team for claim data analysis in the Fukui Gerontology Study. Associate Professor Ryoko Morozumi of the University of Toyama and Associate Professor Michio Yuda of Chukyo University were board members of the Fukui Gerontology Study; they contributed to claim data collection in this study. The authors would like to thank the staff of Fukui prefecture and the Institute of Gerontology at the University of Tokyo for their assistance in carrying out this research project.
Cite this paper
Takashi Naruse,Hiroshige Matsumoto,Natsuki Yamamoto,Satoko Nagata, (2016) Association between Geographic Accessibility of Home Care Clinics and Hospitalization in Japan Using Geographic Information Systems and Insurance Claim Data. Health,08,986-993. doi: 10.4236/health.2016.810102
References
- 1. Ministry of Health, Labour and Welfare, Zaitakuiryokaigorenkeisuishinjigyonotebikinitsuite (2015) Guidelines for Programs Establishing Home Care Medical and Long-Term Care Service Collaboration.
http://law.e-gov.go.jp/htmldata/H01/H01HO064.html - 2. Andersen, R. and Newman, J.F. (2005) Societal and Individual Determinants of Medical Care Utilization in the United States. The Milbank Quarterly, 83, 1-28.
- 3. Cinnamon, J., Schuurman, N. and Crooks, V.A. (2008) A Method to Determine Spatial Access to Specialized Palliative Care Services Using GIS. BMC Health Services Research, 8, 140.
- 4. Guagliardo, M.F. (2004) Spatial Accessibility of Primary Care: Concepts, Methods and Challenges. International Journal of Health Geographics, 3, 3.
- 5. Todd, A., Copeland, A., Husband, A., Kasim, A. and Bambra, C. (2015) Access All Areas? An Area-Level Analysis of Accessibility to General Practice and Community Pharmacy Services in England by Urbanity and Social Deprivation. BMJ Open, 5, e007328.
- 6. Ministry of Internal Affairs and Communications (2010) Japan Census.
http://www.stat.go.jp/data/kokusei/2010/ - 7. Shimizuya, S. (2013) The Future of Long-Term Care in Japan.
http://www.rieti.go.jp/jp/publications/summary/13070009.html - 8. Nagata, S. (2015) Reseputodetawokatsuyoshita ryoy-oubashoikouto saabisuriyonotsuisekichousanimotodsuku koukatekinachiikirenkeitaiseinomeikakuka [Exploring Effective within Community Collaboration System by Using Retrospective Cohort Survey]. Tokyo, Japan.
- 9. Miyazawa, H. (2003) Uneven Nursing Care Service Opportunity and the Behavior of Service Providers under the Long-Term Care Insurance System. Geographical Review of Japan, 76, 59-80.
- 10. Gruneir, A., Bronskill, S.E., Maxwell, C.J., Bai, Y.Q., Kone, A.J., Thavorn, K., Petrosyan, Y., Calzavara, A. and Wodchis, W.P. (2016) The Association between Multimorbidity and Hospitalization Is Modified by Individual Demographics and Physician Continuity of Care: A Retrospective Cohort Study. BMC Health Services Research, 16, 154.
- 11. Fukui, S., Kawagoe, H., Masako, S., Noriko, N., Hiroko, N. and Toshie, M. (2003) Determinants of the Place of Death among Terminally Ill Cancer Patients under Home Hospice Care in Japan. Palliative Medicine, 17, 445-453.
NOTES

*Corresponding author.