Health
Vol. 4 No. 6 (2012) , Article ID: 19712 , 7 pages DOI:10.4236/health.2012.46055
Longitudinal evaluation of mineral loss at the earliest stage of enamel demineralization using micro-computed tomography
![]()
Division of Pediatric Dentistry, Department of Human Development & Fostering, School of Dentistry, Meikai University, Sakado, Japan; *Corresponding Author: k-watanabe@dent.meikai.ac.jp
Received 21 March 2012; revised 11 April 2012; accepted 30 April 2012
Keywords: Mineral Density; Micro-CT; Demineralization; Bovine Enamel; Over Time Evaluation
ABSTRACT
As the prevalence of dental caries decreases, the diagnosis and treatment of initial mineral loss resulting in white spot lesions have been getting more and more important. Since dental CT provides computed tomography images of a tooth with radiation exposure similar to panoramic radiography, it will become possible in the near future to evaluate the enamel mineral density using CT in the same way as measurement of the bone mineral density. Such computed tomography images enable dentists to perform longitudinal, three-dimensional, and precise evaluation of the enamel mineral density before a demineralized lesion becomes detectable by any other traditional means. Despite their advantage, there are not enough reports on evaluation of the enamel mineral density using CT. This study evaluated the serial changes in mineral density in the earliest stage of enamel demineralization. Eight bovine enamel specimens were coated with nail varnish. On each specimen, 4 square windows measuring 1 mm2 were created. The specimens were incubated in lactic acid solution at 38˚C. During incubation, the windows were covered by nail varnish one by one at 30, 60, and 90 minutes, respectively. At 120 minutes, the specimens were removed from the solution. After the nail varnish was removed, X-ray microradiography was performed using SKYSCAN1172 at settings of 100 kV and 100 µA. The mean Hounsfield unit values (HUV) of enamel in a non-window area and those in the window areas were calculated every 180 µm over a depth of 0 - 900 µm and analyzed by two-way ANOVA. Data were affected by the incubation time and depth from the enamel surface, and there was not interaction between the two factors. Considering the incubation time, HUV of the whole measured enamel (0 - 900 µm) in the non-window group was significantly higher than that of the other incubated groups. Considering the depth, HUV was decreased at 721 - 900 µm compared with that at 0 - 180 µm in the 30-minute-incubated group, and the decrease spread to 361 - 900 µm in the 60- and 90-minutes-incubated groups. HUV was additionally calculated at increments of 18 µm and compared within the 60-minute-incubated group, and changes in the mineral density at the boundary of the earliest demineralized lesion could be observed. This study demonstrated detailed mineral density changes in the earliest period of demineralization.
1. INTRODUCTION
The crystal structure of hydroxyapatite in enamel is immature when a tooth erupts, and it gradually matures after tooth eruption because of minerals in oral fluid, water, food, etc. Under normal conditions, oral fluids are supersaturated with respect to hydroxyapatite. However, when the pH of oral fluid reduces below the critical pH, the supersaturation with respect to hydroxyapatite is replaced by undersaturation [1], resulting in the mineral loss (demineralization) of enamel. When the pH reduction is due to bacteria-derived acid production, this mineral loss is called caries. On the other hand, when it is due to non-bacteria-derived acid, the mineral loss is called erosion. In the present study, erosion-induced lesions were evaluated because bacterial factors could be ignored in the analysis. The authors divided demineralization into three major stages: First, mineral loss begins in enamel. In this stage, the lesion is not detectable by traditional means, such as TMR (Transverse Microradiography) or QLF (Quantitative Light-induced Fluorescence). Second, the demineralized lesion becomes detectable by traditional means. In this stage, the demineralized lesion can be found as a white spot in enamel tissue; however, no cavity has yet been formed. Third, the demineralized lesion forms a cavity. In this stage, the lesion can be recognized easily through inspection.
In order to detect the earliest stages of demineralization of enamel before the lesion becomes visible or detectable by traditional means, we performed digitalization of the mineral density. There are certain factors involved in the decay of enamel crystals in the oral cavity, such as acid-producing bacteria and the frequent intake of fermentable carbohydrates. At the same time, demineralized enamel crystals can be remineralized through the uptake of fluoride derived from food or drinking water, saliva components like calcium, and other processes. When the pathological factors outweigh the protective factors, demineralization progresses [2,3]. Demineralization begins by the elution of mineral from enamel into the oral cavity, resulting in a white spot lesion; thus, it is important to observe the time course of changes in the mineral density in order to detect the earliest stages of demineralization, before it can be recognized macroscopically. Magalhães et al. [4] evaluated enamel caries lesions by TMR, and Buchalla et al. [5] reported the mineral concentration of artificial enamel caries lesions using a scanning electron microscope (SEM). Using these methods, it is not possible to observe the time course of changes in mineral density using the same samples because the methods are invasive. As a noninvasive method, QLF can assess subsurface lesions [6,7]. However, QLF is available only when the lesion is visible; it is too late to detect or evaluate the earliest stage of mineral leakage since the very early stage of enamel demineralization cannot be detected macroscopically. Moreover, it is not possible to select a range of measurement depths for assessment by QLF. In some recent studies, X-ray microtomography was used in order to analyze the mineral density of sound [8], demineralized [9], and hypomineralized [10,11] enamel. X-ray microtomography is a valuable means of assessing the time course of mineral density changes because it allows the noninvasive evaluation. Moreover, researchers can determine the mineral density at various depths of enamel in µm by setting a region of interest (ROI) on every cross-section and then selecting the cross-sections to be measured. Despite the advantages of using X-ray microtomography, mineral fluctuation in the very early stage of enamel demineralization has not been sufficiently reported [12]. In the present study, artificial enamel demineralization was performed in 8 bovine teeth using a lactic acid solution, which contained 0.1 M lactic acid and 6 wt% CM-cellulose. Then, the time course of changes in the mineral density and mineral loss in the earliest stage of enamel demineralization were evaluated using micro-CT.
2. MATERIALS AND METHODS
2.1. Demineralization of Enamel
The labial surfaces of 8 bovine incisors were polished using 400-, 600-, and 800-grit silicon carbide abrasive papers to remove extraneous matter from the enamel surface, and cut into specimens measuring 10-by-10 mm with a thickness of 5 mm. The specimens were covered with nail varnish (SUNPALKO CO., LTD., Kyoto, Japan), after using tape to mask 4 square windows measuring 1 mm2 on the enamel surface. After removing the masking tape, the specimens were incubated in lactic acid solution that contained 0.1 M of lactic acid and 6 wt% of CM-cellulose (pH 3.7) (Wako Pure Chemical Industries, Ltd., Osaka, Japan) at 38˚C. At specific time points during incubation, one window on each specimen was washed with ultra-pure water and then covered over with nail varnish, one by one at 30, 60, and 90 minutes. At 120 minutes, the specimens were removed from the solution.
2.2. Classification of the Windows
Enamel to a depth of 900 µm below the surface in sound portions and window areas was classified into the following 5 time-dependent groups depending on the exposure time to lactic acid solution: sound enamel that was covered by nail varnish and not exposed to lactic acid solution during incubation was classified as the ST group, and enamel in a window area exposed to lactic acid solution for 30, 60, 90, or 120 minutes was classified as the DC30, DC60, DC90, or DC120 group, respectively. The same enamel regions were also classified into 5 depth-dependent groups depending on the depth from the enamel surface (D): 0 < D ≤ 180 µm, 180 < D ≤ 360 µm, 360 < D ≤ 540 µm, 540 < D ≤ 720 µm, and 720 < D ≤ 900 µm groups. Statistical analyses were carried out among time-dependent and/or depth-dependent groups.
2.3. X-Ray Microtomography
Since the window areas were not necessarily visually recognizable after the nail varnish was removed, the boundaries of the window areas were marked by a diamond band saw. After nail varnish was removed, microcomputed tomographic images of the crowns were obtained parallel to the enamel surface using SKYSCAN1172 (SKYSCAN, Kontich, Belgium) under the following conditions: selection of high-resolution camera (1280 × 1024 pixels), source voltage of 100 kV, source current of 100 µA, image pixel size of 18 µm, frame averaging of 3, random movement of 10, Al filter, rotation step of 0.3 degrees, 360 degree-rotation, flat field correction. SKYSCAN1172 can obtain a spatial resolution of 18 µm.
2.4. Measurement of Hounsfield Unit Value (HUV) in Enamel
When X-rays travel through a certain object, the X-ray density is reduced based on the object’s radiolucency. In terms of calcified tissues, the X-ray density which traveled through a calcified tissue directly reflects the tissue’s mineral density. According to the instruction manual provided by the manufacturer, Hounfield units are a standard unit of X-ray CT density, in which air and water are ascribed values of 0 and 1000, respectively. It has been found over several decades of CT imaging to be a useful general CT density calibration owing to the approximate linearity of the calibration curve of materials with a different X-ray density, such that calibration with air and water data points gives a useful and highly reproducible reference curve even for materials (such as biological calcified tissue) with a CT density significantly higher than that of water. It is conventional to displace the HUV downwards by 1000 units, so that the values for air and water are –1000 and 0, respectively. In the present study, the conventional displacement was adopted.
Before the HUVs of enamel were calculated, microcomputed tomography images of air and water were also taken under the same conditions as enamel, and NRecon Version 1.6.1.5 (SKYSCAN, Kontich, Belgium) and CTanalyser Version 1.8.1.5 (SKYSCAN, Kontich, Belgium) were calibrated properly following the instruction manual provided by the manufacturer: contrast limit in reconstruction: 0 - 0.083359, and density range in calculation of HUV: –1000 - 15,241. The cross-sectional images were reconstructed by NRecon Version 1.6.1.5., and then the HUVs were calculated using CTanalyser Version 1.8.1.5. In each cross-sectional image, every whole window area was set as the ROI for each group except the ST group, and a randomly selected non-window area was set as the ROI for the ST group in the same shape as the other windows. The measurements were carried out every 180 µm from the enamel surface to a depth of 900 µm in each sound and window enamel region.
The experimental procedure was approved by the ethical committee for animal experiments of Meikai University.
2.5. Statistical Analysis
Data in the text, tables, and figures are shown as the mean ± S.D. The significance of differences between two groups was analyzed using the unpaired Student’s t-test after testing for equal variance. A two-way ANOVA test was used to detect the significance of data according to the acid exposure time and depth from the enamel surface. Tukey’s HSD was performed for multiple comparisons among three or more independent groups. A p-value < 0.05 was considered significant.
3. RESULTS
The two-way ANOVA test showed that the main effects of the acid exposure time and depth from the enamel surface were significant (p < 0.01, respectively). It also showed that there was no interaction between the acid exposure time and depth from the enamel surface. The sum of squares of the acid exposure time and depth from the enamel surface occupied 78% and 15% of the total sum of squares, respectively, which meant data were mostly affected by the acid exposure time and depth from the enamel surface, and were hardly affected by variation of the specimen. Considering these results, we deemed that we could compare the HUV among timedependent groups or among depth-dependent groups within each time-dependent group in our study. Table 1 shows HUVs of the ST, DC30, DC60, DC90, and DC120 groups (0< D ≤ 900 µm). The HUV of the ST group (5195 ± 669) was significantly higher than those of the other four time-dependent groups (p < 0.01). Focusing on the depth from the enamel surface in each time-dependent group, no significant difference was found in HUVs among the depth-dependent groups in the ST group (Figure 1). However, as shown in Figure 2, the HUV of the 0 < D ≤ 180-µm group (2869 ± 569) was significantly higher than that of the 720 < D ≤ 900-µm group (1851 ± 507) in the DC30 group (p < 0.05). Moreover,
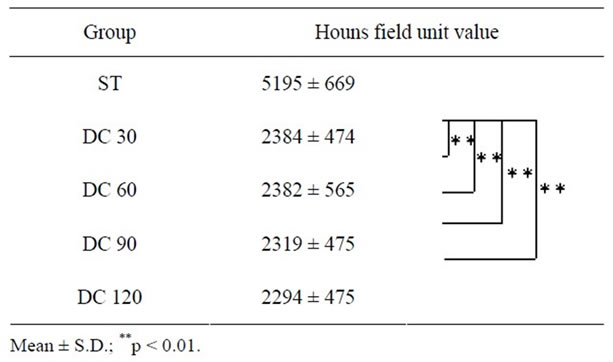
Table 1. HUV based on exposure to lactic acid solution over time. Enamel that was not exposed to lactic acid solution during incubation was classified as the ST group, and enamel in a window area exposed to lactic acid solution for 30, 60, 90, or 120 minutes was classified as the DC30, DC60, DC90, or DC120 group, respectively.
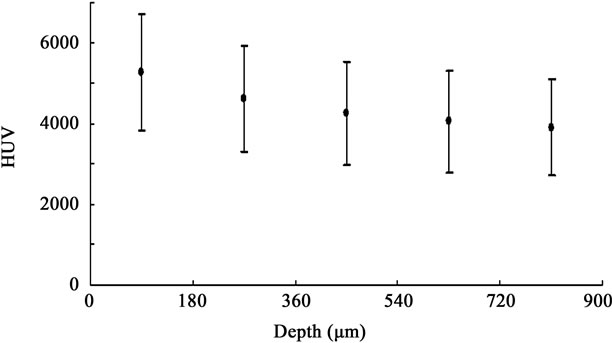
Figure 1. HUV of depth-dependent groups in the ST group. HUV declined with depth from the enamel surface; however, there was no significant difference among the groups.
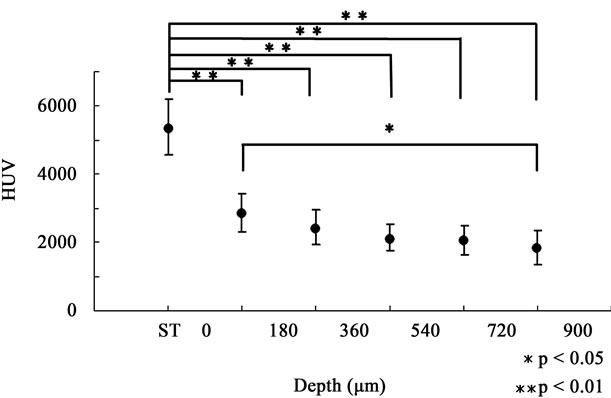
Figure 2. HUV of depth-dependent groups in the DC30 group. Since a significant difference was not found in Figure 1, the HUV of the ST group in Table 1 was used as standard in Figures 2-5. HUV of 0 < D ≤ 180 µm was significantly higher than that of 720 < D ≤ 900 µm (p < 0.05), which seemed to be the beginning of the demineralization.
in the DC60 and DC 90 groups, the HUV of the 0 < D ≤ 180-µm group (3005 ± 568 and 3063 ± 777, respectively) was significantly higher than that of the 360 < D ≤ 540-µm (1991 ± 442 and 1948 ± 476, respectively) (p < 0.01), 540 < D ≤ 720-µm (1790 ± 335 and 1718 ± 447, respectively) (p < 0.01), and 720 < D ≤ 900-µm (1619 ± 413 and 1577 ± 398, respectively) (p < 0.01) groups, as shown in Figures 3 and 4. There was no significant difference among the depth-dependent groups in the DC120 group (Figure 5). The HUV of the ST group was significantly higher than those of all the HUVs of all depthdependent groups in DC30, DC60, DC90, and DC120 groups (p < 0.01).
4. DISCUSSION
Mineral density often plays an important role in the assessment of hard tissue since it reflects both the quality and quantity of mineralized tissues, and the HUV is one of the parameters commonly used for measuring the mineral density of hard tissues [13-16].
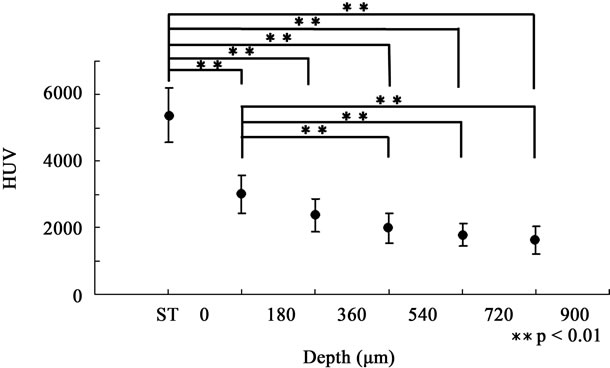
Figure 3. HUV of depth-dependent groups in the DC60 group. HUV of 0 < D ≤ 180 µm was significantly higher than those of the 360 < D ≤ 540-µm, 540 < D ≤ 720-µm, and 720 < D ≤ 900-µm groups, respectively (p < 0.01). The demineralized region found in Figure 2 seemed to expand toward the enamel surface.

Figure 4. HUV of depth-dependent groups in the DC90 group. The tendency was the same as that in the DC60 group.
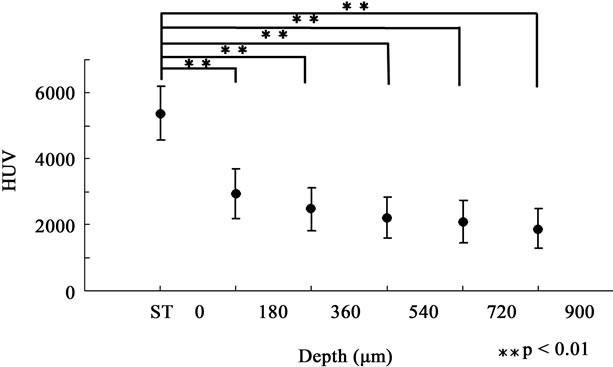
Figure 5. HUV of depth-dependent groups in the DC120 group. There was no significant difference among the groups. The demineralized region seemed to reach the enamel surface in the DC120 group.
In the present study, although a significant difference was not observed, the mineral density of sound enamel showed a peak on the enamel surface and gradually decreased with depth from the surface. Wong et al. [17] reported in their study on mineral concentration in a sound deciduous human molar that there was a gradient of increasing mineral concentration from the amelodentinal junction towards the natural surface, which supports our findings.
As shown in Table 1, once the enamel was exposed to lactic acid, the mean mineral density of 0 < D ≤ 900 µm decreased by about 54% within 30 minutes and then maintained an almost stable level for the following 90 minutes. Detailed assessments among the groups based on depth from the enamel surface for each acid exposure time showed that the most severely demineralized lesion occurred at a depth of 720 < D ≤ 900 µm in the DC30 group, which seemed to be the very beginning of demineralization (Figure 2). Then, the lesion seemed to become exacerbated and expand towards the enamel surface, reaching a depth of 360 < D ≤ 540 µm in the DC60 and DC90 groups (Figures 3 and 4). Finally, the mineral density in all 5 depth-dependent groups became statistically equal in the DC120 group (Figure 5), indicating that the severely demineralized lesion that was found at a depth of 720 < D ≤ 900 µm in the DC30 group had reached the enamel surface. Our findings also indicated that the expansion of the early demineralized lesion had its own irregular pace in reaching the enamel surface: demineralization occurred at a depth of 720 < D ≤ 900 µm during the initial 30 minutes of demineralization, and reached a depth of 360 < D ≤ 540 µm by 60 minutes of demineralization; however, expansion seemed to stop during the following 30 minutes. This phenomenon could be the result of the higher distribution of fluoride in the enamel surface [18].
In a study on subsurface lesions in human enamel caused by exposure to 1 M HCl [19], the mean depth of softening enamel was 2.4 µm. Arnold et al. [20] also reported that a subsurface lesion ranges from 90 to 250 µm in their experiment on caries-like lesions in an experimental dental plaque biofilm model using human molars. Of course, it is not possible to directly compare their findings with ours since their experimental methods were different from ours as well as a potential difference in reaction to acid exposure between bovine and human enamel [21]. Furthermore, the previous reports dealt with “softening” enamel or a “subsurface lesion” which could be visible as a white spot or might be detected as radiolucency. Therefore, such lesions could be in later stages than the initial mineral loss in our study.
Our study indicated that severe mineral loss was initially identified at a depth of 720 < D ≤ 900 µm. It is known that the porosity of enamel increases in accordance with the enlargement of intercrystalline spaces when the enamel is subject to cariogenic challenges [1]. It has also been reported that demineralization expands into sound enamel following the direction of enamel prisms and perpendicularly to the striae of Retzius [20]. Considering these reports, our findings suggest that lactic acid traveled through enamel along enamel prisms, increasing enamel porosity, and resulting in severe mineral loss at a deeper level which had a lower mineral concentration [17].
In this study, initial mineral loss and its expansion due to demineralization were observed, so, in order to observe the detailed depth-based fluctuation in the enamel mineral density around the boundary of the very early and severely demineralized region, the HUV was additionally measured at increments of 18 µm from the enamel surface within a depth of 0 < D ≤ 900 µm in the DC60 group, and the finding at 18 µm from the surface was statistically compared with those at other depths.
As shown in Figure 6, the HUV began to decrease at a depth of 54 < D ≤ 72 µm from the enamel surface following a slight rise at 36 < D ≤ 54 µm. The HUV continued to decrease with the depth, showing significant differences of <0.05 and <0.01 in the levels of 144 < D ≤ 216 µm and 216 < D ≤ 900 µm, respectively, compared with that of 18 µm from the surface. Interestingly, the HUV went up a little once again at a depth of 270 < D ≤ 288 µm. It was near the depth of 216 < D ≤ 234 µm where the significance of the difference exceeded 0.01. These findings suggested that the boundary of the very early demineralized region could be around a depth of 216 < D ≤ 288 µm in the DC60 group, and there could be a high mineral distribution near the enamel surface and the boundary of the very early and severely demineralized region, which could promote enamel’s protection against demineralization. Enamel is the outer layer of the tooth, providing protection against mechanical damage during dental functions [22], and the enamel surface could be the most protective barrier against both mechanical and chemical invasion. Moreover, the enamel surface is
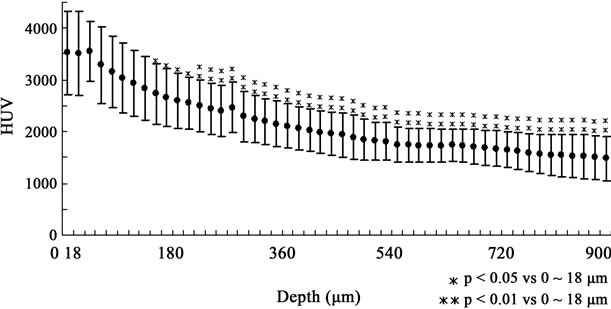
Figure 6. Details of HUV fluctuation in the DC60 group. HUV was measured at increments of 18 µm and findings at the surface to 18 µm were compared with those at other depths. HUV showed a gradient of decreasing mineral density; however, slight increases in HUV were found twice. These differences were not significant, so it has not yet been clarified whether these increases played a certain role in protection against demineralization.
always covered with oral fluid, which provides some cariostatic ingredients such as fluoride to the tooth surface, resulting in a higher distribution of cariostatic components in the enamel surface [18].
Early demineralized lesions have been receiving more attention since the prevalence of dental caries has decreased in many countries including Japan, and since eroded lesions due to an excessive intake of some acidic foods or drinks have been becoming a social problem in Japan. However, there have not been enough reports on the development, expansion, and fluctuations of the mineral density in demineralized regions. Demineralization is initiated as a white spot lesion, and white spot lesions begin with mineral removal from enamel crystals. Thus, it is very important to measure the mineral density at the very beginning of mineral loss, and to assess the time course of changes in mineral density around the lesion. Although it is not currently possible to assess the mineral density of enamel by CT in daily clinical practice, some CT devices developed for dental clinical practice provide computed tomography images of a tooth with a radiation exposure similar to panoramic radiography, which is often used in daily clinical practice. Moreover, findings from this kind of in vitro study can contribute to improving the pathological understanding of the earliest enamel demineralization, and to upgrading the diagnostic methods before the formation of white spot lesions.
5. CONCLUSIONS
In order to evaluate time course changes in the enamel mineral density with a noninvasive method during demineralization, the mineral density of bovine enamel was measured using micro-CT and compared among different demineralized times or depths from the enamel surface. This study suggested that:
• Mineral density in enamel decreases within 30 minutes after immersion in acid solution, and maintains an almost stable level for the following 90 minutes.
• Mineral density decreases at a depth of 720 - 900 µm and the lesion expands toward the enamel surface.
• There could be a high mineral distribution near the enamel surface and boundary of the very early and severely demineralized region, which could promote enamel’s protection against deminera-lization.
• CT could be an efficient and useful means of diagnosing enamel demineralization in the very early stage.
6. ACKNOWLEDGEMENTS
We would like to thank Ms. Eri Tamura (TOYO Corporation, Tokyo, Japan) and Ms. Ryoko Kato (TOYO Corporation, Tokyo, Japan) for providing technical advice in obtaining measurements with SKYSCAN1172.
![]()
![]()
REFERENCES
- Ten Cate, J.M., Larsen, M.J., Pearce, E.I.F. and Fejerskov, O. (2008) Dental caries the disease and its clinical Management. 2nd Edition, John Wiley & Sons Ltd., Chichester.
- Featherstone, J.D. (2004) The caries balance: The basis for caries management by risk assessment. Oral Health & Preventive Dentistry, 2, 259-264.
- Featherstone, J.D. (2006) Caries prevention and reversal based on the caries balance. Pediatric Dentistry, 28, 128- 132.
- Magalhães, A.C., Moron, B.M., Comar, L.P., Wiegand, A., Buchalla, W. and Buzalaf, M.A. (2009) Comparison of cross-sectional hardness and transverse microradiography of artificial carious enamel lesions induced by different demineralising solutions and gels. Caries Research, 43, 474-483. doi:10.1159/000264685
- Buchalla, W., Imfeld, T., Attin, T., Swain, M.V. and Schmidlin, P.R. (2008) Relationship between nanohardness and mineral content of artificial carious enamel lesions. Caries Research, 42, 157-163. doi:10.1159/000128559
- Rousseau, C., Vaidya, S., Creanor, S.L., Hall, A.F., Girkin, J.M., Whitters, C.J., Strang, R. and McHugh, S. (2002) The effect of dentine on fluorescence measurements of enamel lesions in vitro. Caries Research, 36, 381-385. doi:10.1159/000066533
- Pretty, I.A., Edgar, W.M. and Higham, S.M. (2003) The erosive potential of commercially available mouthrinses on enamel as measured by Quantitative Light-induced Fluorescence (QLF). Journal of Dentistry, 31, 313-319. doi:10.1016/S0300-5712(03)00067-8
- Clementino-Luedemann, T.N. and Kunzelmann, K.H. (2006) Mineral concentration of natural human teeth by a commercial micro-CT. Dental Materials Journal, 25, 113-119. doi:10.4012/dmj.25.113
- Huang, T.T., Jones, A.S., He, L.H., Darendeliler, M.A. and Swain, M.V. (2007) Characterisation of enamel white spot lesions using X-ray micro-tomography. Journal of Dentistry, 35, 737-743. doi:10.1016/j.jdent.2007.06.001
- Fearne, J., Anderson, P. and Davis, G.R. (2004) 3D X-ray microscopic study of the extent of variations in enamel density in first permanent molars with idiopathic enamel hypomineralisation. British Dental Journal, 196, 634-638. doi:10.1038/sj.bdj.4811282
- Farah, R.A., Swain, M.V., Drummond, B.K., Cook, R. and Atieh, M. (2010) Mineral density of hypomineralised enamel. Journal of Dentistry, 38, 50-58. doi:10.1016/j.jdent.2009.09.002
- Dowker, S.E., Elliott, J.C., Davis, G.R. and Wassif, H.S. (2003) Longitudinal study of the three-dimensional development of subsurface enamel lesions during in vitro demineralisation. Caries Research, 37, 237-245. doi:10.1159/000070865
- Shapurian, T., Damoulis, P.D., Reiser, G.M., Griffin, T.J. and Rand, W.M. (2006) Quantitative evaluation of bone density using the Hounsfield index. International Journal of Oral and Maxillofacial Implants, 21, 290-297.
- De Oliveira, R.C., Leles, C.R., Normanha, L.M., Lindh, C. and Ribeiro-Rotta, R.F. (2008) Assessments of trabecular bone density at implant sites on CT images. Oral Surgery, Oral Medicine, Oral Pathology, Oral Radiology & Endodontics, 105, 231-238. doi:10.1016/j.tripleo.2007.08.007
- Park, H.S., Lee, Y.J., Jeong, S.H. and Kwon, T.G. (2008) Density of the alveolar and basal bones of the maxilla and the mandible. American Journal of Orthodontics and Dentofacial Orthopedics, 133, 30-37. doi:10.1016/j.ajodo.2006.01.044
- Turkyilmaz, I., Ozan, O., Yilmaz, B. and Ersoy, A.E. (2008) Determination of bone quality of 372 implant recipient sites using Hounsfield unit from mputerized tomography: A clinical study. Clinical Implant Dentistry and Related Research, 10, 238-244. doi:10.1111/j.1708-8208.2008.00085.x
- Wong, F.S., Anderson, P., Fan, H. and Davis, G.R. (2004) X-ray microtomographic study of mineral concentration distribution in deciduous enamel. Archives of Oral Biology, 49, 937-944. doi:10.1016/j.archoralbio.2004.05.011
- Weatherell, J.A., Robinson, C., Schaper, R. and Künzel, W. (1983) Distribution of fluoride in clinically sound enamel surfaces of permanent upper incisors. Caries Research, 17, 118-124. doi:10.1159/000260659
- Eisenburger, M. (2009) Degree of mineral loss in softened human enamel after acid erosion measured by chemical analysis. Journal of Dentistry, 37, 491-494. doi:10.1016/j.jdent.2009.02.001
- Arnold, W.H., Gaengler, P., Sabov, K., Schmitz, I., Gedalia, I. and Steinberg, D. (2001) Induction and 3D reconstruction of caries-like lesions in an experimental dental plaque biofilm model. Journal of Oral Rehabilitation, 28, 748-754. doi:10.1046/j.1365-2842.2001.00755.x
- Tanaka, J.L., Medici Filho, E., Salgado, J.A., Salgado, M.A., Moraes, L.C., Moraes, M.E. and Castilho, J.C. (2008) Comparative analysis of human and bovine teeth: Radiographic density. Brazilian Oral Research, 22, 346- 351. doi:10.1590/S1806-83242008000400011
- Tanaka, R., Shibata, Y., Manabe, A. and Miyazaki, T. (2009) Mineralization potential of polarized dental enamel. PLoS One, 4, e5986. doi:10.1371/journal.pone.0005986