Engineering
Vol. 4 No. 9 (2012) , Article ID: 23242 , 4 pages DOI:10.4236/eng.2012.49072
An Experimental Study for Construction of Emergency Spillway in Daechung Dam
Department of Water Resource Research, Korea Institute of Construction Technology, Ilsan, Korea
Email: yeo917@kict.re.kr, jgkang02@kict.re.kr, kikimorah@kict.re.kr
Received June 14, 2012; revised July 16, 2012; accepted July 26, 2012
Keywords: Hydraulic model; Emergency spillway; Energy dissipater; Design conditions
ABSTRACT
Recently, the flood frequently happened by several effects, such as El Nino et al., is the meteorological accident to attack the stability of dam. Hence, it was necessary to increase the stability of existing dam and dam design criteria were reinforced with probable maximum flood. This study was conducted in order to install the emergency spillway in Daechung Dam. Daechung Dam is located in the upper course of Guem River, in the middle of Korea, near a Sobak mountain range. The stream length and area of Daechung Dam are each about 401 km, about 9886 km2. According to the Report of new training project in Daechung Dam published in 2004 year, Maximum flood water level of Daechung Dam was calculated EL. 84.18 m increased of previous maximum flood water level (EL. 83 m). The aim of this study is to make an alternative plan on problems predicted by analysis of experimental data which is the results on the hydraulic model on dam structures. Analysis of experimental results was classified dam structures, such as approach channel, spillway, energy dissipater and stream, by design conditions.
1. Introduction
As the cases of abnormal flood influencing the safety of dam owing to weather calamity is frequently happened, safety consideration for the majority number of conventional dams is demanded, and this weather calamity is being recognized as the one of weather phenomenon in Korea. Therefore, decision of design floodwater is strengthened to select possible maximum floodwater in dam design standard [1] if there is no specific reason to secure the safety of dam. In accordance with the report of Daechung dam flood control capability enhancement report [2], maximum raising water level was EL. 84.18 m which is 1.18 m higher than the height of dam (EL. 83 m) from speculated result of possible maximum rainfall based on latest major flood cases. Thus, to secure the safety of dam in case of abnormal flood, flood control capability enhancement project for Daechung dam is to be needed.
Basic plans for flood control capability enhancement project for Daechung dam such as the consideration for optimum flood control capability enhancement method, location type and optimum dimension of emergency spillway, arrangement plan of major structures, speculation of project budget, etc., was established in Oct., 2004.
The aim of the study herein is to verify irrigating phenomenon of basic design plan for emergency spillway related to Daechung dam emergency spillway installation work through hydraulic model test.
The purpose of the project is to anticipate the parts which possibly generate the problem in design through carrying out hydraulic model test for emergency spillway, provides the complement for the problem with carrying out hydraulic model test for the countermeasures if necessary, and provides related data for carrying out the optimum structure design.
2. Site and Design Proposal
Daechung dam is neighboring to Chungwon-gun and Boeun-gun in Chungbuk and Daeduk-gu, Donggu in Daejeon-city, and located in the upper of the Keum-river which is originated from the highest peak of Sobaek mountain range, flowing from inland of the central part to western sea along 401 km with 9886 km3 river valley that is 10% of the whole area of Korea. Daechung dam, located at around 150.0 km upper the mouth of Keumriver was built in June, 1981 and has been operated by Korea water resource corporation.
There are composite type main dam (concrete gravity type dam and central hearting type stone block dam) and pondage dam which has 1.49 billion m3 pondage which is the longest lake with 86 km in Korea (Table 1). There are 3 auxiliary dams around main dam not to flood the water to other regions, and a raceway to provide the water to Daejeon and Chungju area with 90,000 KW hydropower plant. With the completion of dam construction, prevention of flood damage in the downstream region, supply of agricultural water to farms around the downstream and living water and industrial water to vicinity cities where its population is rapidly increasing. The region is mostly surrounded by mountains and residence area is accumulated at around 6 km of the downstream with establishing small-sized farms along the valley (see Figure 1).
Rigid ROM (II) control method is selected for the optimum flood control plan of emergency spillway installation method selected in basic plan. Rigid ROM (II) is advantageous to apply for reservoir flood control capacity in maximum, and have less flood damage at the downstream in case of less frequent flood than Rigid ROM (I). However, downstream flood damage is expected since it’s expected discharging amount is increased by 1293 m3/s, so that establishment of river flood control plan is needed. From the result based on basic plan report in accordance with Rigid ROM (II) method, its maximum discharging amount is 7239 m3/s in case of 100 years frequency expected flood intake which flood can be controlled by main dam spillway, and maximum discharging amount in case of PMF intake is 18,036 m3/s which is analyzed to discharge 10,452 m3/s through main dam spillway and 7584 m3/s through emergency spillway. The water level of reservoir of 100 years frequency flood and PMF (Probably Maximum Flood) is EL. 79.97 m and 80.77 m in this case.
The basic plan applied for the experiment herein is designed to the 1st dam located at around 2.8 km in left bank upstream from main dam and opencut overflow typed spillway at valley part of auxiliary dam downstream. The waterway forms very gentle slope (1:50) with around 1.2 km long and 100 - 150 m wide, and joins
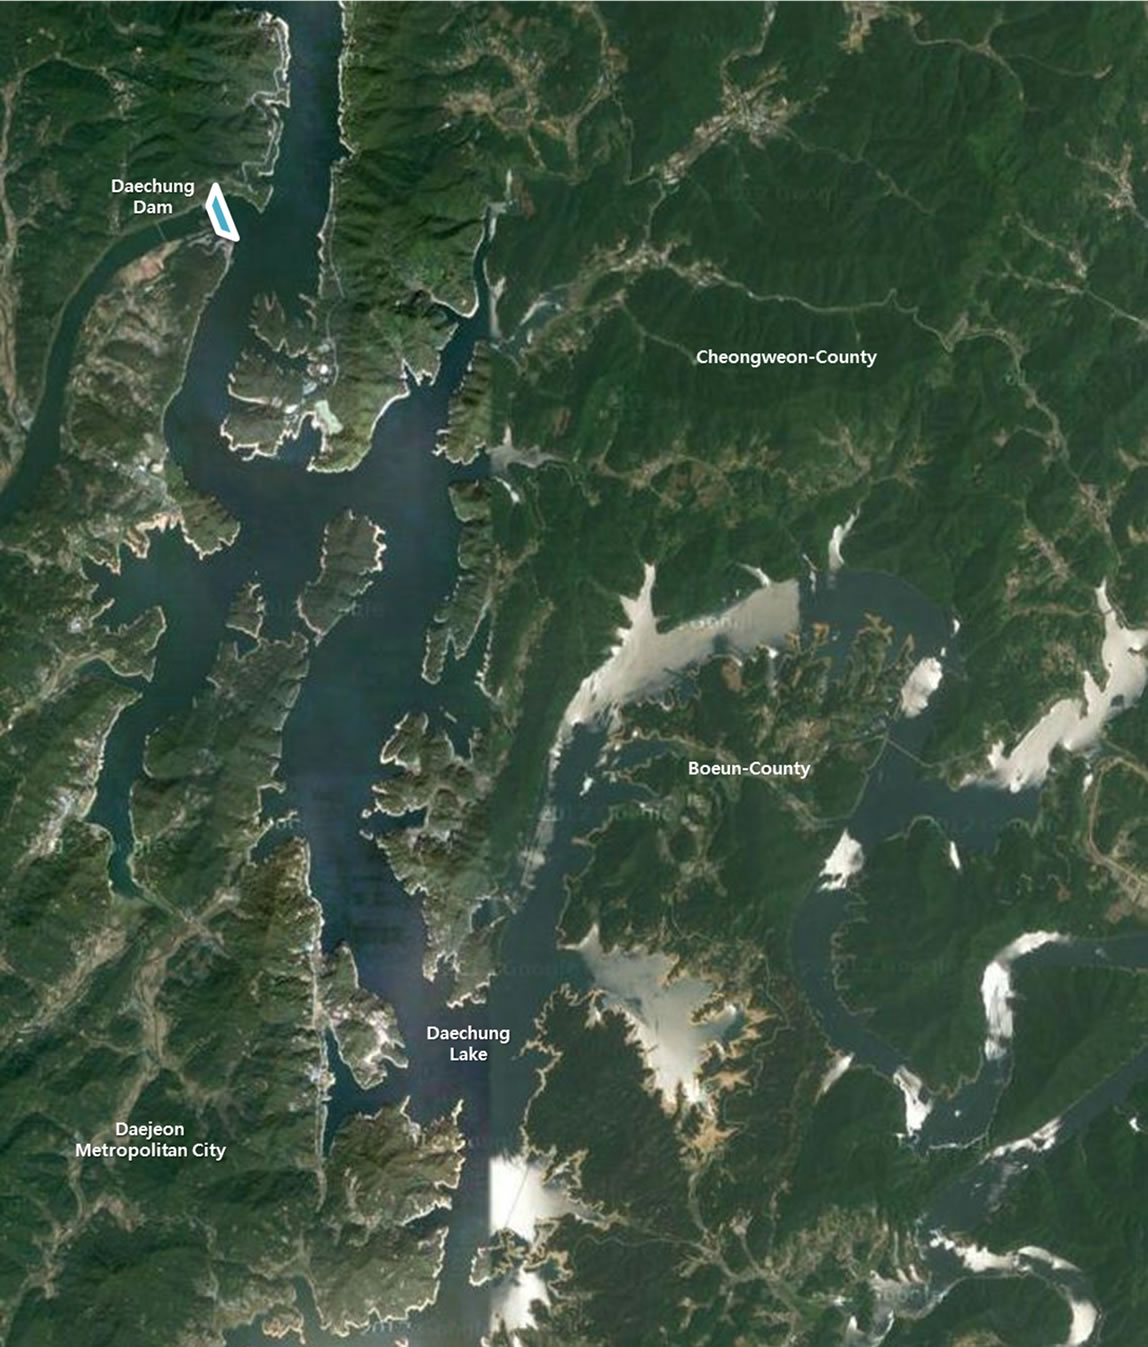
Figure 1. Vicinity status of Daechung Dam (google earth).
to the main stream at 1.7 km upstream. Basic plan is advantageous for comfortable installation, cost-effectiveness and comfortable maintenance rather than tunnel type.
Overflowing weir is designed with application of American waterways experiment station as it is shown in Figure 2. The comparison of major specifications of Daechung dam in accordance with emergency spillway basic plan is as follows.
3. Experiment Setup
Model scaling is decided with general consideration of the dimension which is able to guarantee the contents of experiment, experimental conditions and effectiveness of similarity law, and the dimension of experimental facility such as flux provision capability, size of laboratory, etc. The flow of spillway, pool and river downstream as a target of this experiment is governed by inertia and gravity force, and Froude similarity law can be applied as similarity law. Since similarity law exactly applies the influence of major force which governs original form to the model, the same control force should control in the model either. However, for the flow condition which is controlled by gravity in original scale, if the model scaling is excessive, it is sometimes impossible to ignore the influence of viscosity because water depth becomes too shallow. To overcome this type of incorrect scale effects, it is needed to guarantee certain dimensions of model to keep flow condition under the similarity relationship of control force between original form and model to decide the scale. Restriction conditions such as “To ignore viscous force, Reynolds number of model should be bigger than 1 × 10⁴ [3]”, “More than 100 mm should be secured for the size of under drain [3]”, etc, are well-known through a large number of studies. USBR [3] recommends the range of 1/30 - 1/100 for spillway of dam through various model tests, generally 1/100 - 1/1000 for horizontal scaling in river model test, and 1/20 - 1/100 for vertical scaling of distorted model. Table 2 shows scaling ratio or similarity. To guarantee Froude similarity of the experiment herein, a specific structure inside of experiment target should secure more than minimum value proposed in the Table 3.
1/60 model scaling is selected to consider convenience of model production, suitable application of similarity law and applicable experiment facilities in the study herein. Various Irrigating formulas along decided scaling is shown in the table 4. The area of hydraulic model is 3.5 km × 2.5 km which included the reservoir, emergency spillway and control dam. The range of hydraulic model is shown red line in the Figure 3. And the built hydraulic model is shown in Figure 4.
Water level of reservoir was measured by steel ruler at 1200 m upstream of emergency spillway. Water level of approaching river to emergency spillway and downstream canal was measured by water gauge (PH-235, KENEK) which is able to measure within the range of
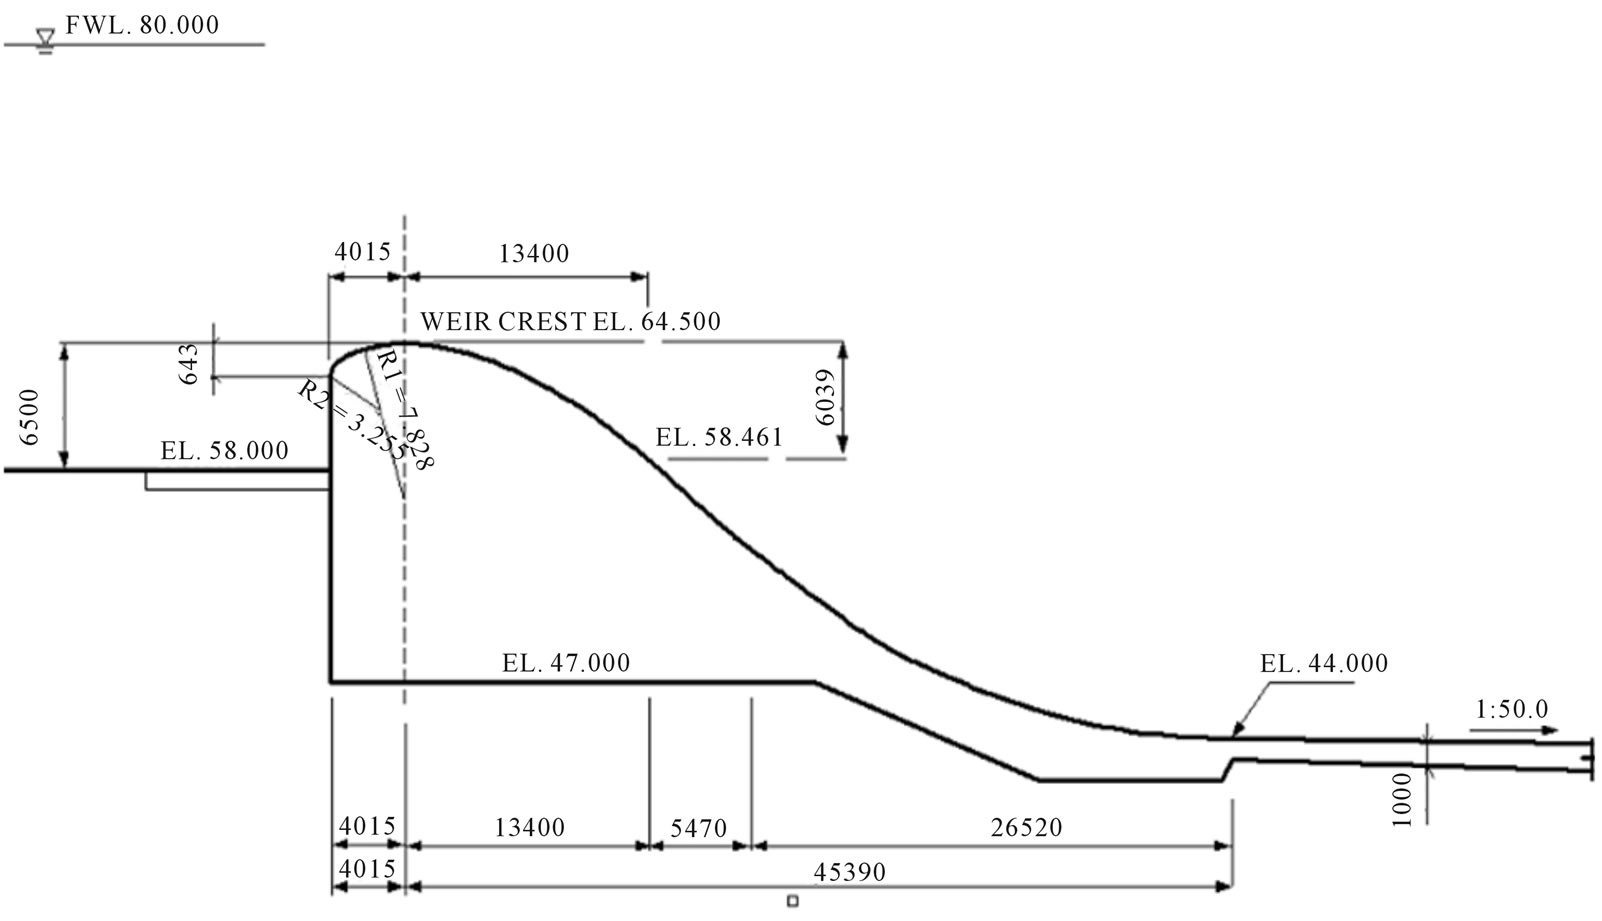
Figure 2. Sectional detailed drawing of emergency spillway overflow weir.
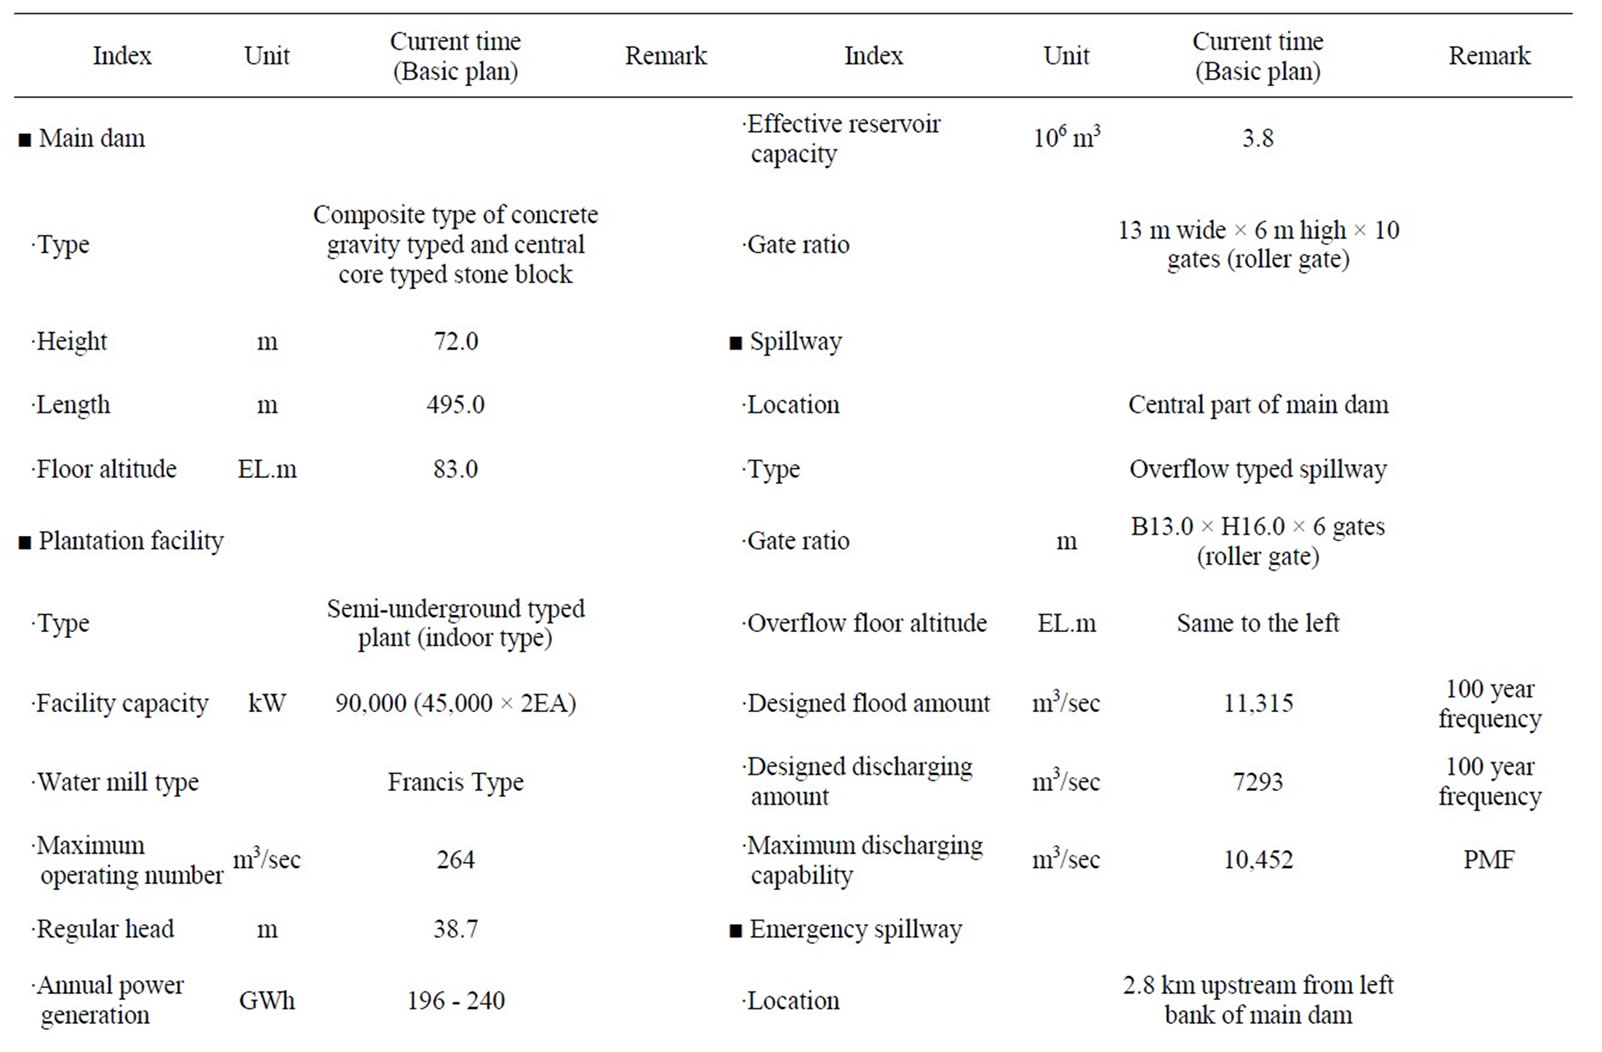
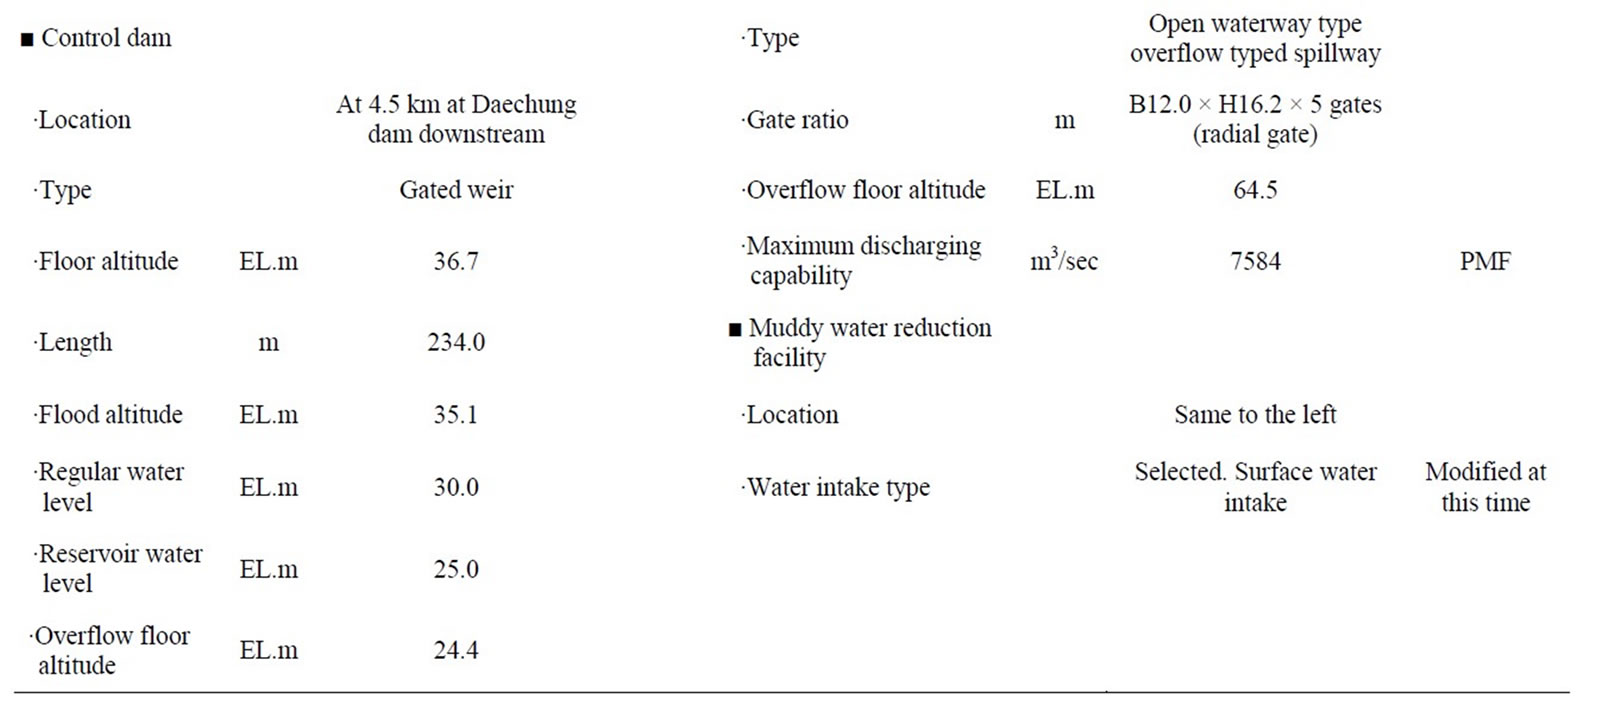
Table 1. Resource of Daechung dam.
0.01 mm. Flow velocity of approaching canal, steep slope canal and downstream channel was measured by 2-dimensional electric current meter (ACM250-D, ALEC) and small propeller current meter (VO-401A, KENEK). To measure the pressure at overflow region, steep slope canal, and end still where emergency spillway and downstream channel are overlapped, dynamic pressure gauge and piezometer along weir and bottom center line of canal, and water head was measured with connecting piezometer and 10 mm diameter glass conduit. Measuring point was selected from weir floor of model to the canal. To clearly determine flow condition at approaching canal and downstream channel, red, green and blue pigment was discharged for measuring, and major parts were
Table 2. Scaling ratio along froude similarity law.
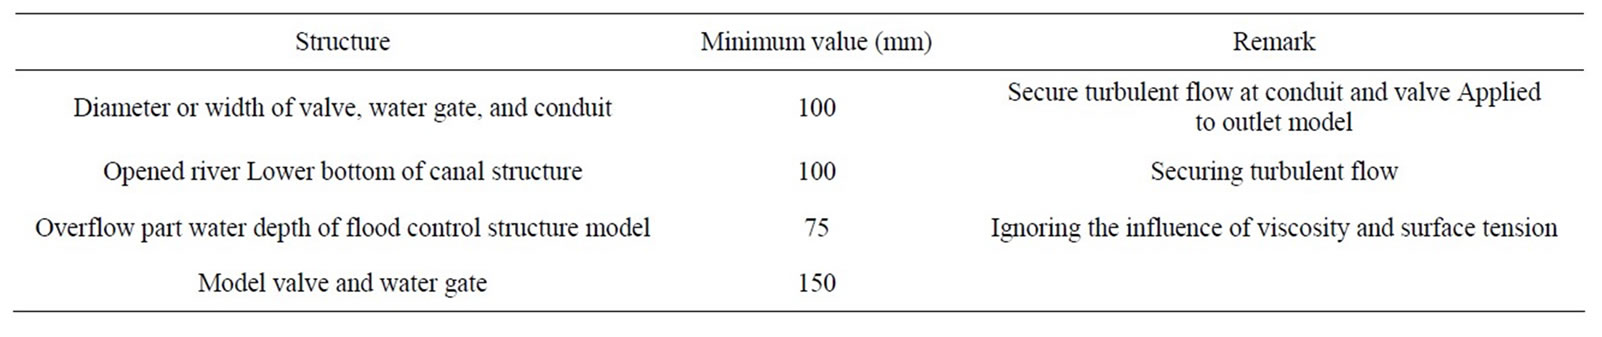
Table 3. Limit value of model.
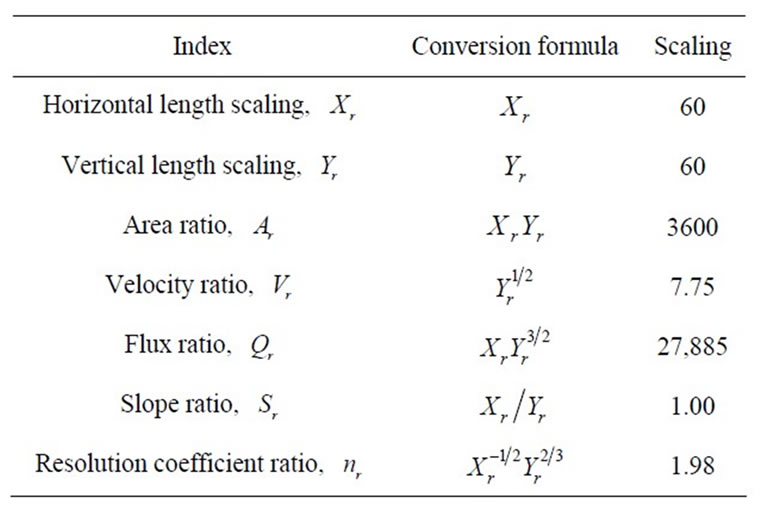
Table 4. Irrigating conversion formula.
sketched, filmed in photo and movie at the same time.
4. Experiment and Results
It is important to understand the characteristic of inclined crest groyne in recirculation field because the characteristic of inclined crest groyne is different with general groyne. In this study, it was analyzed width (Sh), length

Figure 3. The range of hydraulic model.
(SL) of recirculation field and flow distribution in recirculation field to understand the characteristic in recirculation field. A series of general and detailed model tests for Daechung dam emergency spillway were carried out in the experiment herein. Test result was categorized and analyzed to approaching canal, overflow part, suit part, pool and downstream channel. Flow characteristics, vortex
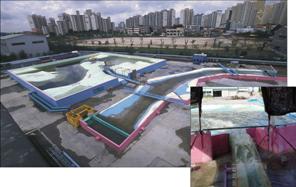
Figure 4. A view of the Daechung Dam model.
phenomenon, and others were measured in experiment at approaching canal, and free surface shape, water level, flow velocity distribution, etc., were also measured. Overflow capability measurement, observation of contraction of flow and separation phenomenon caused by flood gate bridge at overflow part, observation of cavitation generation, determination of discharging capability along flood gates, measuring discharging capability along water level through the condition of flood gate opening, and documentation of water level-discharging amount curve, and flux coefficient, etc. Water level, flow velocity and sulfur measuring for downstream region, and irrigating phenomenon of main flow converging region along the discharge of emergency spillway were determined.
4.1. Examination of Discharging Capability
4 types of flood gate opening conditions (2 m opening, 4 m opening, 7 m opening and full opening) were tested for determining discharging capability along flood gate opening, and water level-discharging curve and flux co-efficient for basic plan were speculated. Figure 5 shows reservoir water level-discharging curve.
Water level of reservoir was measured and its flux coefficient was calculated during discharging in reservoir water level-discharging test. Discharge coefficient was calculated by following equation.
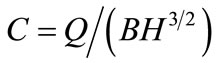
C: Discharge coefficient, Q: Flux, B: Overflow width, H: Overflow water head including approaching flow velocity water head Flux coefficient was calculated and indicated for experimental conditions (2 m opening, 4 m opening, 7 m opening and full opening). Water level-discharge capacity test result of reservoir during full opening is shown in Table 5, and Figures 6 and 7 show the change of discharge coefficient along the change of discharge and reservoir water level-discharge capacity curve. Discharging condition of emergency spillway during PMF is 7584 m3/s, and discharging capability during full opening was
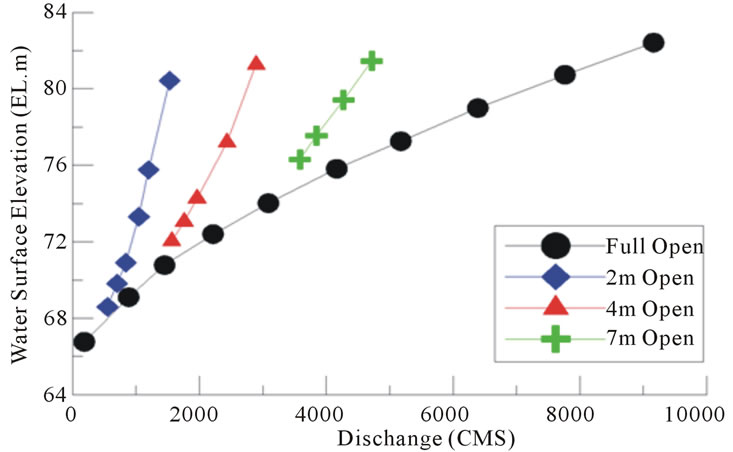
Figure 5. Reservoir water level-discharging curve.
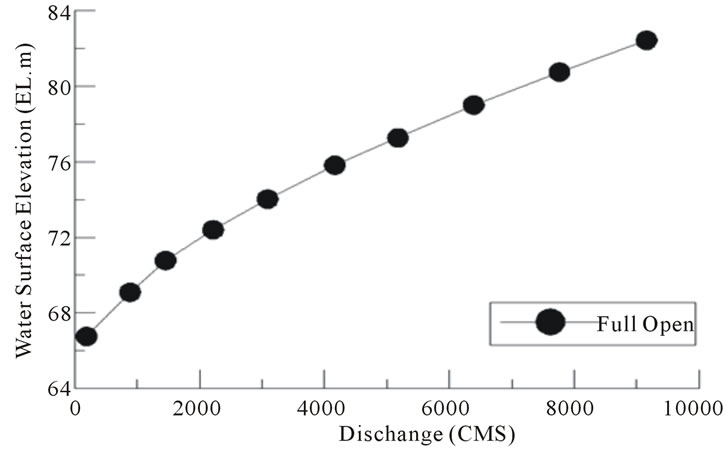
Figure 6. Reservoir water level-discharge capacity curve.
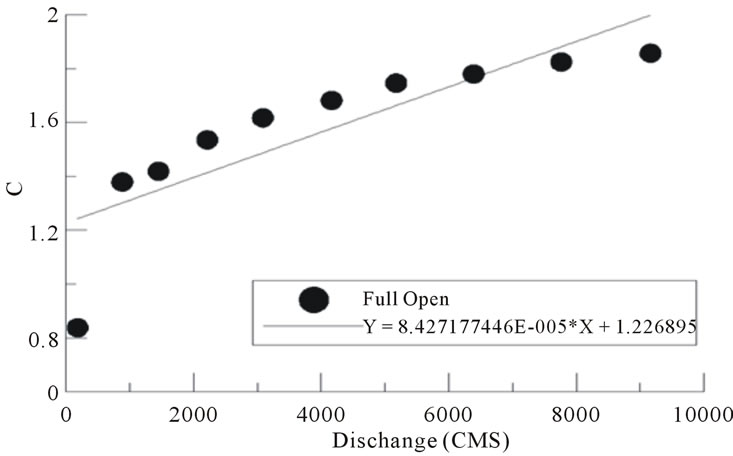
Figure 7. Discharge coefficient on discharge change.

Figure 8. Full opening discharging capability test.
measured to be sufficient from the result of basic plan discharging test. And Figure 8 shows the flow condition in full opening test.
4.2. Approaching Channel
Vortex and reverse flow phenomenon were observed for

Table 5. Experimental result on Water level-discharge capacity (full open).
inlet flow in approaching channel test, and free surface shape, water level, flow velocity distribution, interfererence phenomenon, etc., were measured. Water level and flow velocity measuring points of approaching channel are shown in Figure 9. Survey line is shown in figure, and numbering of survey point number was regulated from left bank.
PMF frequency which is a maximum condition was selected for experimental condition, and its measured water level distribution showed EL. 75.7 m - EL. 80.1 m, which shows a large water level difference of 4.6 m. Measured maximum water level was 0.1 m higher than designed flood water level EL. 80 m. Maximum water level was generated at right bank of NO. 5 survey line and minimum water level was measured at left bank of NO. 1 survey line. Maximum flow velocity of 8.6 m/s was measured at left bank of NO. 1. Approximately 4.5 m/s was measured at NO. 2 which is determined as approaching canal region. Minimum flow velocity was measured to 1.86 m/s at right bank of survey line (NO. 8). Flow velocity of left and right banks were shown bigger than the central canal region at floodgate inlet region. Minute vortex was generated at left bank sidewall, and stagnant flow phenomenon was found at right bank sidewall. Although left and right banks have geometry which can cause vortex, since right bank side shows bend shape and flow velocity of left bank side is faster than its right bank side, it seems that observed vortex in left bank sidewall was shown as stagnant region at right bank sidewall (Figure 10).
4.3. Overflow Region
The influence of each pier was similarly shown at overflow region during PMF, and flow slant was observed at
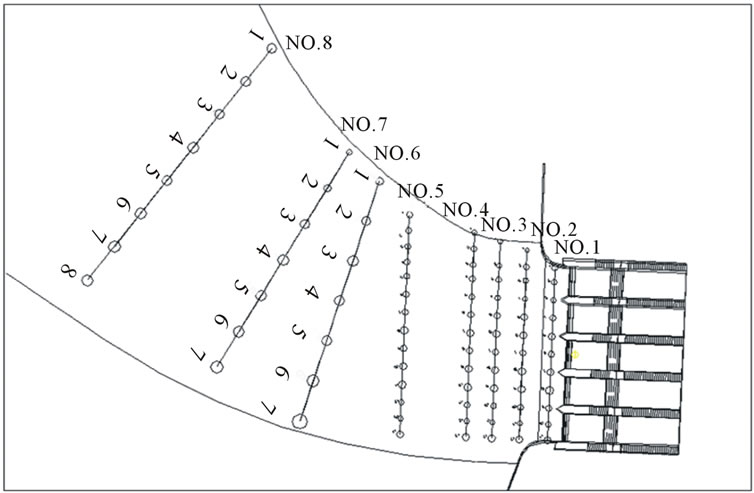
Figure 9. Water level measurement of approaching channel.
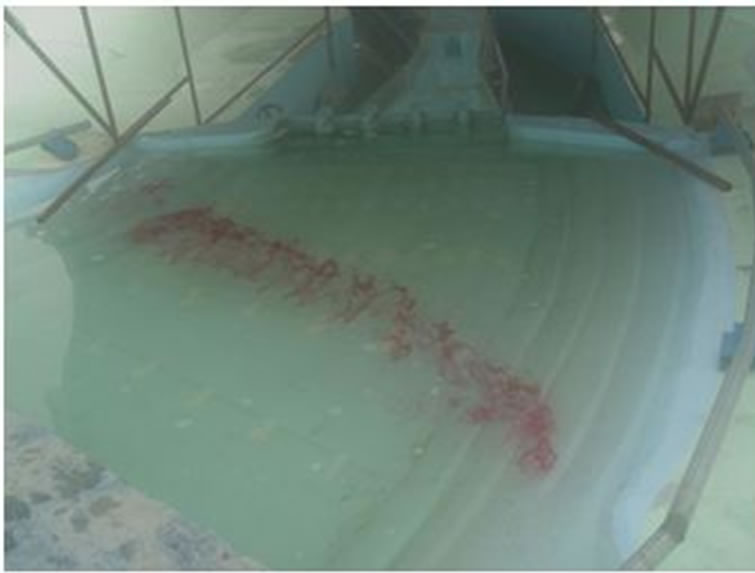
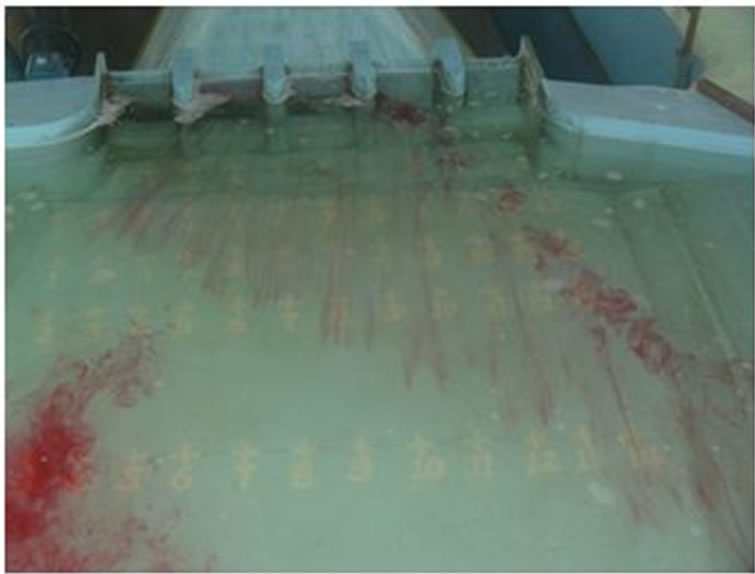
Figure 10. Sulfur of approaching channel region (up & down).
the first floodgate. Drift phenomenon was stronger at left bank side than right bank side (Figure 11). Especially for the case of left bank first floodgate, strong intersection waves were generated owing to flow slant, which elevates water level to gate axis (left bank side), it is determined to need a measure for this in terms of maintenance.
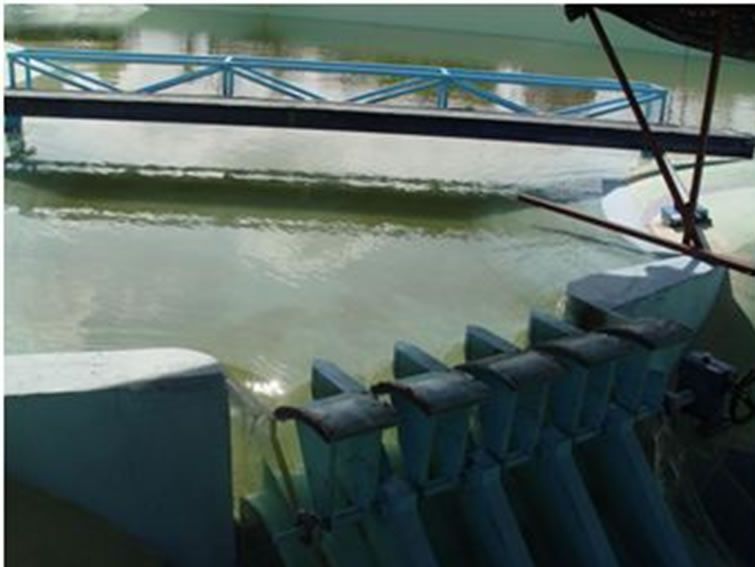

Figure 11. Approach channel (up) & overflow region (down).
4.4. Suit Region
Spillway is made by concrete which is disadvantageous in tensional strength. Strong turbulent characteristic with high flow velocity was shown at spillway structure, and negative pressure can be generated at the lower part owing to the vibration of flow in this case. Since negative pressure causes tensional strength which negatively affects to concrete structure and serious damage at structure because of cavitation phenomenon, pressure distribution checking is necessary for the whole region of spillway. Pressure distribution, free surface shape, water level, flow velocity distribution, etc., were measured at emergency spillway, and cavitation generation was determined in this experiment. Measuring point of spillway is shown in Figure 12. Survey lines were A - R, and starting point (NO. 1) was regulated from each left bank survey line.
Figure 13 shows measured pressure at each survey point. Negative pressure was not generated at PMF from the result. Maximum flow velocity at floor region of 12.94 m/s was measured at NO. 4 floodgate (center), and maximum flow velocity of 25.98 m/s was generated at
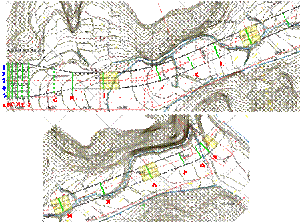
Figure 12. Measuring point of spillway.
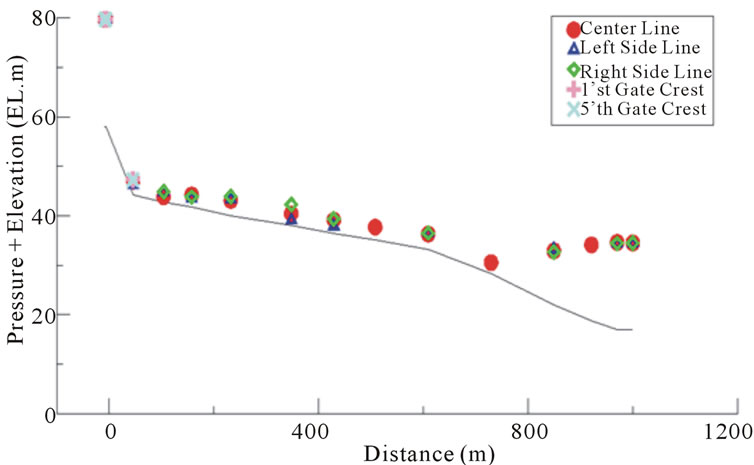
Figure 13. Pressure water head distribution (PMF).
survey line P at the whole region of spillway.
Severe interference wave was generated at right below of overflow region within suit region owing to the influence of pier and slant flow at overflow region and contraction of section at suit region. Flow jumping phenomenon was strongly generated because of the shape of pier terminal at the end of cover region. Strong flow velocity intake was made through downstream since deduction of energy was not sufficient at deduction region. Overflow to right bank sidewall was surveyed owing to the influence of bend at deducti on region.
4.5. Stream Channel
Water level, flow velocity and sulfur were measured at downstream channel region, and flooding phenomenon and others at channel region along the frequency flood amount were observed. Figure 14 indicates survey point. Water level distribution for PMF frequency at pondage dam upstream shows the range of EL. 38.0 m - EL. 40.1 m. As it is shown in Figures 15 and 16, maximum flow velocity of 14.57 m/s was generated at NO. 27 survey line where emergency spillway is overlapped, and minimum flow velocity of 0.94 m/s was generated at left bank
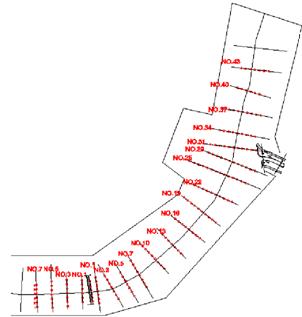
Figure 14. Downstream channel (PMF).
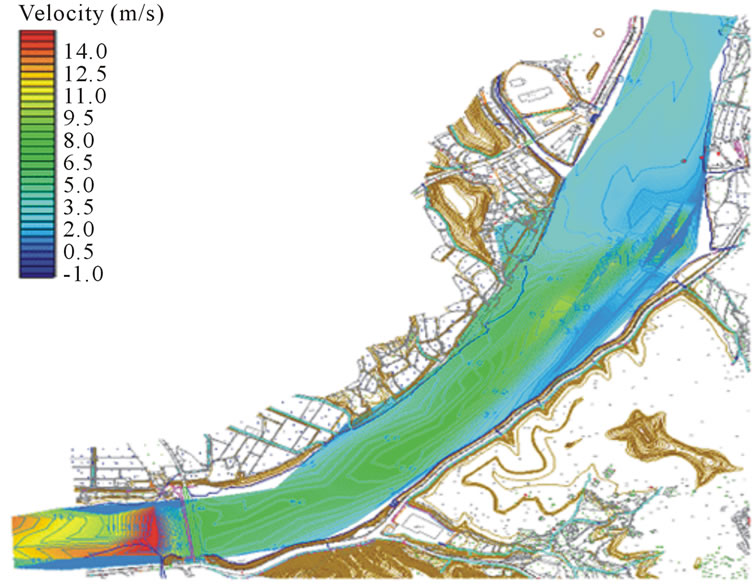
Figure 15. Velocity distribution at stream channel.
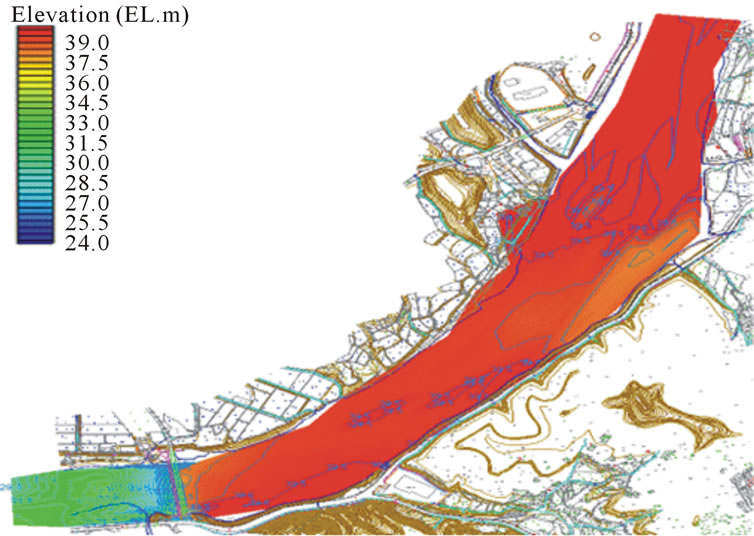
Figure 16. Water level distribution at stream channel.
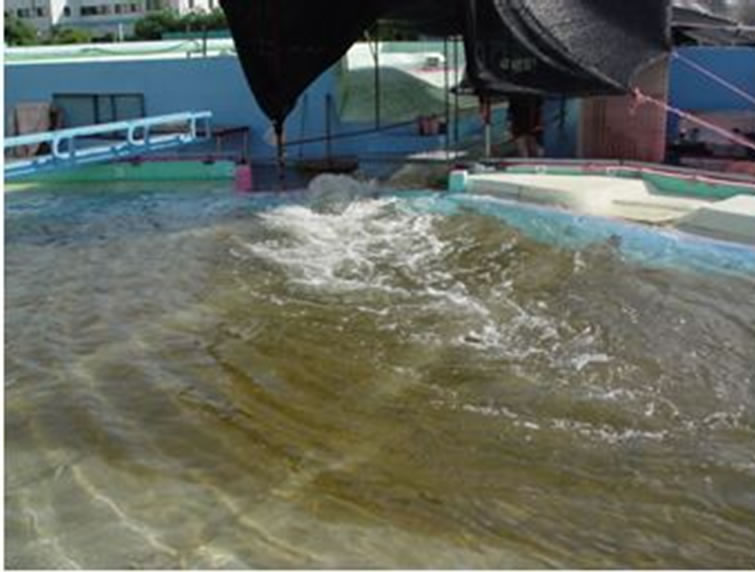
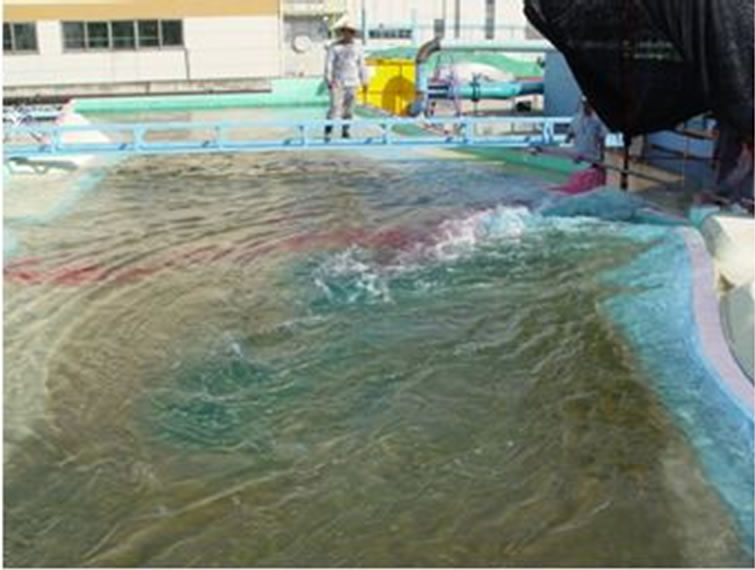
Figure 17. A view of stream channel.
at NO. 29 survey line which is right upper flow of overlapping. 2 - 3 m/s flow range was shown at left bank region at NO. 25 - NO. 19 region owing to overlapping of emergency spillway.
Moreover, it is observed that flow pattern of emergency spillway is also influencing to right bank of downstream channel at downstream region during PMF discharging. Strong reverse flow was observed at downstream channel at outlet of emergency spillway (Figure 17), and focusing and rotation of flow was generated owing to emergency spillway at right bank side.
5. Conclusions
Discharging capabilities of emergency spillway from basic plan and basic design were compared. Both conditions were measured to have sufficient discharging capability in PMF condition. In case of PMF condition, maximum 8 m/s or more flow velocity was measured at approaching canal region in basic plan, which needs modification. Moreover, rapid water level decreasing of 4.6 m around floodgate was measured, which needs modification either. Safety of structure was compared by sulfur at overflow region, and the influence of cavitation phenomenon at suit part was compared. In case of PMF condition, it seems that the collision between the flow and gate axis owing to flow slant at left. Right side flood gate affects the safety of structure.
Strong flow jumping at cover region and pier region was shown at suit region, which needs modification. Moreover, high flow velocity was coming into deducted region owing to the lack of energy deduction which needs modification. Strong flow velocity of maximum 14.57 m/s was generated at PMF frequency and strong vortex flow was generated at left bank region owing to overlapping of emergency spillway.
From the result achieved from experiment for initial design condition, the problem of design was determined, and proper design plan was established with suitable modification and correction of design plan.
6. Acknowledgements
This study was supported by the Internal Research Project of “River Structure Design Techniques for Harmonizing Nature with the Human” in KICT.
REFERENCES
- Korea Water Resource Association, “Dam Design Criteria,” 2003.
- The Ministry of Land, Transport and Maritime, “Daechung Dam Flood Control Capability Enhancement Report,” 2004.
- US Bureau of Reclamation, “Hydraulic Design Criteria,” 1980.