Engineering
Vol. 3 No. 10 (2011) , Article ID: 8084 , 8 pages DOI:10.4236/eng.2011.310127
Reverse Engineering Closely-Spaced Free-Form Shapes for a Fabric-over-Body Model
School of Engineering and Technology, Central Michigan University, Mount Pleasant, USA.
E-mail: chen1m@cmich.edu
Received July 30, 2011; revised August 17, 2011; accepted September 15, 2011
Keywords: Reverse Engineering, Point Cloud Data, Mesh Generation, Delaunay Meshing, Quality Checks
ABSTRACT
This paper presents a case study of reverse engineering closely-spaced free-form shapes. The raw point cloud data captured from a body scanner was processed to filter most noise and redundancy. They were used to generate meshes through triangulation of points. Upon removal of inconsistencies resulted from residual noise, the clean-up meshes were then used to reconstruct the free-form surfaces that represented a fabric layer and a human body surface. The solid produced between these two surfaces is the fabric-over-body model. It helped generate a FEA (finite-element analysis) mesh with quality checks, such as distortion and stretch, were performed for all the meshed tetrahedral elements. The purpose is to prepare a FEA-ready model for future CFD (computational fluid dyna-mics) analysis.
1. Introduction
Reverse engineering has become a viable method of creating a 3D virtual model of an existing physical part for CAD/CAM/CAE applications. The reverse engineering process involves measuring a physical object and then reconstructing it as a 3D model. The physical object can be measured using a number of different technologies which include CMM (coordinate measuring machines), laser scanners, structured light digitizers, or computed tomography. The point cloud data obtained from the measurement usually lack topological information, and are therefore often converted into a more usable format such as a CAD model, a triangular faced mesh, or a set of NURBS (non-uniform rational B-spline) surfaces [1-4].
One of the main objectives of this study was to reverse engineer a pair of closely-spaced free-form shapes. The body surface of a manikin and the layer of cloth that covered the body surface were measured and reconstructed as the free-form shapes. To obtain the scanned surface images, a 3D body scanner was used to scan the manikin with and without clothes, which were processed using the CAD software. Three major steps toward successfully reverse engineering a free-form shape in this study include acquisition of raw point cloud data, processing of raw data, and mesh generation and clean-up. The raw point cloud data, acquired from the 3D body scanner, contained a great deal of noise and redundancy and thus required processing in CATIA V5 [5] to reduce the data size while keeping true to the original shape of the scanned object. Meshes were generated out of the processed point clouds and surfaces later out of the meshes. The automated mesh generation process triangulates the closest three points in the cloud until the entire point cloud is networked to form a triangulated surface. The meshes were cleaned up to remove all inconsistencies such as non-manifold vertices and edges. The free-form surfaces were then reconstructed from these clean meshes.
The other main objective was to develop a fabric-overbody model. The model was defined as the space between the fabric and the body surface, and captured by superimposing the two reconstructed free-form surfaces. However, each of the two surfaces needed to be closed to form a solid before performing a Boolean operation. The model was further developed into a FEA (finite element analysis)-ready model for downstream CFD (computational fluid dynamics) applications in thermo-fluid analysis. The FEA mesh was generated on I-DEAS [6] based on the geometry of fabric-over-body model. Quality checks were used to identify and remove unwanted irregularities, such as the distortion and stretch of tetrahedral elements, in the mesh.
2. Point Clouds
2.1. Acquisition of Raw Point Clouds
The equipment used to acquire the raw point cloud data was a VITUS/Smart 3D Body Scanner by Vitronic [7]. It is designed to produce highly realistic 3D images of the human body based on optical triangulation technology. The purpose of utilizing this body scanner was primarily for rapid digitizing. The laser based non-contact scanner can digitize objects in 11 seconds with an accuracy of 0.1%. Though the finest resolution could only reach one millimeter and it does not scan cavities, it allows denser point clouds be quickly acquired with no more than three scans. To acquire a dense point cloud for this case study, however, a single scan was usually sufficient. This is because the optical triangulation between the chargedcouple device (CCD) camera [8], laser, and manikin can capture all the features where vertical view obstruction is minimized. Figure 1 illustrates the acquired raw point cloud data of the manikin with and without the clothes. They were then exported as ASCII files from the Human Solutions software provided by Vitronic to CATIA V5. Figure 2 illustrates these raw point cloud data in ASCII format.
2.2. Processing of Raw Point Clouds
Because eight CCD cameras were involved in scanning, the raw point cloud data acquired from the body scanner contained multiple patches which were too dense (depicted in Figure 2). They contained a great deal of noise and redundancy that resulted in enormous data sizes. For easier mesh generation and clean-up, both raw point clouds must be processed but kept true to the original shapes of the digitized manikin with and without the clothes. Figure 3 shows the procedure to process raw point cloud data and obtain clean meshes.
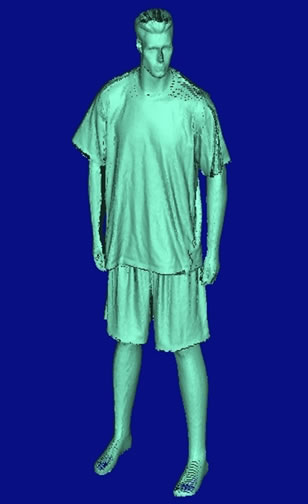

Figure 1. Raw point cloud data acquired from 3D body scanner.

Figure 2. Raw point cloud data in ASCII format.

Figure 3. Procedure to process point cloud data and obtain a clean mesh.
At first, unwanted points were removed from the point clouds. The tools in Digitized Shape Editor workbench of CATIA V5 were utilized to automatically detect and remove any outliers for both raw point clouds. In planar orientation two different point clouds were oriented about the coordinated planes. Multiple clouds can be aligned based on reference points and superimposed over each other using the cloud-to-cloud alignment tool. This technique is also called Intelligent Registration [9,10]. It was achieved by making sure that both point clouds include at least one common feature during digitizing, such as the head (or hand) of the manikin in this case. Two clouds must be accurately aligned before they are clubbed together (cloud union) to become the unified point cloud depicted in Figure 4. To ensure the two point clouds shared the same center-of-axis, the manikin was securely clamped to the platform of the 3D body scanner when the clothed manikin was going through the first scan. The fabric was then carefully cut out prior to the second scan, so that the manikin without the fabric might not shift from its original position due to air movement.
Homogeneous filtering was applied to further reduce noise and redundancy. It used a sphere for homogeneous point removal to thin the point cloud evenly. The sphere started on the first point met and hid all the points inside the sphere. The sphere went to the next remaining point and hid the points that it contained, and so on. In this way the sphere maintained an equal distance, 10 millimeters in this case, between each point. Figure 5 illustrates the completely processed point clouds which were thoroughly cleaned up, leaving little noise before the mesh generation.
3. Meshes
3.1. Mesh Generation
Mesh generation is an automated process of connecting the closest three points to form a triangle. This triangulation of points is repeated until the entire point cloud has been networked to form an unambiguous, coherent, and consistent triangulated surface [11,12]. The noise over a mesh surface depends on how clean the processed point cloud data is prior to triangulation. Problems may occur in the generated mesh due to irregularities in the imported data. They include non-manifold vertices and edges, redundant and acutely angled triangles, triangles with inconsistent orientation, etc. Due to residual noise left over from the processed point clouds of the manikin
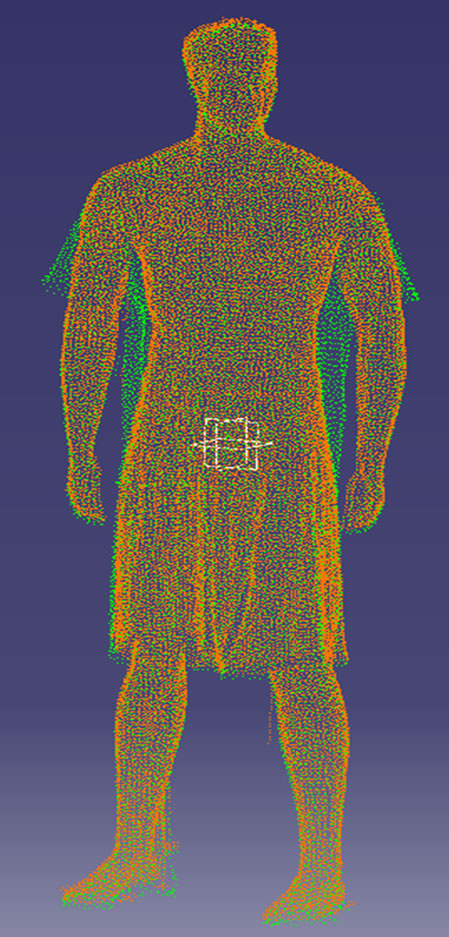
Figure 4. Unified point cloud.

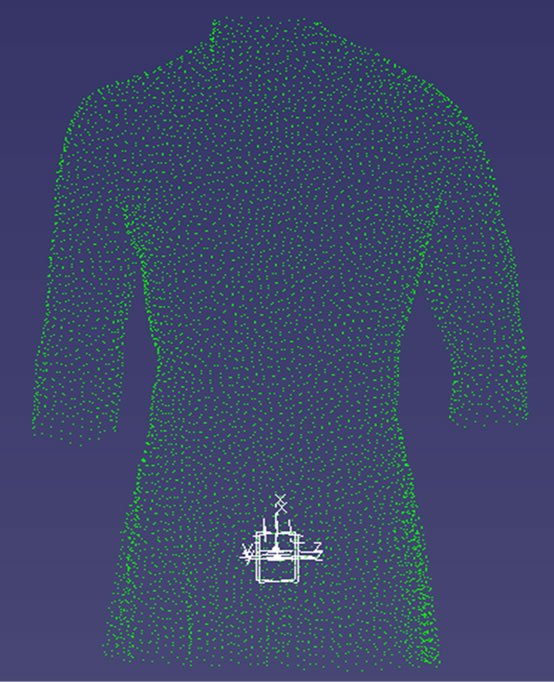
Figure 5. Processed point clouds of manikin with and without clothes.
with and without the clothes, the initial mesh generation from them had some inconsistencies.
3.2. Mesh Clean-up
Figure 6 illustrates the generated mesh with and without these inconsistencies. The left side shows that the mesh is not a clean mesh, because it has holes, non-manifold vertices, and non-manifold edges. As shown in Figure 3, mesh cleaned-up is the step to be carried out after the mesh generation. In mesh clean-up, the “mesh cleaner” tool in the Digitized Shape Editor workbench was used to clear non-manifold vertices and edges. In addition, any remaining unwanted triangles are interactively removed prior to hole filling. The hole filling was done automatically using surface information or volumetric algorithms. Smoothing is a step towards refining the mesh, so the surfaces can be reconstructed for better quality and greater accuracy. The “mesh smoothing” automatic tool requires user input and its effect is global.
Decimation and optimization were performed next. They were done interactively to obtain desired accuracy and add sharpness to the clean mesh. The decimation significantly reduced the number of triangles over low curvatures or flat areas, but maintained a high triangular count over high curvature regions, via curvature-based sampling. The optimization adjusted the edge length of triangles to a specified range, and recognized the adjacent edges of a triangular fan to a specified angle. Figure 7 shows the clean meshes of the manikin with and without the clothes at the completion of decimation and optimization.
4. Free-Form Surfaces and Fabric-over-Body Model
Figure 8 illustrates the free-form surfaces reconstructed from the clean meshes of the manikin with and without the clothes using the Quick Surface Reconstruction workbench. Each surface thus created was closed using the close surface tool to generate a solid. To produce the fabric-over-body model, the solid of manikin without clothes was then used to cut the one with. As illustrated in Figure 9, this Boolean operation (union trim) generated a solid fabric-over-body model defined by the space between the fabric and body surface. In Figure 9, highlighted areas of A and B have no air volume, because the fabric surface is touching the body in these areas.
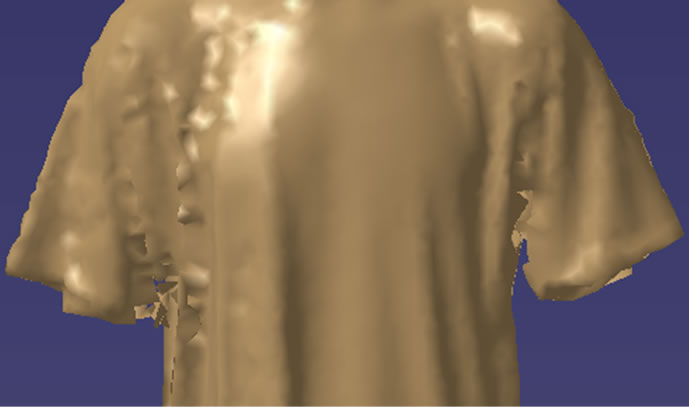
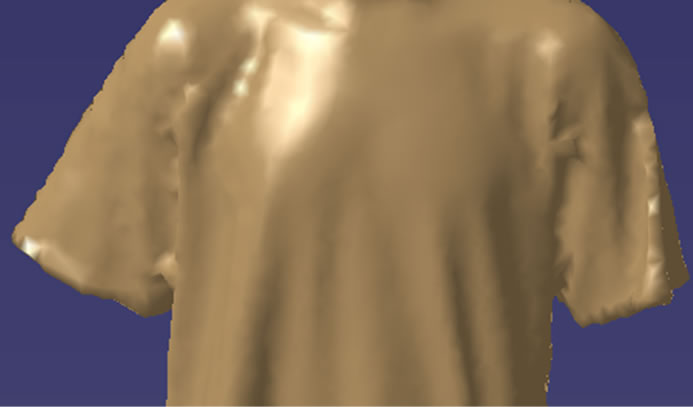
Figure 6. Meshes with and without inconsistencies.


Figure 7. Clean meshes of manikin with and without clothes.
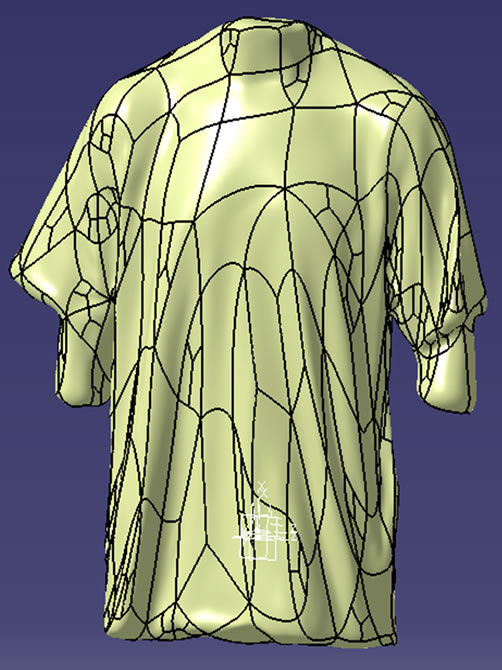
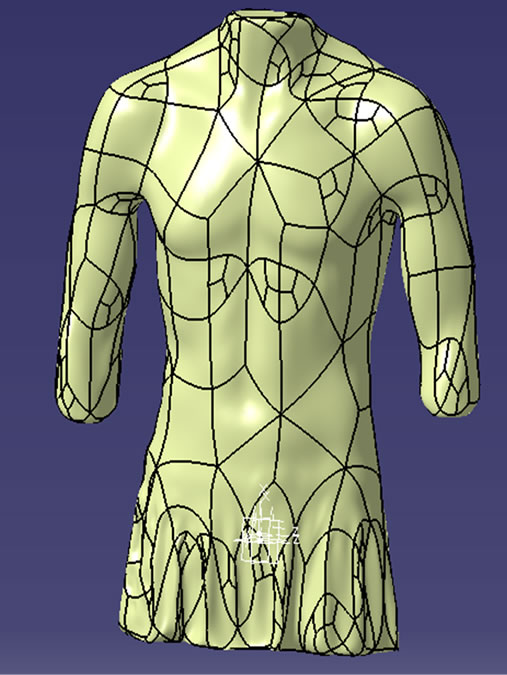
Figure 8. Surfaces created from clean mesh.
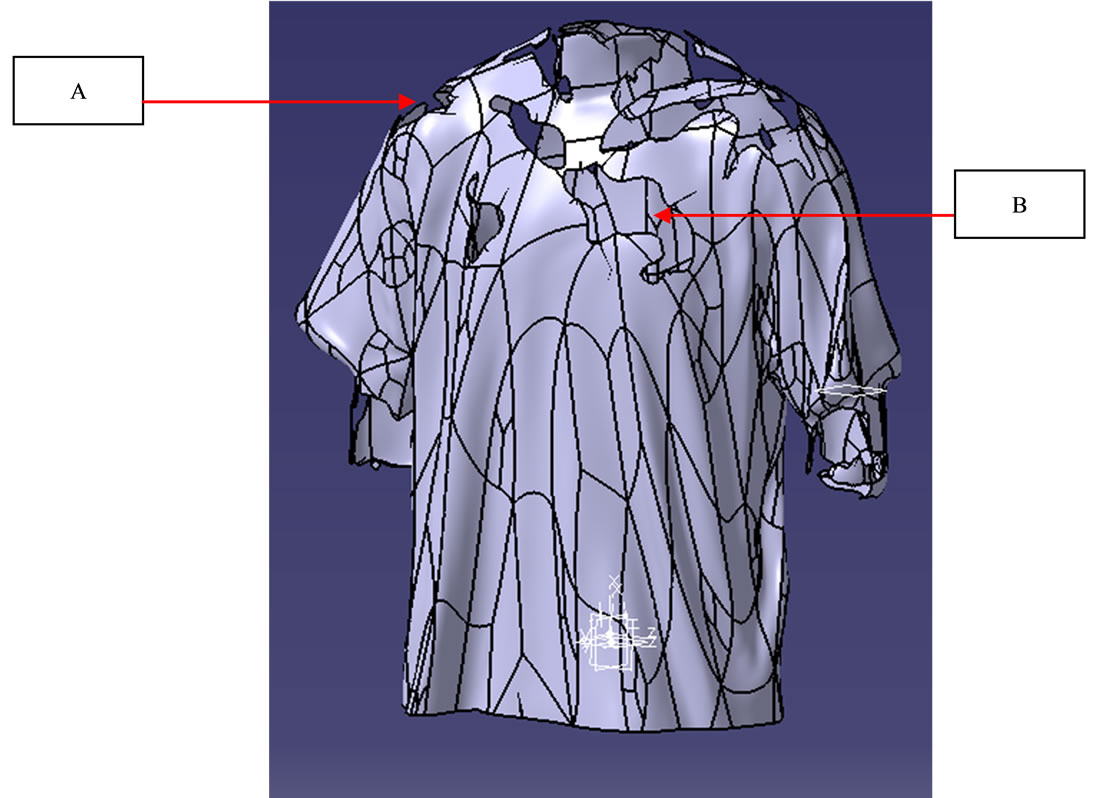
Figure 9. Fabric-over-body model in solid.
5. FEA Model
5.1. FEA Model Generation
The solid fabric-over-body model was imported to I-DEAS and used as the geometry of a FEA model. The purpose was to prepare a good quality FEA mesh, which could then be used for downstream CFD analysis in the future. The CFD analysis will focus on how temperature and moisture distribution in the model varies when a human body is exposed to different climatic conditions with a certain type of fabric. Since the CFD software was not available in house at the time, all the preparation was completed in I-DEAS, which was not designed for the CFD applications but had excellent FEA features.
In I-DEAS, the option of free meshing, as opposed to mapped mesh, was selected primarily due to the complexity of the geometry of the fabric-over-body model. The former, which permits the software to determine shape and size of elements, could achieve the defect-free quality more swiftly. The latter, though the grid looks more regular, often has higher distortion. After creating the FEA mesh with tetrahedral elements, it was then subjected to several different quality checks. Quality checks measure different aspects of an element’s deviation from an ideal size and shape. The quality of all elements were checked with set threshold values (or limits for deviation) for skew, warp, taper, distortion, stretch, aspect ratio, etc.
TriQuaMesh [13], which uses a divide-and-conquer meshing algorithm and provides flexibility to handle large variations of mesh size, was not selected as the tetrahedral meshing method. Instead, Delaunay meshing [14-16] was picked due to a number of complex geometries in the model. Delaunay meshing permits all the volume’s surfaces are meshed to create an initial set of nodes and triangles. The surface triangulation is then checked for validity before proceeding with the volume mesh. In case the software encounters any coincident nodes or self-intersecting boundaries, the meshing process stops and the elements that fail to meet the required criteria are identified and displayed in the List region. There are many optimality characterizations for Delaunay meshing [17]. The most well known is that it maximizes the minimum angle of triangles in surface triangulation [18]. The main disadvantage of using Delaunay meshing was it was not possible to guarantee surface integrity when, as not all the surface triangles might be present as faces of tetrahedrons. However, the benefit of speed was preferred over others such as the need for accuracy. The mesh convergence, which runs the model a number of times with increased refinement in the regions of interest to study the convergence of analyzed results, was not carried out due to an incomplete CFD model.
A FEA mesh was generated upon the completion of Delaunay meshing. Figures 10 and 11 depict the FEA mesh in the right shoulder and underarm regions. Figure 10 shows a small gap in the underarm region where the mesh is complex and overly concentrated with small tetrahedral elements. The figure also displays a number of irregular patches with some on front side as the others on the back side, similar to those shown in Figure 9. Figure 11, which is the same FEA mesh in Figure 10 viewed from a different perspective, also displays highly concentrated tetrahedrons between the closely-spaced free-form surfaces. Since the geometries in these regions were the most complex among all in the model, there many elements failed the required criteria in the first iteration of the quality check.
5.2. FEA Model Checking and Improvement
The accuracy of a FEA model depends heavily on the quality of meshed elements. Defected elements with large displacements of the associated nodes may result in very significant local errors or insolvable system of equations even if their volumes are small. In FEA model

Figure 10. FEA mesh that shows irregular patches.
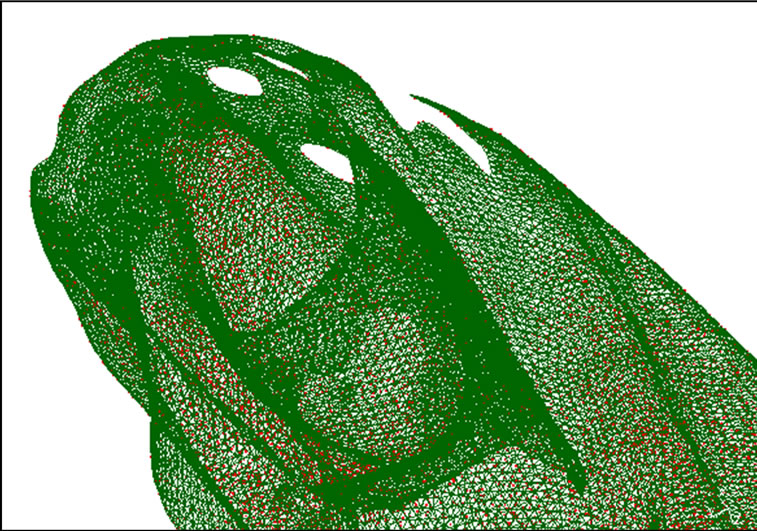
Figure 11. FEA mesh shows highly concentrated elements between closely-spaced free-form surfaces.
checking, the Free-Edge check [19] was used to find the element connectivity problems. It plots the outer boundary of the model to locate “cracks”. They occur if elements are joined edge to edge but reference duplicate coincident nodes rather than share the same nodes. In this situation, an extra line will appear in the plot. Duplicate elements defined by the same nodes will cause both elements to disappear and a missing line to show up in the plot. These unwanted duplicate nodes and elements were removed prior to performing other checks.
Due to the extremely tight spaces and bends around irregular patches and underarm regions, a number of elements were highly distorted and stretched and failed to meet the criteria during the quality check. The threshold values for distortion and stretch were set at 0.7 and 0.05, respectively, consistent with those used in common practices. The distortion value equals 1 if the element matches the target shape. As the element deviates from the target shape, the distortion value decreases. A negative value represents a concave element, which is mathematically impermissible. The stretch is defined as the radius of the largest circle, which can fit inside the element, divided by the longest distance between corner nodes. The software normalizes the value by multiplying by the inverse of the above value for the target element.
All the elements which failed the criteria or threshold values needed to be fixed. There are several methods to solve this problem. For instance, the Move Mid Nodes, Straighten Edges, or Tetra Fix command can be used to fix distorted tetrahedral elements. Since Tetra Fix combines steps of the former two and is automated, it does not give much control on node movement. The Fixing Element Included Angle command can be used to improve the quality of elements that have either very large or very small interior angles. Although a number of different tools were applied to remove the defective elements and nodes from the mesh, the Tetra-fix tool was found to be most useful.
The FEA mesh as generated and fixed did eventually satisfy all the aspects of quality check. According to the result from the final round of quality checks, none of the elements failed the threshold values set for both distortion and stretch, though it took a number of different fixes to bring them under control. In addition, all the elements were also free from skew and warp, and had acceptable values for taper and aspect ratio.
The main issue to be addressed in the future is whether the fixed FEA mesh matches the geometry of the physical model. Additionally, how off is the FEA mesh as compared to the physical model if they are not perfectly matched? In this study the FEA model went through a number of iterations, and thus the geometries around the irregular patches and underarm regions might have been somewhat altered, as a result of element fixes. The alternation of the geometries in underarm regions, in particular, may present a major problem. This is because the boundary condition of heat and moisture generation for the CFD model must be applied here.
6. Conclusions
This study successfully demonstrated the process towards reverse engineering closely-spaced free-form shapes to generate a fabric-over-body model. The process included the acquisition and processing of raw point cloud data, mesh generation and clean-up, and development of solid using reconstructed free-form surfaces. The solid fabric-over-body model was used to produce a FEA mesh that can be further utilized in downstream CFD applications for thermo-fluid analysis. The FEA mesh was subjected to several different quality checks and found free of defects after a number of fixes. The tools, such as homogeneous filtering, mesh clean-up, quality check, and element fix, were proved to be very effective in this study. However, how the accuracy of the model at different stages is impacted by these tools, individually and collectively, must be studied next before carrying out the CFD analysis.
7. REFERENCES
- J. Bohm and M. Pateraki, “From Point Samples to Surfaces—On Meshing and Alternatives,” Image Engineering and Vision Metrology’ Proceedings of the ISPRS Commission V Symposium, Dresden, 25-27 September 2006. http://www.ifp.uni-stuttgart.de/publications/2006/boehm_pateraki06_ISPRS_CommV_Dresden.pdf
- K. Soni, D. Chen and T. Lerch, “Parametrerization of Prismatic Shapes and Reconstruction of Free-Form Shapes in Reverse Engineering,” International Journal of Advanced Manufacturing Technology, Vol. 41, No. 9, 2009, pp. 948-959. doi:10.1007/s00170-008-1550-1
- D. Rogers, “An Introduction to NURBS with Historical Perspective,” Morgan Kaufmann Publishers, San Francisco, 2001.
- A. Wulamu, M. Goetting and D, Zeckzer, “Approximation of NURBS Curves and Surfaces Using Adaptive Equidistant Parameterizations,” Tsinghua Science & Technology, Vol. 10, No. 3, 2005, pp. 316-322. doi:10.1016/S1007-0214(05)70075-4
- Dassault Systems, CATIA V5, 2011. http://www.3ds.com/products/catia/portfolio/catia-v5/catia-v5r21/
- Siemens NX, I-DEAS, 2011. http://www.plm.automation.siemens.com/en_us/products/nx/
- Vitronic, VITUS/Smart 3D Body Scanner, 2011. http://www.vitronic.de/en/bodyscannen/complete-body-scanning/
- SearchStorage.com, Charge Coupled Device Camera, 2011. http://searchstorage.techtarget.com/sDefinition/0,,sid5_gci295633,00.html
- T. Grimm, “Reverse Engineering: Magic, Mystique, and Myth,” Desktop Engineering, Vol. 10, No. 12, 2005, pp. 32-37.
- Rapidform, Intelligent Registration, 2011. http://www.rapidform.com/57
- D. Gibson, “Parametric Feature Recognition and Surface Construction from Digital Point Cloud Scans of Mechanical Parts,” Thesis, University of Oklahoma, Norman, 2004.
- P. Waterman, “3D Data at Work,” Desktop Engineering, Vol. 9, No. 11, 2004, pp. P18-P23.
- J. Cabello, “Toward Quality Surface Meshing,” Proceedings of 12th Meshing International Roundtable, Santa Fe, 14-17 September 2003, pp. 201-213.
- A. Fabri, P. Alliez and M. Yvinec, “Triangulations and Mesh Generation in Computer Geometry Algorithms Library,” CGAL Day of the 10th Anniversary of LIAMA, Beijing, 19 January 2007. http://www.cgal.org/Events/Liama_Beijing_2007_documents/TriangulationsInCGAL.pdf
- S. Oudot, “Delaunay Triangulation,” Course Handouts, Stanford University, Palo Alto, 2011. http://graphics.stanford.edu/courses/cs368-06-spring/handouts/Delaunay_1.pdf
- L. H. Beni, M. A. Mostafavi, J. Pouliot and R. Therrien, “Developing an Adaptive Topological Tessellation for 3D Modeling in Geosciences,” Geomatica, Vol. 63, No. 4, 2009, pp. 419-431.
- F. Aurenhammer and R. Klein, “Handbook of Computational Geometry,” Amsterdam, 2000.
- L. Chen and J. Xu, “Optimal Delaunay Triangulation,” Journal of Computational Mathematics, Vol. 22, No. 2, 2004, pp. 299-308.
- M. Lawry, “I-DEAS Student Guide,” 2nd Edition, McGraw-Hill, New York, 2004.