Engineering
Vol. 3 No. 8 (2011) , Article ID: 6829 , 9 pages DOI:10.4236/eng.2011.38103
Experimental Study on the Flow Characteristics around the Refraction Groyne
Department of Water Resources Research, Korea Institute of Construction Technology, Goyang City, Korea
E-mail: {jgkang02, yeo917, jinx9482}@kict.re.kr
Received June 8, 2011; revised July 6, 2011; accepted July 15, 2011
Keywords: Groyne, Refraction angle, Projection length, Thalweg, Recirculation area
ABSTRACT
The refraction groyne is a complex structure consisted with groyne and groyne’s arm. This study conducted a experiment on the flow influences around the refraction groyne due to changes in the arm angle (θ) and length (AL). Results of experiment were analyzed on the impacts of the refraction groyne according to the projection length (L'). Velocity increase in main channel occurred greater the upward groynes than downward groynes. The vortices occurring at recirculation area of the upward and downward refraction groynes were formed in different shapes. The thalweg height did not have great impact vis-a-vis the extended arm length ratio and refraction angle change. The length of the recirculation area showed a gradual uptrend as the arm length of the groyne increased. Such area was formed at the range of 29% - 47%. For the length of the recirculation area, it was observed to be 10.2 - 14.7 times (URG), 8.4 - 12.7 times (DRG), and 10.6 - 13.8 times (right angle groyne) the projection length (L') incensement.
1. Introduction
The groyne is installed to protect the riverside or embankment from erosion by flows through the control of flow direction in a river. It is also used to acquire sufficient water level for the operation of a canal. In addition, the groyne is used as a water-friendly structure to improve the surrounding scenery and accessibility to the river; it performs an ecological function by providing fishes’ underwater habitat and refuge from floods. The groyne has various functions, and diverse types of groynes can be applied according to special purposes, thanks to the good installation attributes. Given the growing interest in river restoration and maintenance of natural rivers, the groyne is presented as a major hydraulic structure to control local flows and form an underwater habitat. To design a groyne, it is very important to select an appropriate groyne shape based on the installation purpose and to decide the flow change according to the groyne shape, since the groyne’s shape varies and the flows of the groyne area and the main watercourse’s flow change occur depending on the groyne shape. Studies on the groyne’s shape mostly concentrate on non-overflow or overflow groynes with square shapes; there are only a few studies on special shape.
Recently, studies on groynes have been actively carried out at home and abroad. Teraguchi, et al. [1] compared non-penetrating and penetrating groynes in terms of river bed changes through hydraulic model experiments and simulation numerical tests. McCoy, et al. [2] identified flow distribution through the numerical interpretation of overflow and non-overflow states related to two non-penetrating groynes. Most studies on groynes have been carried out specifically on the straight line form of “I”-shaped groynes, and there are few studies on transformed groynes. Martinez [3], et al. conducted experiments on the installation angle and penetration rate of the Hook groyne, and Mohsen [4] did experiments on the move concerning the “I”, “T”, and “L”-shaped groynes. Note, however, that they cited efficiency depending on vortex erosion rather than flow characteristics.
This study was conducted on the refraction groyne using hydraulic experiment and analyzed the flow change on refraction groyne arms. In this study sought to provide basic data for refraction groyne design by identifying the impacts around the groyne as a result of refraction groyne installation such as recirculation area.
2. Hydraulic Experiment
2.1. Experiment Elements
The flow area around the groyne can be divided into the main flow area and the recirculation area formed in the downstream part of the groyne. The main flow area is the section where flow is disturbed by the groyne installed within the watercourse; thus, the thalweg changes, the flow width decreases, and the flow velocity increases. Thalweg refers to the maximum line of flow velocity. Spatial change in the main flow area was analyzed through the height of the thalweg (TCL). The recirculation area is the section where various flows exist. It is also the area that generates groyne effects. The flows in the recirculation area differ depending on the groyne shapes.
Diverse flows in the recirculation area diminish the flow velocity compared to the existing river bed; thus, it can protect the embankment from erosion, provide ecological space for various types of underwater species, and play the role of a refuge in times of flood. Spatial change in the recirculation area becomes a major element for evaluating the groyne effects including the type, length, and distance of the groynes and ecological habitat size. As elements for evaluating spatial change, the width and length of the recirculation area were indicated as Sh and SL, respectively. The flow change around the groyne is largely dependent on the length (l/B) and penetration rate of the groyne (P) [5]. Under the groyne condition featuring a complex structure such as a refraction groyne, the impacts will be different. Since flow structures can differ by groyne arm, which is extended to the groyne body in the case of the refraction groyne, there is a need to study the flow impacts around the groyne. This experiment examined the impacts according to the change in the refraction angle (θ) and arm length (AL) of the refraction groyne. Moreover, through experiments on the right angle groyne having the same projection length (L'), this study analyzed the differences (Figure 1).
2.2. Experiment Conditions
The experiments on the refraction groyne were conducted in the straight line watercourse with the following dimensions: 2.0 m (B) × 0.8 m (H) × 40.0 m (L). For the flow velocity field around the groyne, an LSPIV technique that analyzes based on images shot by supplying particles to the flow field was used. A digital camcorder (HDR-SR12, Sony Co.) was used for the shooting of the flow field. Premiere Pro 2.0 (Adobe) was utilized as motion picture editing program. For image analysis, CACTUS 3.1 (IIT. Co) was employed. For the approaching flow velocity measurement of the groyne, a 2-D electromagnetic flow velocity gauge (ACM250-D, Alec. Co.) was used (Figure 2).
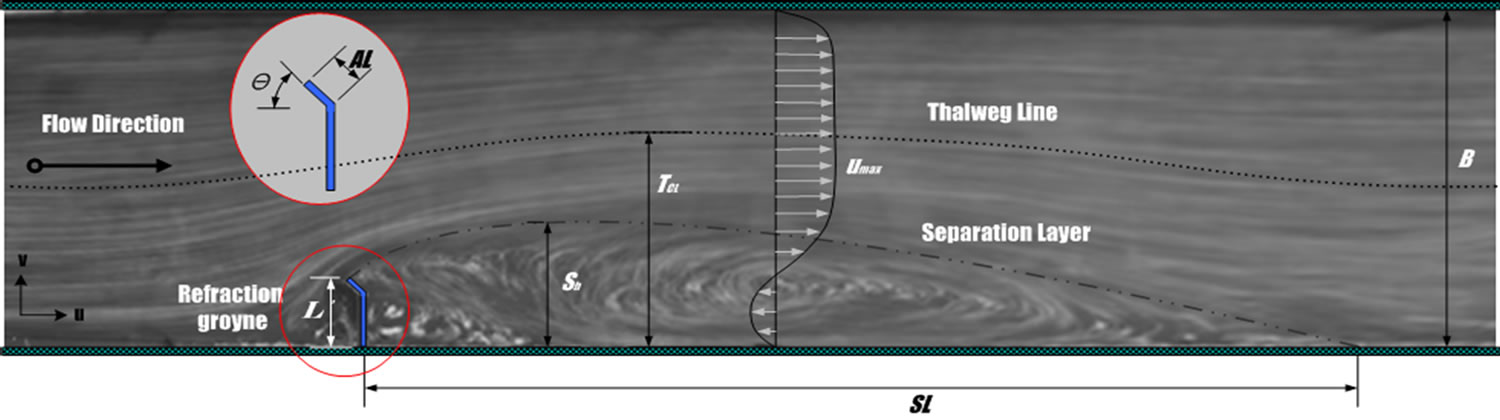
Figure 1. Characteristics and definitions of flow variations around single groyne.
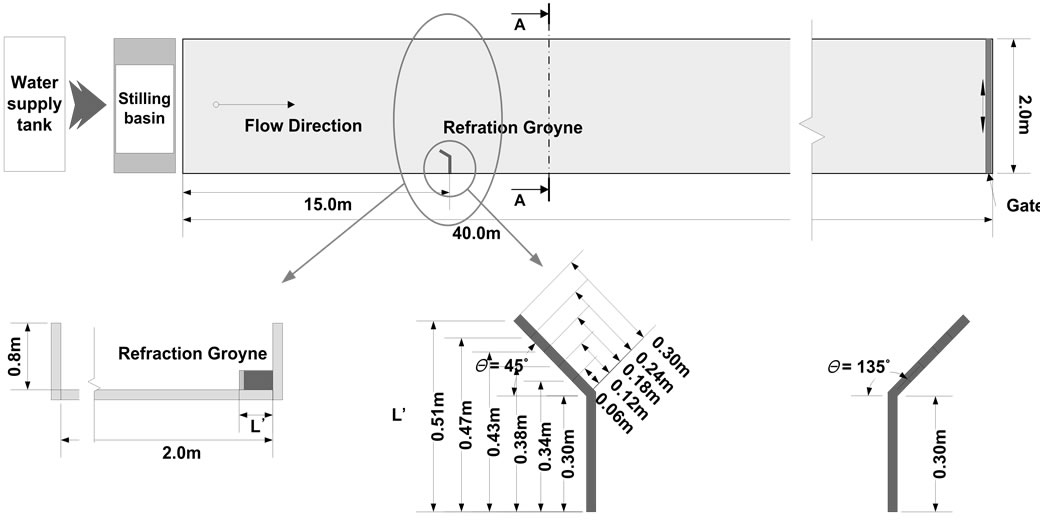

Figure 2. Experimental flume.
The refraction groyne employed in this experiment was made with acrylic material. The length of the groyne body was defined as L, and the refraction angle of the groyne, as θ. The groyne’s arm length was indicated as AL. For the comparison of groyne length, the vertical length considering the end of the groyne was defined as the projection length (L) (Figure 3). The length of the groyne body installed at a right angle from the flow direction in connection with the embankment was the length recommended by FHWA (1985), and the groyne with l/B = 0.15 was selected. Furthermore, it was decided that the groyne’s arm length would not exceed L/B = 0.3 as the maximum length. The groyne’s arm lengths were produced to be 0.2, 0.4, 0.6, 0.8, and 1.0 times the groyne body, which was installed at 90˚. The refraction angles of the groyne arms were made to be 45˚ and 135˚. The projection lengths of the groyne (L') were 0.36 m - 0.51 m. The ratios of the groyne length to groyne width (L'/B) were 0.17 - 0.26, which fall within the scope recommended by FHWA [6]. A total of 30 experiment conditions were applied including right angle groyne experiments applying refraction angles and arm length ratios with regard to three flow velocity conditions as shown in Table 1.
2.3. Methodology
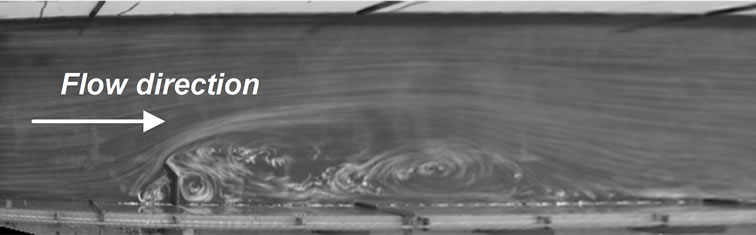
The flow field around the groyne was measured using an LSPIV (Large-Scale Particle Image Velocimetry) technique (image processing technique) that measures the flow velocity field. From the measurement result, the flow field was analyzed as in the figure below.
As shown in the figure, the measurement of the flow field around the groyne was carried out by consecutively arranging the images after correcting the distortion through the extraction of the still images from the shot images by injecting particles into the flows. Through the exposed type, the flow line shape around the groyne could be checked. For flow velocity field data analyzed through LSPIV, the vector of flow velocity could be confirmed in the flow field around the groyne through backward processing [Figures 4(a) and (b)].

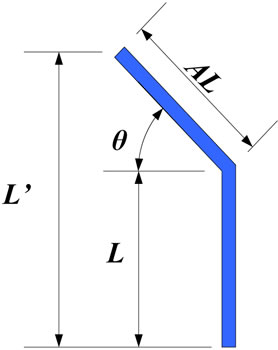
Figure 3. Definition of refraction groyne and projected length.

Table 1. Experimental conditions.
 (a) Refraction angle θ = 45˚
 (b) Refraction angle θ = 135˚
Figure 4. Measured image of flow fields.
3. Experiment Results and Analyses
The characteristics changes in the flow field of the refraction groyne recirculation area were reviewed under two conditions: 1) the groyne arm length extended from the groyne body, and; 2) the extended groyne arm’s angle change. Based on the experiment data, the impacts were compared through a comparison of the projection length (L'). Table 2 shows the results of the characteristics values of the refraction groyne recirculation area by condition as analyzed from the experiment.
Figure 5 shows the distribution of flow velocities and flows around the groyne according to the change in refraction angle and arm length. Looking into the refraction groyne’s flow characteristics, one or more vortices was/were formed in the rear part of the groyne; this is the flow characteristic exhibited in regular right angle groynes. The flow separation angle (α) and the shape of the recirculation area exhibited different forms according to the groyne’s refraction angle. In the upward refraction groyne (URG), the flow separated from the groyne’s vertical end part had relatively higher angle. Due to such flow, the width of recirculation flow in the rear part of the groyne was greater than URG and DRG.

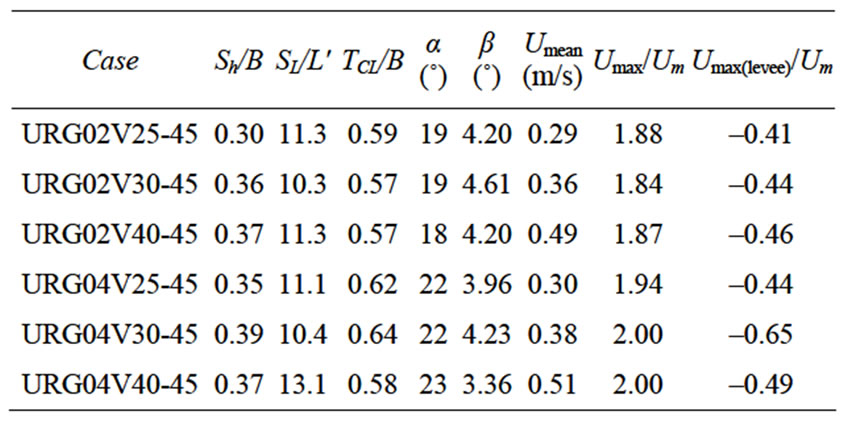
Table 2. The results of experiments.

Figure 5. Variation of flow fields with arm length and refraction angle.
Meanwhile, in the downward refraction groyne (DRG), main flow was naturally induced in the downstream part due to the reformationary of the vertical groyne end part installed in the forward direction in line with the main flow direction. Generally, because of flow concentration in the URG, high flow velocity occurs in the main watercourse section, and reverse flow velocity is strong in the recirculation flow and near the embankment.
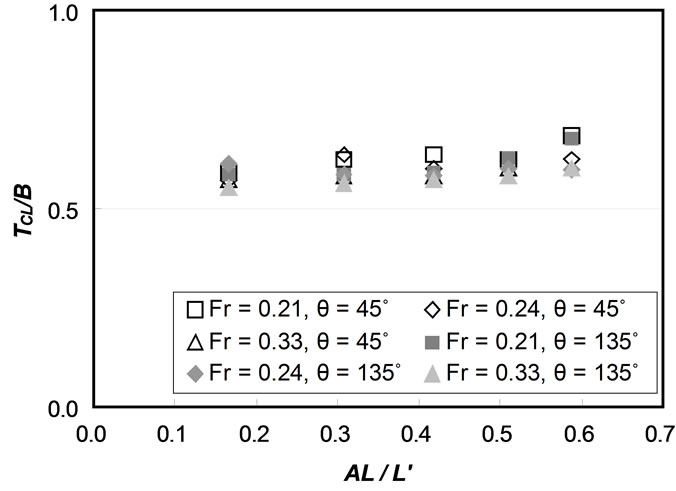
Figure 6 demonstrates the change of thalweg in the flow change characteristics according to the refraction angle and projection length changes in the case of the refraction groyne. Figure 6(a) shows the change in thalweg (TCL) with regard to the ratio of the groyne’s arm length to the refraction angle (AL/L'). Figure 6(b) illustrates the impacts of the ratio of the projection length to the refraction angle (L'/B). In general, the site where the thalweg is largest is the vortex section in the rear part of the groyne. As an observation result of this study, the vortices induced in the rear part of the upward and downward refraction groynes assumed different forms. Nonetheless, the thalweg height had no great impact on the change in the extended arm length and refraction angle, and the impact was mainly within the scope of 55% - 68% of the river width. The thalweg of the right angle groyne with the same projection length was induced at 56% - 62% of the river width based on the data in Figure 6(b); therefore, it is related to the area isolated by the groyne, i.e., projection area or length as the element that can have an impact on the main flow as a result of groyne installation. Figures 6(c) and (d) show the refraction angle, arm length, and projection length of the recirculation area formed in the downstream part of the groyne. The size of the recirculation area tended to increase gradually as the groyne’s arm length increased; it was induced in the scope of 29% - 47% of the river width. At the URG installed in the relatively reverse direction of the main flow, the recirculation area was found to have great width, but the pressure from the groyne’s vertical end part was thought to be relatively high and the flow was irregular. Moreover, higher reverse flow velocity was induced compared to DRG at the embankment. The height of the recirculation area according to the projection length was induced in the scope of 26% - 47% of the river width. In addition, the height of URG was slightly higher than that of DRG. The impacts of the main flow on the refraction angle were differently shown locally depending on the end of the groyne shapes.
 (a)
(a) (b)
(b)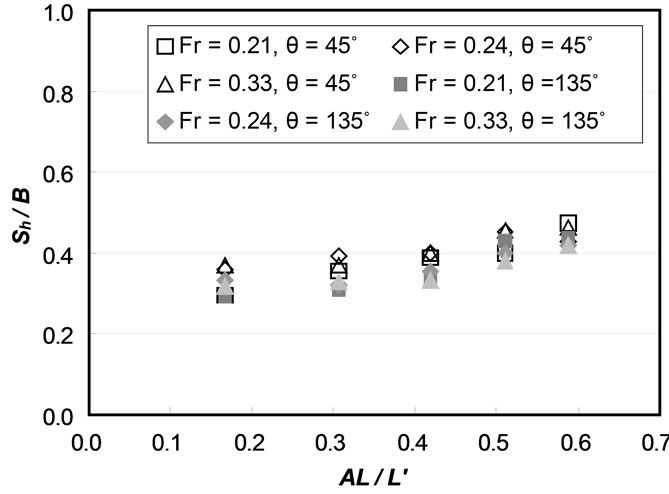 (c)
(c)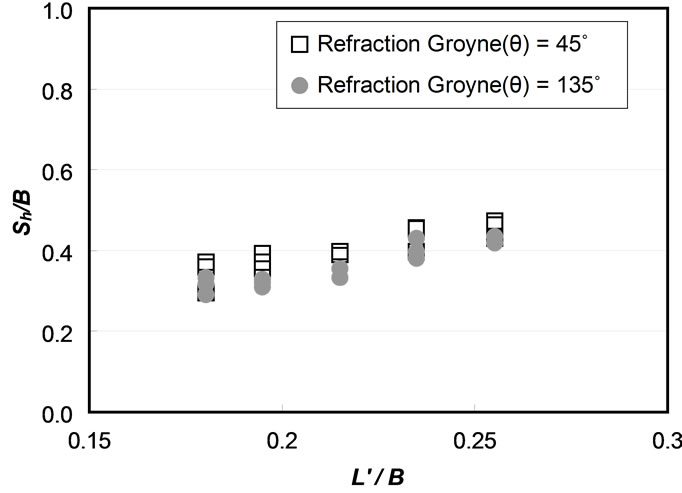 (d)
(d)
Figure 6. Variation of flow fields with refraction angle and groyne length: (a) Variation of thalweg height TCL with refraction angle θ and arm length rate; (b) Variation of thalweg height TCL with projected length rate; (c) Variation of separation height Sh with refraction angle θ and arm length rate; (d) Variation of separation height Sh with projected length rate.
For the change in thalweg, the impact of flow separation angle at the end of the groyne was large, and the flow separation angle formed a vortex at the end of the groyne to become the cause of the local vortex. Therefore, this should be adequately considered when installing a groyne. The recirculation area provides ecological habitat and refuge to fishes in times of flood aside from protecting the embankment; hence the need to identify the correlations with flow separation length (SL) instead of focusing on flow separation height.
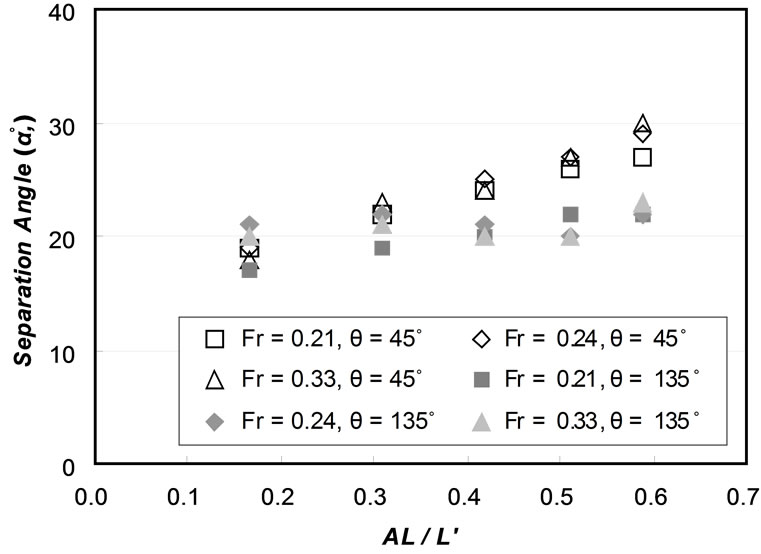
Figures 7(a) and (b) demonstrate the flow separation angles induced in the vertical end part of the refraction groyne with regard to the refraction angle, arm length, and projection length. For the flow separation angle in the groyne’s vertical end, change was clearer at URG compared to DRG and was measured to be in the scope of 19˚ - 30˚. Meanwhile, at DRG where the refraction angle was installed in the direction of flow, the change was minimal, and the flow separation angles were measured to be between 17˚ and 23˚. The flow separation angle at URG was confirmed to affect the flow separation heights [Figures 6(c) and (d)]. Compared with the projection length, the flow separation angles at the right angle groyne were measured to be between 19˚ - 30˚, showing a trend similar to that of URG.
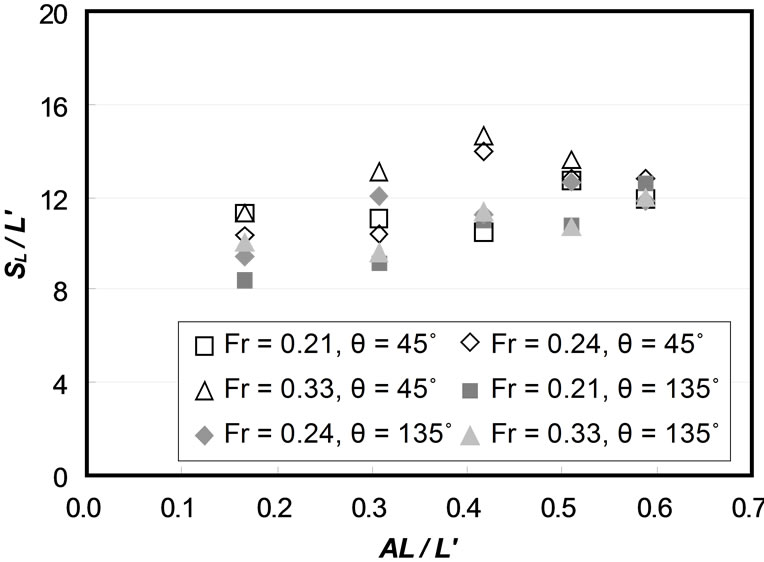
Figures 8(a) and (b) show the length of the recirculation area (SL) according to the changes in refraction angles and arm lengths of the refraction groyne. The length of the recirculation area is an important element in identifying groyne distance and embankment protection length. Figure 8(a) shows the recirculation area length according to arm length change by averaging the recirculation area lengths with projection lengths (L'). As the arm length increased, the recirculation area’s length tended to increase as well. Figure 8(b), the recirculation area lengths were 10.2 -14.7 times (URG) and 8.4 - 12.7 times (DRG) the river width.
 (a)
(a)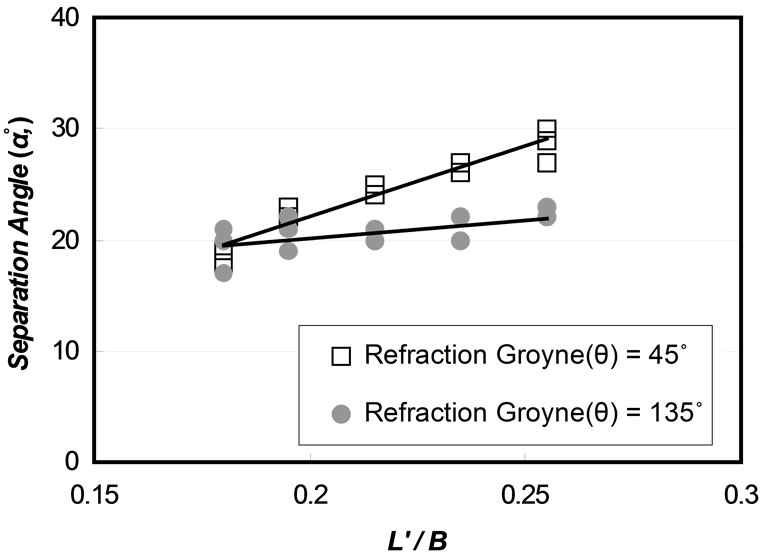 (b)
(b)
Figure 7. Variation of α with refraction angle and groyne length: (a) Separation angle of groyne tip on arm length rate; (b) Separation angle of groyne tip on projected length.
 (a)
(a)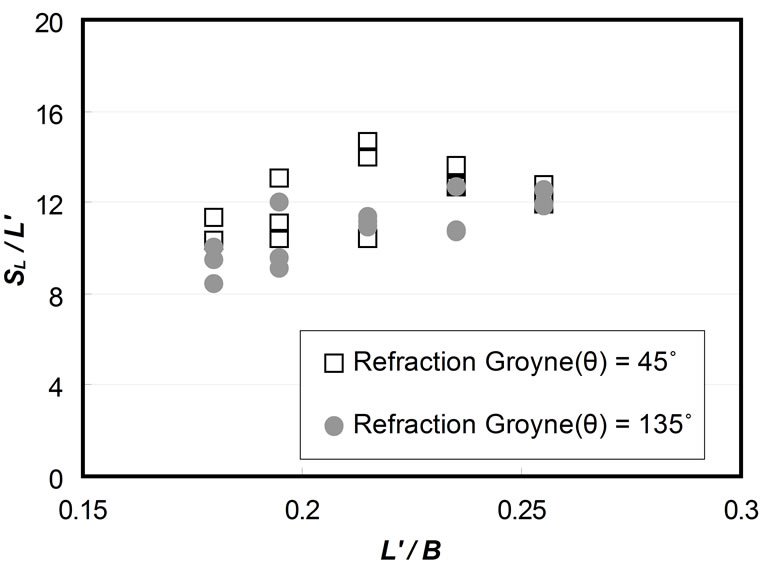 (b)
(b)
Figure 8. Variation of SL with refraction angle and groyne length: (a) Variation of Separation Length SL with Refraction Angle θ and Arm Length rate; (b) Variation of Separation Length SL with Projected Length rate.
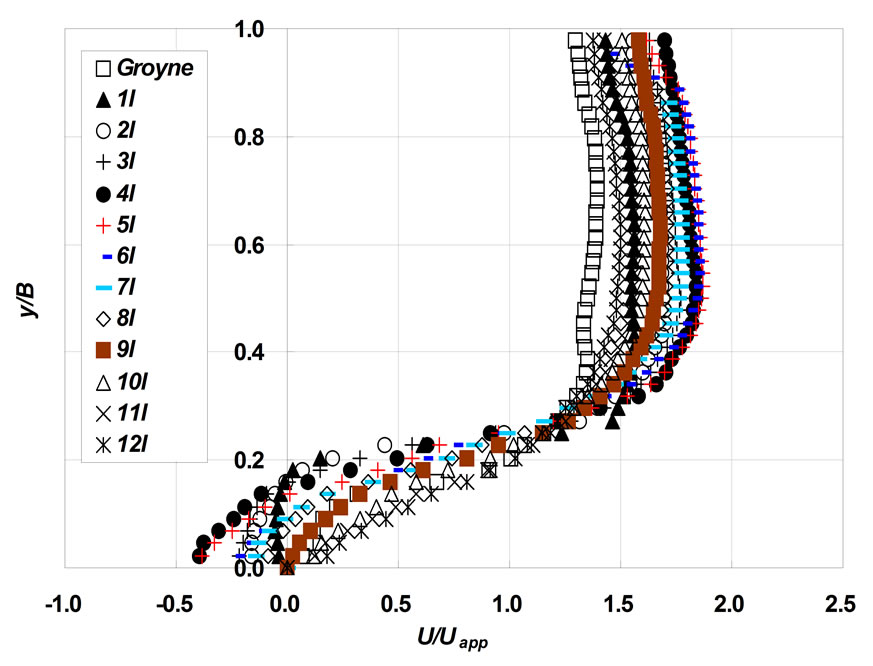
Figures 9(a) and (b) demonstrate the lateral direction flow velocity distribution around the refraction groyne and right angle groyne with the same projection length. The flow velocity distribution (X axis) by profile was made unlimited for the flow velocity (Uapp) in the inflow part. For the Y axis, lateral direction distance was made unlimited with watercourse width (B). For groyne length, lateral flow velocity distribution was found to be up to 12 times (12L') the groyne length based on the projection length for impact review according to the projection length. Maximum flow velocity in the main flow section was about 2-fold at URG and 1.8-fold at DRG and right angle groyne. Mostly, maximum flow velocity was induced at the site where the length was 6 times (6L') the projection length.
At the recirculation area, reverse flow velocity distribution was dominant at the mainly right angle groyne; it was about 0.3-fold of the flow velocity in the inflow part. At URG, the size of reverse flow velocity was about 0.6 fold of that in the inflow part. At DRG, it was about 0.4-fold.
Looking into the section where recirculation flow was restored, it was induced at the sites of 10L', 9L', and 12L' or higher at the upward, downward, and right angle groynes, respectively. Generally, the flow at the right angle groyne shows stable distribution. From this, stable flow (in the main watercourse and recirculation areas) at the right angle groyne was considered to be designed stably. For flow in the main watercourse at DRG, the flow showed the same trend as the right angle groyne, but recirculation became smaller. Compounded with the flow induction function in the refraction part of the groyne’s end, this can be an important merit when installing groyne. Note, however, that approaching URG as an auxiliary groyne concept is considered necessary when designing groyne since high flow velocity is induced in the overall groyne area and main current section.
Figure 10 identifies the maximum flow velocity according to the refraction angle (θ) and shows the maximum flow velocity ratio (Umax/Um) with regard to the ratio of watercourse width to arm length. The maximum flow velocity ratio showed a gradual uptrend as the arm length increased but did now show great difference; maximum flow velocity was induced between 1.7 - 2.25 times of average flow velocity in the inflow part. For the maximum flow velocity ratio according to the refraction angle, it was slightly higher at URG with 45 degrees refraction angle compared to DRG. The maximum flow velocity at URG was 1.84 - 2.25 times. At DRG with 135 degrees refraction angle, it was 1.70 - 2.07 times. Figure 11 exhibits the maximum flow velocity ratio according to the refraction angle and projection length. As projection length increased, the maximum flow velocity increased. The right angle groyne with the same projection length showed a trend similar to that of DRG. The site where maximum flow velocity was induced was between 4 - 6 times the site of the projection length regardless of the refraction angle from the groyne installation site. In the straight line watercourse where the refraction groyne was installed, the refraction angle did not dominantly affect the main flow area but had an impact on the protruding groyne length (projection length). The data is considered valuable in deciding groyne length as reference when designing groynes.
 (a)
(a)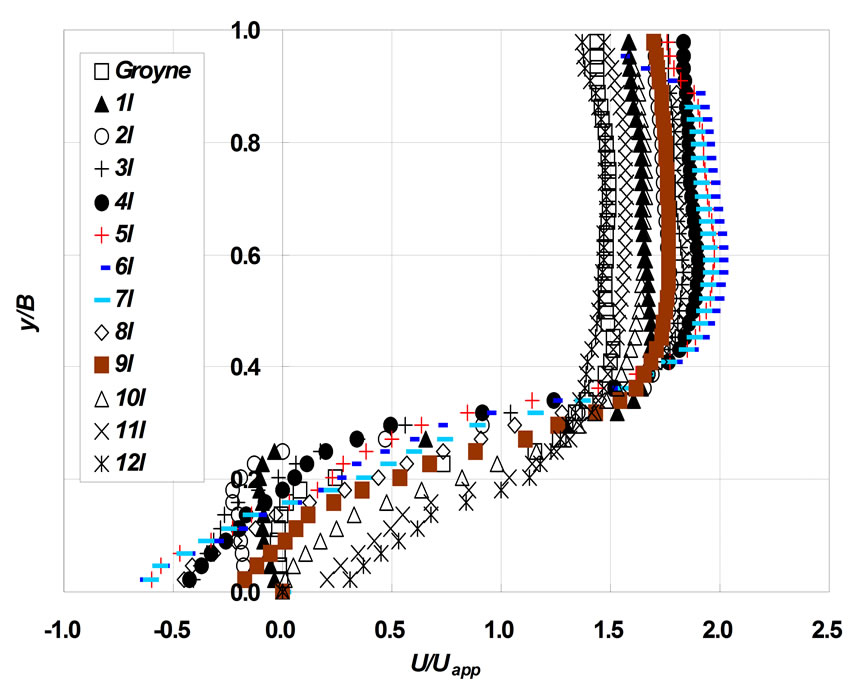 (b)
(b)
Figure 9. Velocity distributions of groyne fields: (a) URG04V30(θ = 45˚, L' = 0.39); (b) DRG04V30 (θ = 135˚, L' = 0.39).
Varied flow velocity distribution in the recirculation area affects sedimentation, embankment protection, and provision of ecological habitat. Flow velocity distribution near the embankment at the recirculation area differs depending on the groyne shape. In case of the non-penetrating groyne, reverse flow was clearly exhibited. Maximum flow velocity ratio in the downstream part from the groyne installation site is an element for evaluating embankment protection. For varied flow velocity distribution at the circulation area, flow velocity near the embankment at the refraction groyne was unlimited, with average flow velocity in the inflow part (Figures 12 and 13); it was analyzed according to the change in arm length and projection length. Maximum flow velocity ratios near the embankment were diversely distributed according to the refraction angle. Moreover, identifying regular distribution was difficult. Relatively large reverse flow was induced at URG. According to the projection length, reverse flow size was small in the order of downward and right angle groynes compared to the upward groyne, but a certain trend could not be found.
4. Conclusions
The flow field characteristics change in the refraction groyne’s recirculation area was reviewed under two conditions: 1) the groyne body arm length change, and; 2) the refraction angle change. For the flow characteristics change, the impacts were compared by projection length (L'). The following were the findings of this study:
The size of the recirculation area in the downstream part of the groyne showed an uptrend as the groyne’s arm length increased, and the area was formed in the scope of 29% - 47%. In the upward refraction groyne installed in reverse direction from the main flow direction, the width of the recirculation area was measured to be greater.
The length of the recirculation area was 10.2 - 14.7

Figure 10. Maximum velocity of main channel on arm length rate.

Figure 11. Maximum velocity of main channel on projected length.

Figure 12. Maximum velocity near levee on arm length rate.

Figure 13. Maximum velocity near levee on projected length.
times (URG), 8.4 - 12.7 times (DRG), and 10.6 - 13.8 times (right angle groyne) the projection length (L').
At URG, the flow angle separated from the vertical end part was large, and the width of the recirculation flow in the rear part of the groyne was greater than that of DRG owing to such flow form. At DRG, main flow was naturally induced in the downstream part because of the refraction part of the groyne’s vertical end part installed in the forward direction with the main flow direction. For URG, flow disturbance by refraction arm was greater than that of the downward refraction groyne; thus, high flow velocity was generated in the main watercourse section. For the maximum flow velocity ratio in the main flow section, it gradually increased as the arm length ratio rose; maximum flow velocity was about 1.84 - 2.25 times the flow velocity in the inflow part. At DRG, the ratio was measured to be 1.70 - 2.07 times; hence the approximately 10% more increases at URG. For the flow velocity at the embankment of the recirculation area, URG had higher flow velocity overall, although there was a difference in the refraction arm between URG and DRG.
Consequently, the recirculation area in the downstream part at URG is greater than that of DRG, and there can be some advantages in terms of fishes’ habitat and refuge. Note, however, that DRG is considered to be advantageous compared to URG in terms of flow change of the main watercourse, local vortex erosion, and flow velocity impacts in the embankment of the recirculation area around the refraction groyne.
5. REFERENCES
- H. Teraguchi, H. Nakagawa and H. Zhang, “Study on Flow and Bed Deformation around Impermeable and Permeable Groins,” 8th ICHE, Nagoya, 8-12 September 2008, pp. 367-370.
- A. McCoy, G. Constantinescu, M. Koken and L. Weber, “Effect of Relative Submergence on the Flow and Mass Exchange Processes in a Channel with Two Lateral Groynes,” 32nd IAHR Congress, Venice, 1-6 July 2007, p. 699.
- E. Martinez, R. Ettema and A. Lachhab, “Scour Experiments on Dike Angle, Porosity, and Hook for a Thin Dike,” 1st ICSF-1, College Station, Texas, 17-20 November 2002, pp. 364-372.
- B. Mohsen, F. Ramin, D. A. Ahmad and Z. A. Mirkhalegh, “Experimental Investigation of Local Scouring around a Series of L-Head Groynes,” 8th ICHE, Nagoya, 8-12 September 2008, pp. 383-384.
- J. G. Kang, H. K. Yeo and S. J. Kim, “An Experimental Study on Tip Velocity and Downstream Recirculation Zone of Single Groyne Conditions,” Korea Water Resources Association, Vol. 38, No. 2, 2005, pp. 143-153. doi:10.3741/JKWRA.2005.38.2.143
- FHWA, “Design of Spur-Type Streambank Stabilization Structures,” US DOT, FHWA, Rep. No. FHWA/RD 84/101, McLean, 1985.