Engineering
Vol. 3 No. 6 (2011) , Article ID: 5342 , 13 pages DOI:10.4236/eng.2011.36073
Machinability Study of Titanium (Grade-5) Alloy Using Design of Experiment Technique
Mechanical Engineering Department, NIT Hamirpur, Hamirpur, India
E-mail: santramchauhan@gmail.com
Received February 19, 2011; revised May 25, 2011; accepted June 1, 2011
Keywords: Titanium (grade-5) alloy, Full factorial experiment design, Surface roughness, Tangential force, Turning process
ABSTRACT
This paper presents the findings of an experimental investigation into the effects of cutting speed, feed rate, depth of cut and approach angle in turning of titanium (Grade 5) alloy. A two-level factorial experiment has been used to accomplish the objective of the experim-ental study. The main cutting force, i.e. tangential force (Fc) and surface roughness (Ra) were the response variables investigated. The experimental results indicate that the proposed mathematical models suggested could adequately describe the performance indicators within the limits of the factors that are being investigated. The feed, cutting speed and depth of cut is the most significant factor that influences the surface roughness and the tangential force. However, there are other factors that provide secondary contr-ibutions to the performance indicators.
1. Introduction
Titanium and its alloys are an important class of aerospace engineering materials due to their excellent combination of strength and fracture toughness as well as low density [1-4]. However, these materials are regarded as difficult to machine because of their low thermal conductivity and high chemical reactivity with cutting tool materials [5]. Moreover, the low thermal conductivity of Titanium inhibits dissipation of heat within the work piece causing a higher temperature at the cutting edge and generating for higher cutting speed a rapid chipping at the cutting edge which leads to catastrophic failure. In addition, chip morphology significantly influences the thermo-mechanical behavior at the work piece/tool interface, which also affects the tool life [6]. In general, the machinability of material provides an indication of its adaptability to manufacturing by a machining process. Good machinability can be defined as an optimal combination of factors such as low cutting force, good surface finish, low power consumption, high material removal rate, accurate and consistent work piece geometrical characteristics, low tool wear rate and good curl or chip breakdown of chips [7-8].
The force acting on a tool is an important aspect of machining. Knowledge of the cutting force is needed to estimate the power requirements and ensure that the machine tool elements, tool holder, and fixtures are adequately rigid and free from vibrations. The cutting force vary with the tool angle, cutting speed, feed rate, depth of cut, approach angle, and accurate measurement of the tool forces are helpful in optimizing the tool design [9]. With regard to quantity characteristics of turning parts, some of the problems include surface roughness, burr, and tool wear etc. The machining parameters such as cutting speed, feed rate, depth of cut, approach angle, features of tools, work piece material and coolant conditions will highly affect the response variables [10]. It is necessary to select the most appropriate machining settings in order to improve cutting efficiency, process at low cost, and produce high-quality products.
The optimization techniques of machining parameters through experimental methods and mathema-tical and statistical models have grown substantially over time to achieve a common goal of improving higher machining process efficiency [11]. To construct an approximation model that can capture interactions between n design variables, a full factorial approach may be necessary to investigate all possible combinations [12]. A factorial experiment is an experimental strategy in which design variables are varied together, instead of one at a time. The lower and upper bounds of each of n design variables in the optimization problem needs to be defined. The allowable range is then discredited at different levels. If each of the variables is defined at only the lower and upper bounds (two levels), the experimental design is called 2n full factorial [13]. Factorial designs can be used for fitting second-order models. A second-order model can significantly improve the optimization process when a first-order model suffers lack of fit due to interaction between variables and surface curvature. By careful design of experiments, the objective is to optimize a response (output variable) which is influenced by several independent variables (input variables). The surface quality, which is measured in terms of surface roughness, is utilized to evaluate the performance of the turning operation. The surface roughness is known to be significantly affected by different cutting parameters, i.e., the depth of cut, spindle speed and feed rate [14].
The present work deals with the machinability study of titanium (grade-5) alloy using design of experiment technique. The experimentation was carried out with Cubic Boron Nitride (CBN) cutting tool insert. An attempt has also been made to optimize the surface roughness prediction model using Design of Expert Software (8.0.4.1) version is used to optimize the objective function. The surface quality, which is measured in terms of surface roughness (Ra), and tangential force (Fc), is utilized to evaluate the performance of the turning operation. Therefore, the surface roughness and tangential force will be minimized if the appropriate cutting conditions are selected. Experimental design methods, such as the two-level factorial (2k) design, are frequently utilized to model the surface roughness, and tangential force so the desired levels of machining parameters are achieved. M. Thomas [15] used a full factorial design involving six factors to investigate the effects of cutting and tool parameters on the resulting surface roughness and on built-up edge formation in the dry turning of carbon steel.
Wang and Feng [16] utilized a factorial design to develop an empirical model for surface quality in turning processes. The predicting model are based on work piece hardness, feed rate, cutting tool point angle, depth of cut, spindle speed and cutting time. Choudhury and El-Baradie [17] had used RSM and 23 factorial designs for predicting surface roughness when turning high-strength steel. A full factorial experimental design was used to determine the effects of feed rate and cutting speed on surface finish. Arbizu and Luis Perez [18] deployed a 23 factorial design to construct a first order model to predict the surface roughness in a turning process of test pieces which followed ISO 4287 norm. Ozel, Hsu and Zeren [19] studied the effects of work piece hardness, feed rate, cutting speed and cutting edge geometry on multi responses, surface roughness and resultant forces, in the finish hard turning of AISI H13 steel.
Sahin and Motorcu [20] utilized RSM to construct a surface roughness model for the turning process of AISI 1040 mild steel coated with TiN. Three machining parameters, depth of cut, cutting speed and feed rate, were included in the predicted model. The experiments were conducted using two-level fractional factorial experiments while the statistical analysis was concluded in the form of analysis of variance (ANOVA). Other experimental design approaches commonly utilized for modeling responses are the Taguchi technique and response surface methodology (RSM).
In this reported work, we use design of experiment (DOE) technique to quantify the relationship between the machining parameters, machining parameters such as cutting speed, feed rate, depth of cut and approach angle are considered as independent variables. Based on the preliminary experiments the effect of these machining parameters on surface roughness (Ra) and cutting force or tangential force (Fc) have been investigated through the set of planned experiments based on the two-level factorial design.
2. Methodology
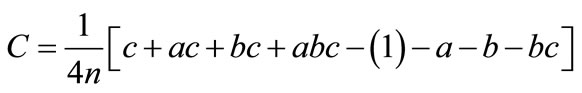
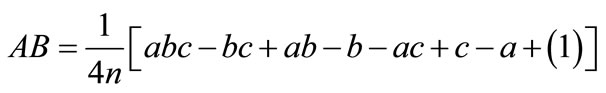
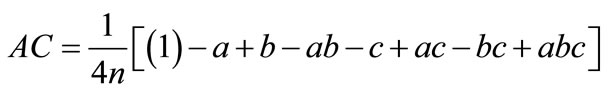
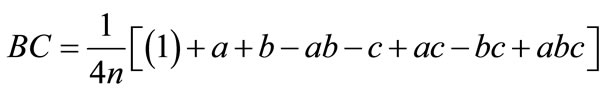
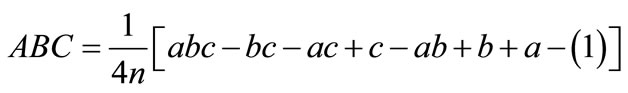
Factorial designs are the experiment in which all possible combinations of the levels of the factors are investigated. This design is one of the mostly used types of experiment involving the study of the effects of two or more factors. As experimental results, the effect of primary factor or main effect is defined to be the change in response caused by a change in the level of the factor. In some experiments, when the difference in response between the levels of one factor is not the same at all levels of the other factor, there is an interaction between the factors. The most important case of factorial design is the design for k factors, when the experiment is conducted at two levels for each factor, the high and low levels of a factor. In this case, a complete replicate of such a design requires (2k) observations or 2k factorial design. As shown in Figure 1, all treatment combinations can display geometrically as a cube.
Fork = 3, the average main effects and interaction effects are:
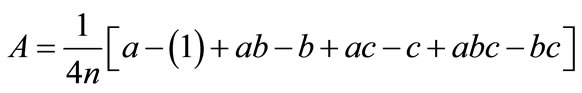
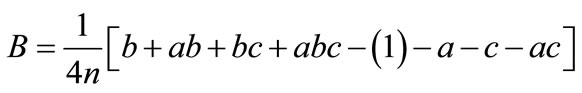
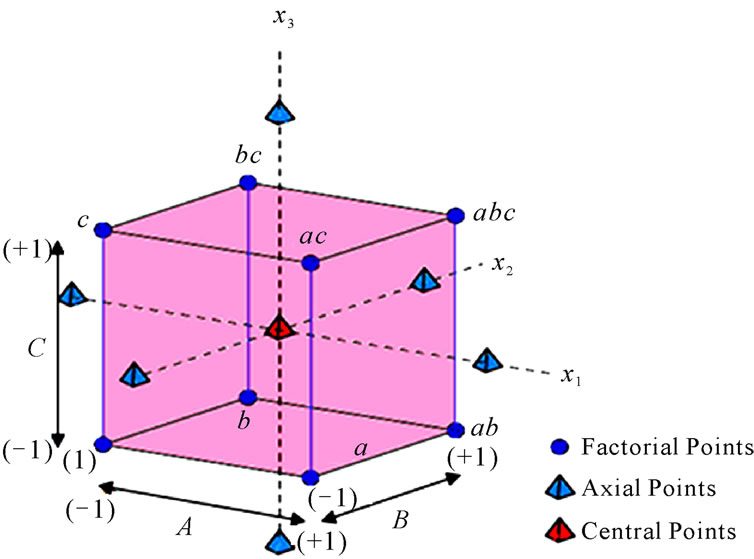
Figure 1. Geometric view of (23) factorial design.
3. Experimental Details
The machining in turning experiments has been carried out in order to obtain experimental data in the dry condition on a SPRINT 16TC CNC Turning Centre. The turning center has spindle speed of 40 - 4000 rpm, maximum turning diameter of 225 mm and a maximum turning length of 325 mm and spindle nose of A 2-5. The cutting tool selected for machining titanium (Grade-5) alloy was cubic boron nitride (CBN) of Kennametal make (CCGW 09T308 S01015MT B1610) having 0.8 nose radius. This material is suitable for a wide variety of aerospace, medical and automotive-type applications. The surface hardness of the sample is 36 HRC. The chemical composition of titanium (Grade-5) alloy is given in Table 1.
The work piece material used has a dimension of 200 mm in length and 15 mm in diameter. The experiments were conducted to analyze the effect of cutting speed, feed rate, depth of cut and approach angle on the surface roughness and tangential or cutting force. As a result (Table 2), each factor was set to the low (−1) and high (+1) levels. Two replications of each cutting conditions were conducted resulting in a total of 32 tests. A lathe
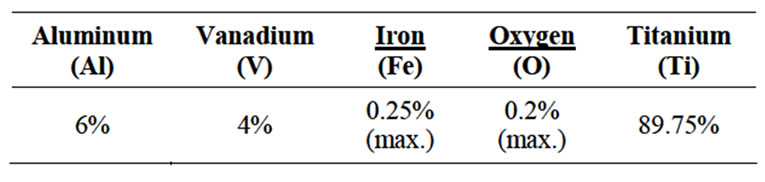
Table 1. Chemical composition titanium (Grade-5) alloy wt%.
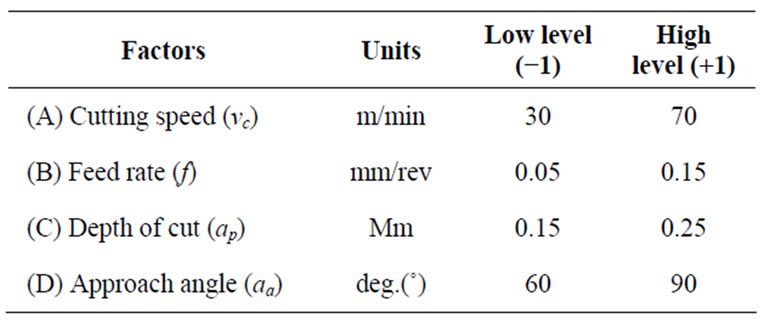
Table 2. Factors and levels of machining parameters.
tool dynamometer in conjunction with XKM software and a computer were used to measure and record the experimental data. Surface roughness tester was used to measure the surface roughness of the machined surface. Input parameters of the models are cutting speed (vc), feed rate (f) and depth of cut (ap) and approach angle (aa). Output parameter of the models is the corresponding surface roughness (Ra), and tangential force (Fc).
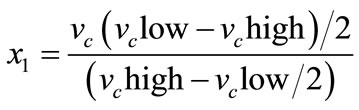
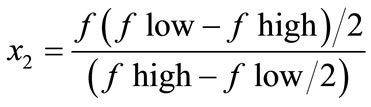
The relationship between the coded factors and the actual factors are shown in Equations (1)-(4).
 (1)
(1)
 (2)
(2)
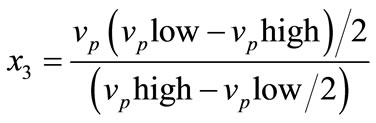 (3)
(3)
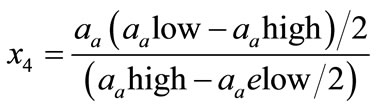 (4)
(4)
where x1 is the coded factor that represents the cutting speed (vc), x2 is the coded variable that represents the feed rate (f), x3 is the coded variable that represents the depth of cut (vp) and x4 is the coded variable that represents the approach angle (aa). Due to the limited number of inserts available, each experimental run was repeated twice and each surface turned was measured at three different locations. As far as possible the run were performed in a short order fashion.
4. Result and Discussion
The selected experimental design is 23 full factorial designs with two replicates and the complete design matrix is shown in Table 3. The experimental results of surface roughness and tangential force are tabulated in the design matrix. The experimental plans were developed for establishing the quadric model of Ra and Fc. These results were input into the Design Expert software. Therefore,
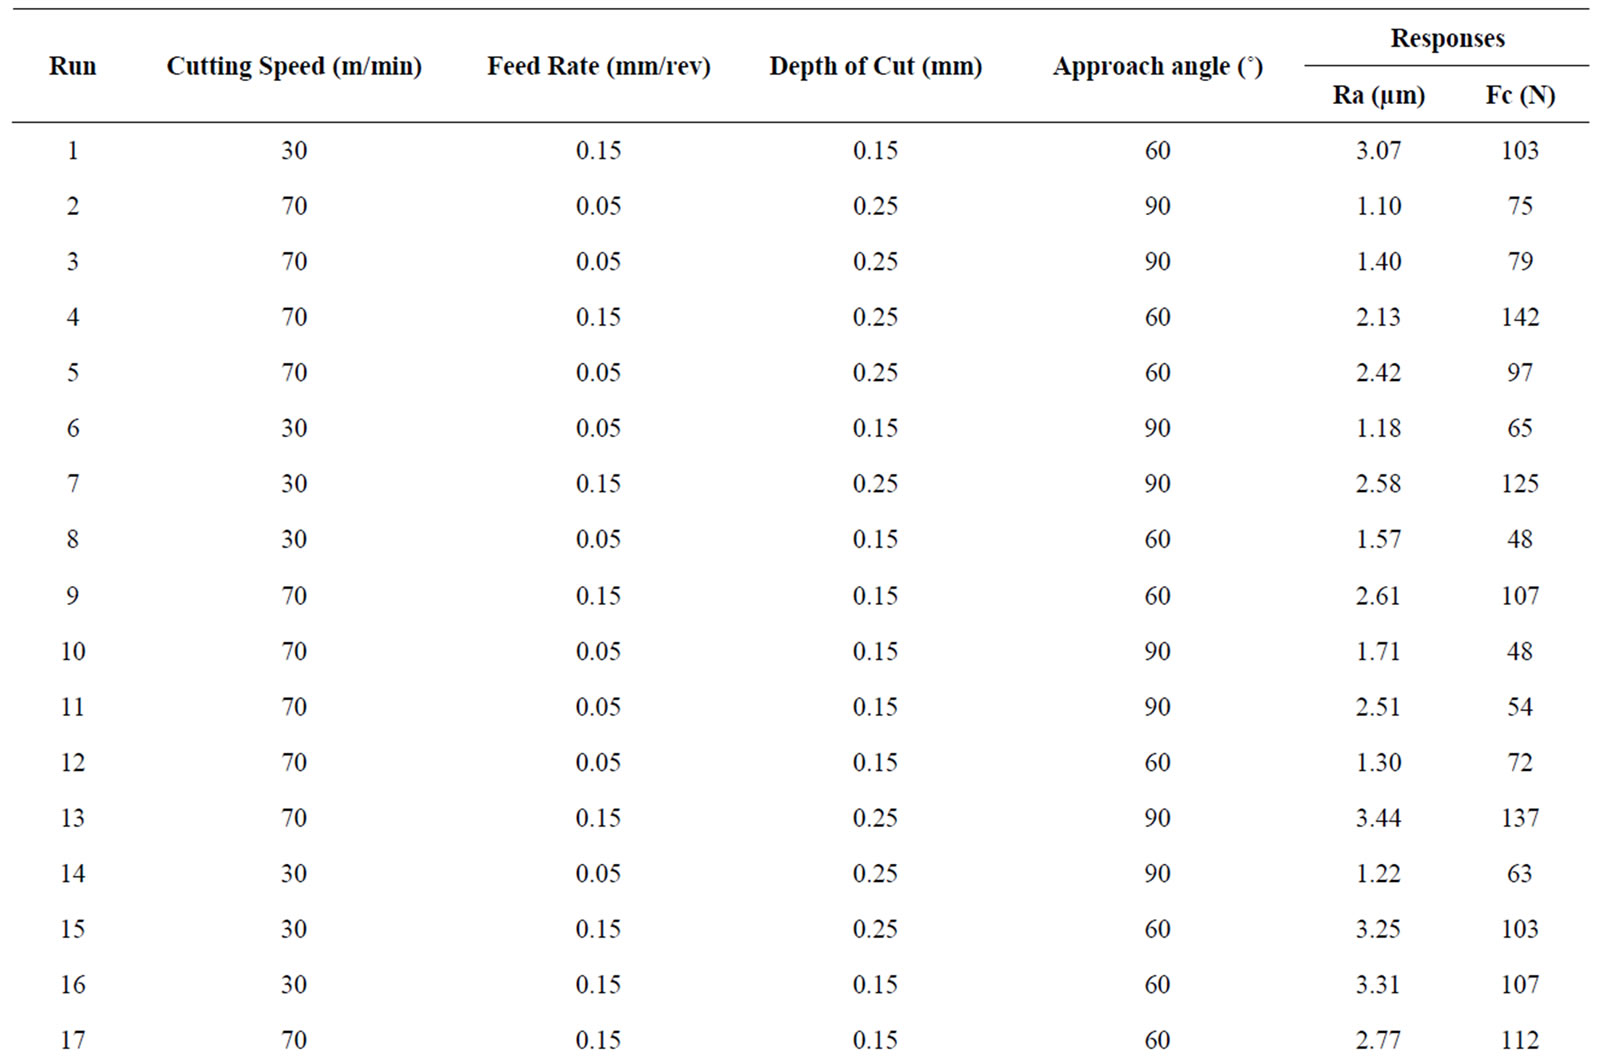
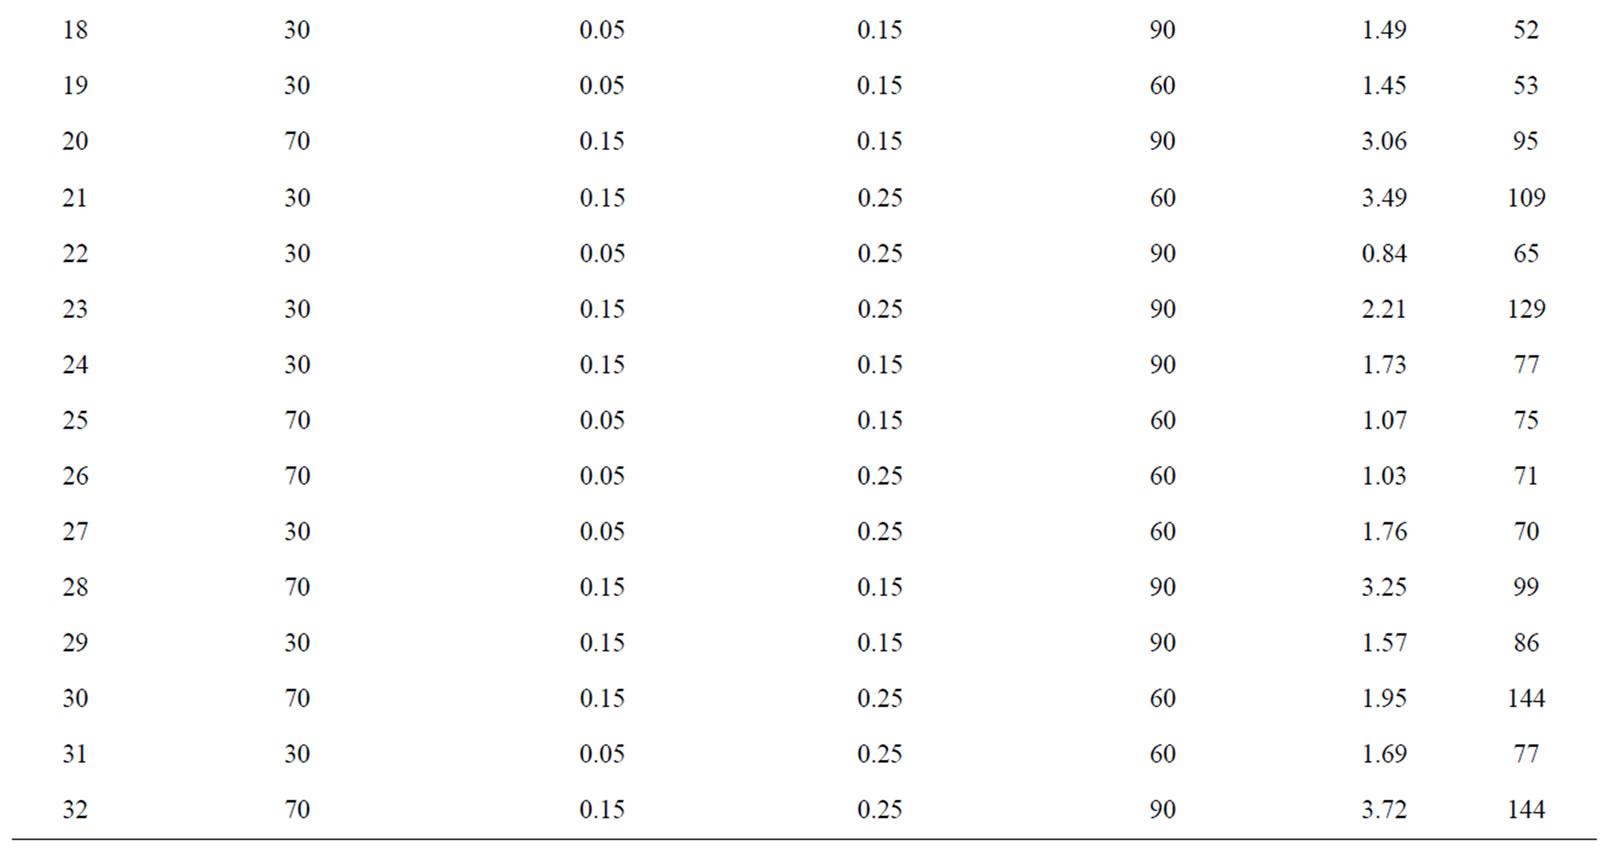
Table 3. Complete design matrix and experimental results.
the test for significance of the regression model, for significance on individual model coefficients and the test for lack-of-fit were performed to verify the goodness of fit of the obtained quadratic model.
The analysis of variance (ANOVA) is usually applied to summarize the above tests performed. Without performing any transformation on the response, examination of the Fit Summary output revealed that the quadratic model is statistically significant for both responses and therefore it will be used for further analysis. The value of model “P > F” for the model is less than 0.05, which indicates that the term in the model have a significant effect on the response. The value of P < 0.0001 indicates that there is only a 0.01% chance that a “model Fvalue” this large could occur due to the noise. Values greater than 0.1000 indicate the model term is not significant.
According to the half-normal plot in Figure 2, (B) feed rate (f) contribute the highest effect on the surface roughness (Ra) and tangential force (Fc), followed by (A) cutting speed (vc), (C) depth of cut (ap)) in that order. This result is confirmed by the basis of the analysis of variance (ANOVA) which points out that all four main effects (A, B, C, D) are highly significant, since their p-values are much smaller than 0.05.
4.1. ANOVA Analysis
The statistical significance of the fitted quadratic model for the tangential force (Fc) and the surface roughness were evaluated by the F-test of the ANOVA, and shown in Tables 4 and 5. When the values of the “Prob. > F” in the Tables 4 and 5 for the term of models are less than 0.05, indicates that the obtained models are considered to be statically significance, which is desirable, as it demonstrates that the terms in the model have a significant effect on the responses.
The other important coefficient R2, which is called determination coefficients in the resulting ANOVA table, is defined as the ratio of the explained variation to the total variation and is a measure of the degree of fit. When R2 approaches to unity, the better the response model fits the actual data. It exists that the less is the difference between the predicted and actual values.
From Table 4 the Model F-value of 12.60 implies the model is significant. There is only a 0.01% chance that a “Model F-Value” this large could occur due to noise. Values of “Prob > F” less than 0.0500 indicate model terms are significant. In this case B, AD, ABD, BCD are significant model terms. Values greater than 0.1000 in-
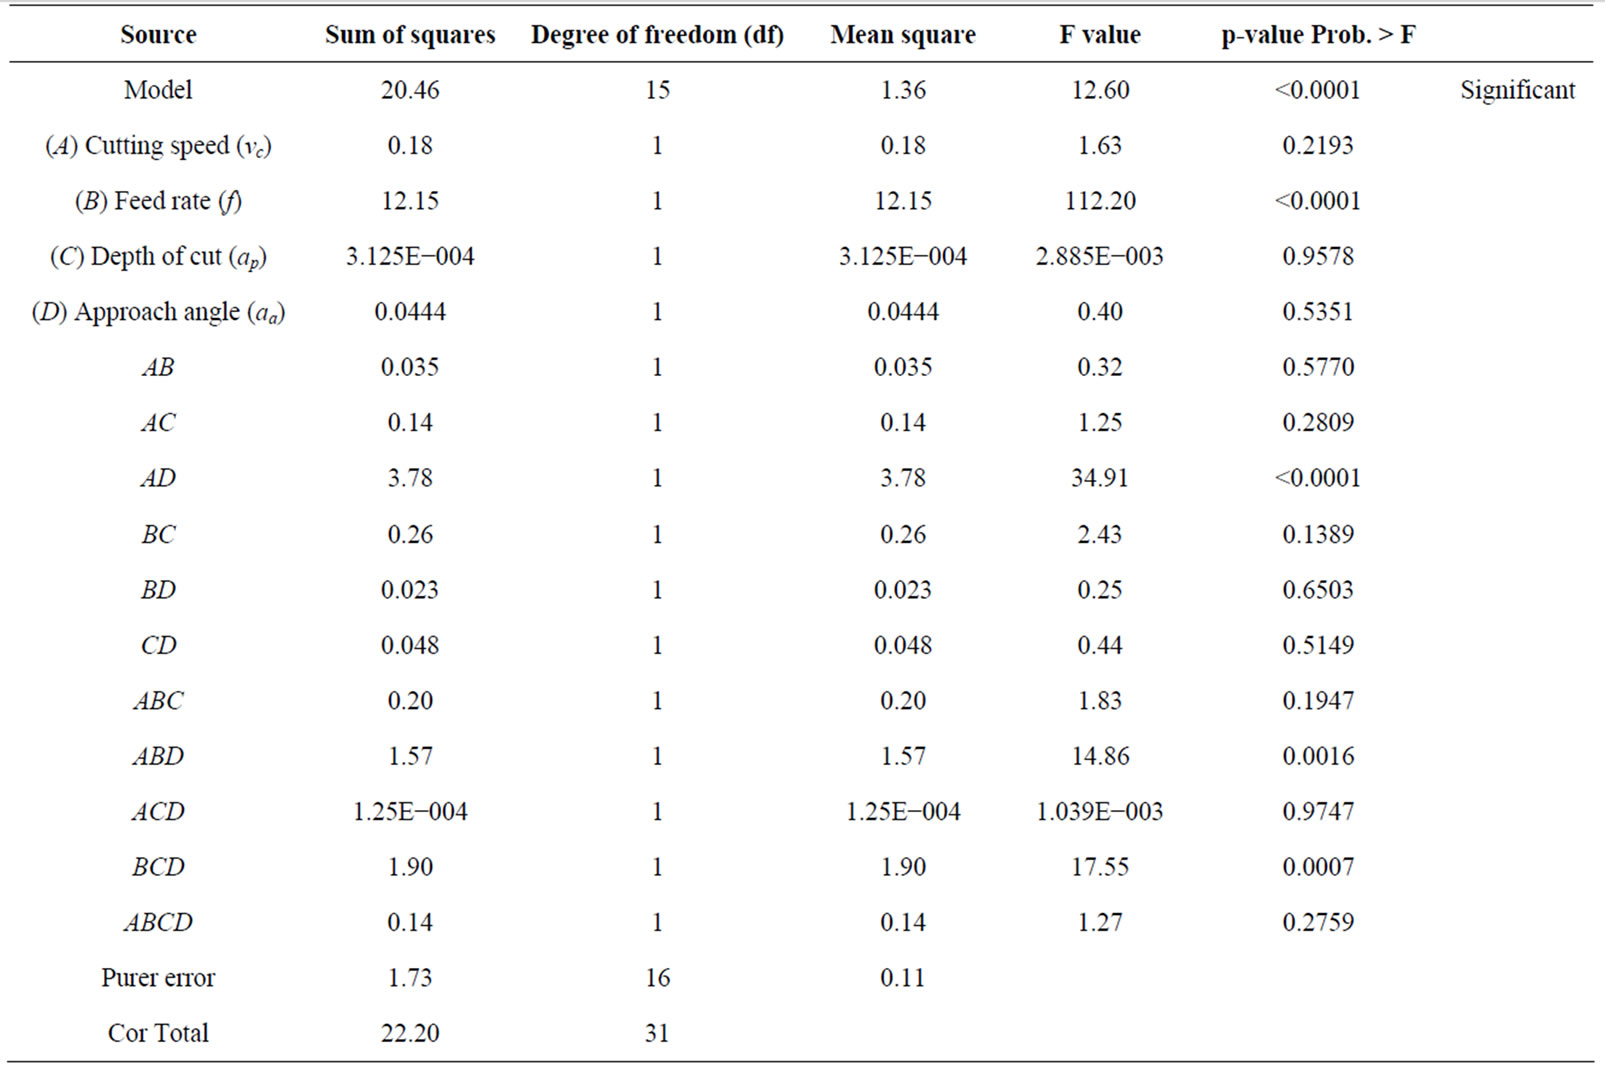
Table 4. Analysis of variance (ANOVA) for surface roughness (Ra, µm).
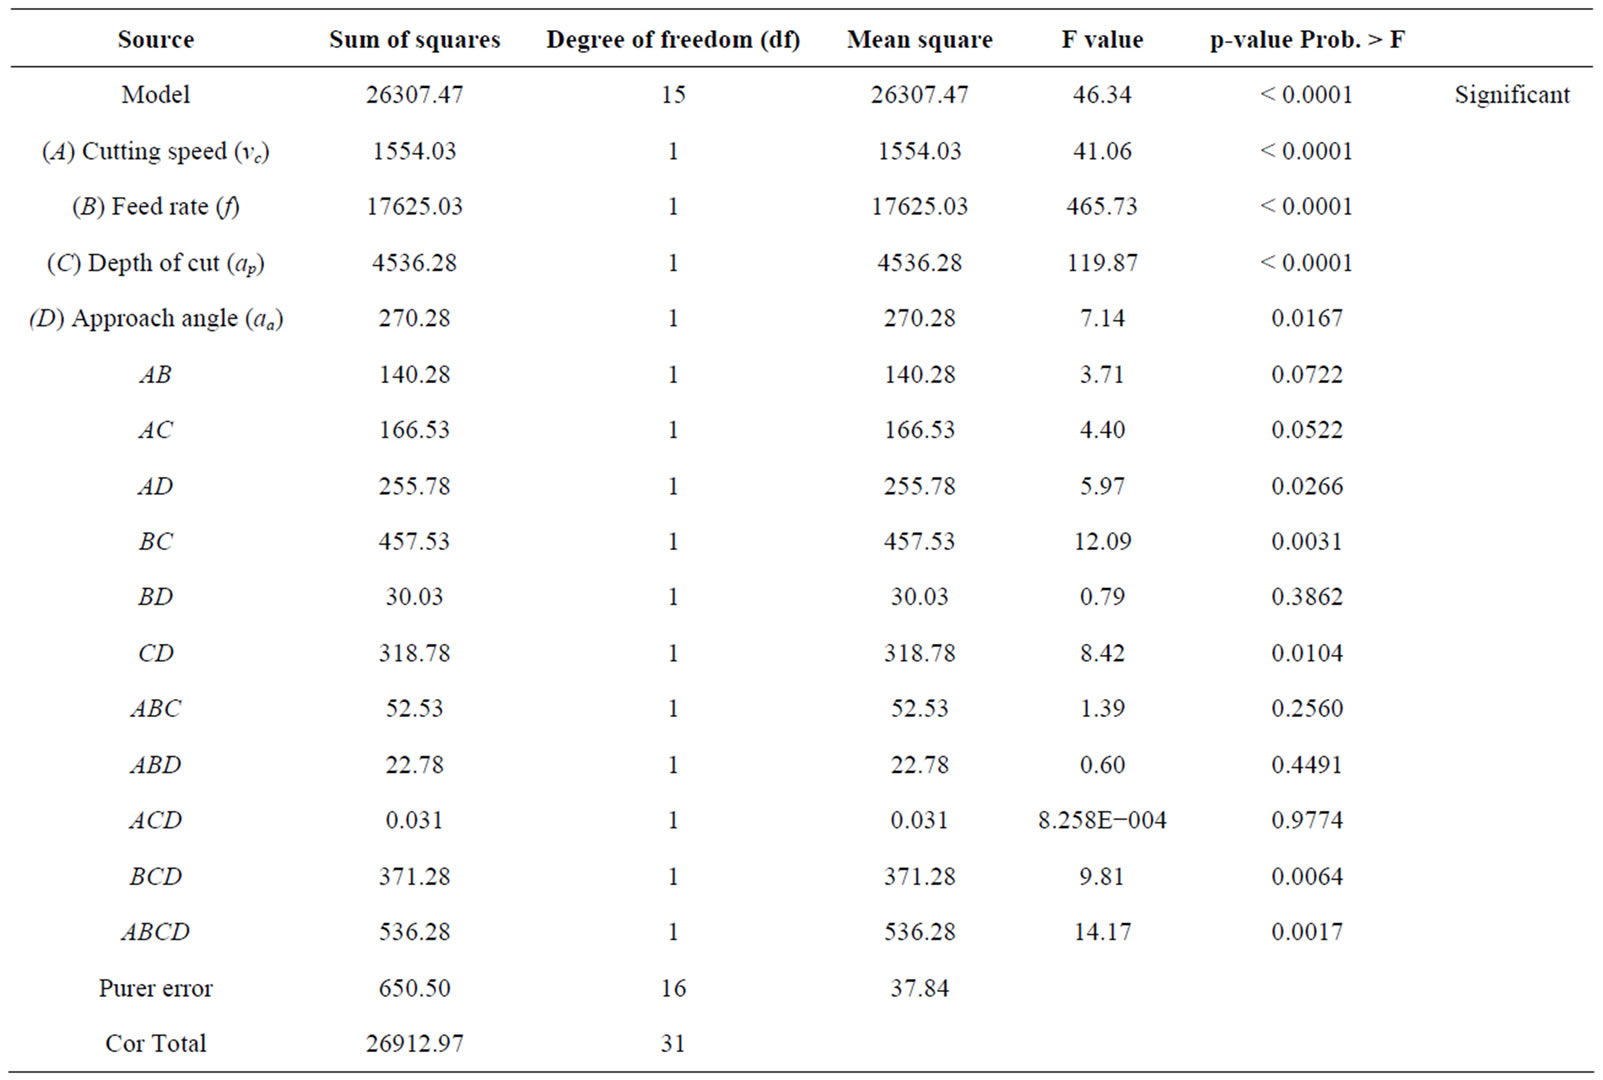
Table 5. Analysis of variance (ANOVA) for tangential force (Fc, N).
dicate the model terms are not significant. The “Pred R-Squared” of 0.6877 is in reasonable agreement with the “Adj R-Squared” of 0.8487. “Adeq Precision” measures the signal to noise ratio. A ratio greater than 4 is desirable. The ratio of 10.958 indicates an adequate signal. This model can be used to navigate the design space.
Also from the Table 5 the Model F-value of 46.34 implies the model is significant. There is only a 0.01% chance that a “Model F-Value” this large could occur due to noise. Values of “Prob > F” less than 0.0500 indicate model terms are significant. In this case A, B, C, D, AD, BC, CD, BCD and ABCD are significant model terms. Values greater than 0.1000 indicate the model terms are not significant. The “Pred R-Squared” of 0.9100 is in reasonable agreement with the “Adj R Squared” of 0.9564. “Adeq Precision” measures the signal to noise ratio. A ratio greater than 4 is desirable. The ratio of 21.265 indicates an adequate signal. This model can be used to navigate the design space.
The value of the adequate precision (AP) in this model, which compares the range of predicted value at the design point to the average prediction error, is well above 4. The value of ratio is greater than 4 which present the adequate model discrimination. These obtained models present higher values of the determination coefficients (R2) and adequate precision (AP) at the same time. These values were obtained as shown in Tables 6 and 7.
The regression model for surface roughness and tangential force in terms of actual factors is shown as follows:
Surface Roughness (Ra) = −2.63531 − 0.12653* Cutting speed + 77.54375* Feed rate + 11.03125* Depth of cut + 0.069167* Approach angle + 0.55437* Cutting speed * Feed rate + 0.75812* Cutting speed* Depth of cut + 1.44583E-003* Cutting speed* Approach angle − 44.37500* Feed rate * Depth of cut − 1.19833* Feed rate * Approach angle − 0.25792* Depth of cut * Approach angle − 8.13750* Cutting speed * Feed rate* Depth of cut − 2.75000E-00* Cutting speed * Feed rate * Approach angle − 8.87500E-003* Cutting speed* Depth of cut* Approach angle + 2.12500* Feed rate* Depth of cut* Approach angle + 0.087500* Cutting speed * Feed rate* Depth of cut ⃰ approach angle.
Tangential force (Fc) = −498.25000 + 9.50000* Cutting speed + 5888.75000 * Feed rate +2521.25000* Depth of cut + 6.85521* Approach angle − 89.12500* Cutting speed* Feed rate − 41.37500* Cutting speed*
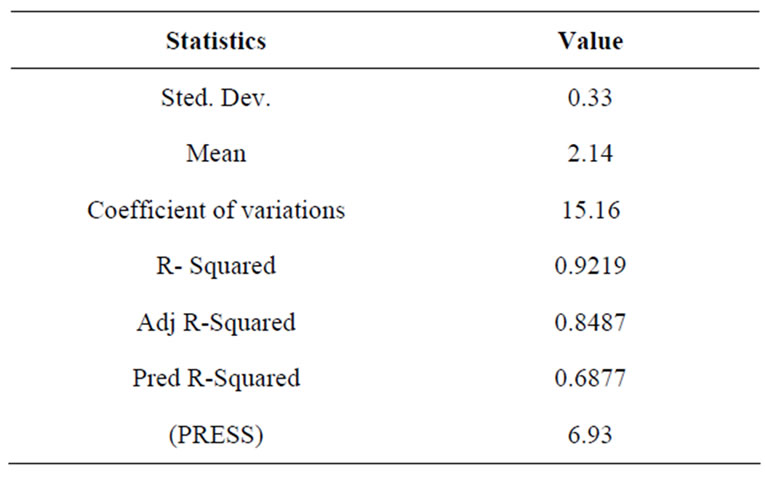
Table 6. Statistics regarding developed model for surface roughness (Ra, µm).
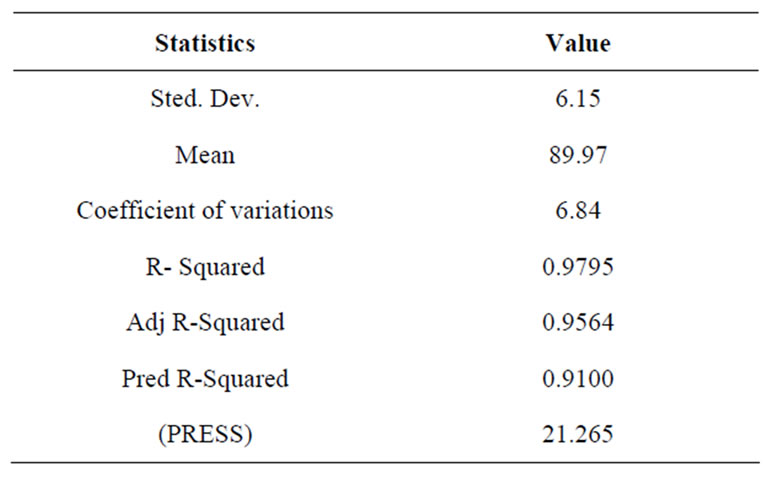
Table 7. Statistics regarding developed model for tangential force (Fc, N).
Depth of cut − 0.12406* Cutting speed* Approach angle − 27050.00000* Feed rate* Depth of cut − 74.27083* Feed rate* Approach angle − 32.27083 * Depth of cut* Approach angle + 435.00000* Cutting speed* Feed rate* Depth of cut + 1.14792* Cutting speed* Feed rate* Approach angle + 0.54792* Cutting speed* Depth of cut* Approach angle + 363.75000* Feed rate* Depth of cut* Approach angle − 5.45833* Cutting speed * Feed rate* Depth of cut* Approach angle.
4.2. Effects of Machining Parameters on the Performance Evaluation
According to the half-normal plot in Figures 2, 3 feed rate (B) contribute the highest effect on the surface roughness and tangential force, followed by depth of cut (C), and cutting speed (A) in that order. This result is confirmed by the basis of the analysis of variance (ANOVA) in Table 4.
After the regression model of surface roughness was developed, the model adequacy checking was performed in order to verify that the underlying assumption of regression analysis is not violated. Figures 4 and 5 illustrates the normal probability plot of the residual for sur-
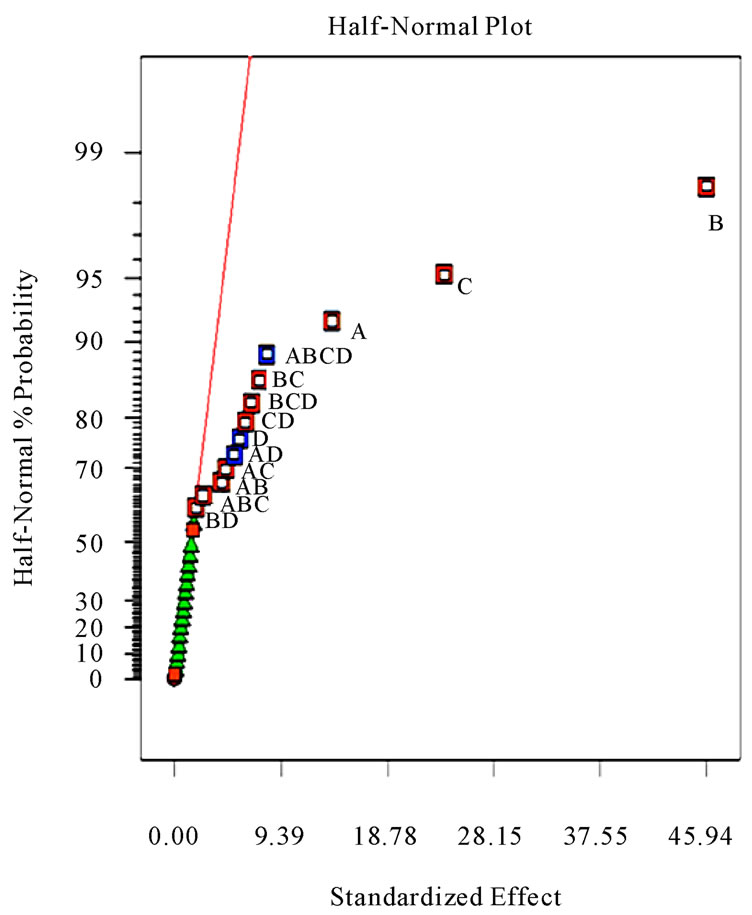
Figure 2. Half-normal plot of effects for Tangential force (Fc, N).
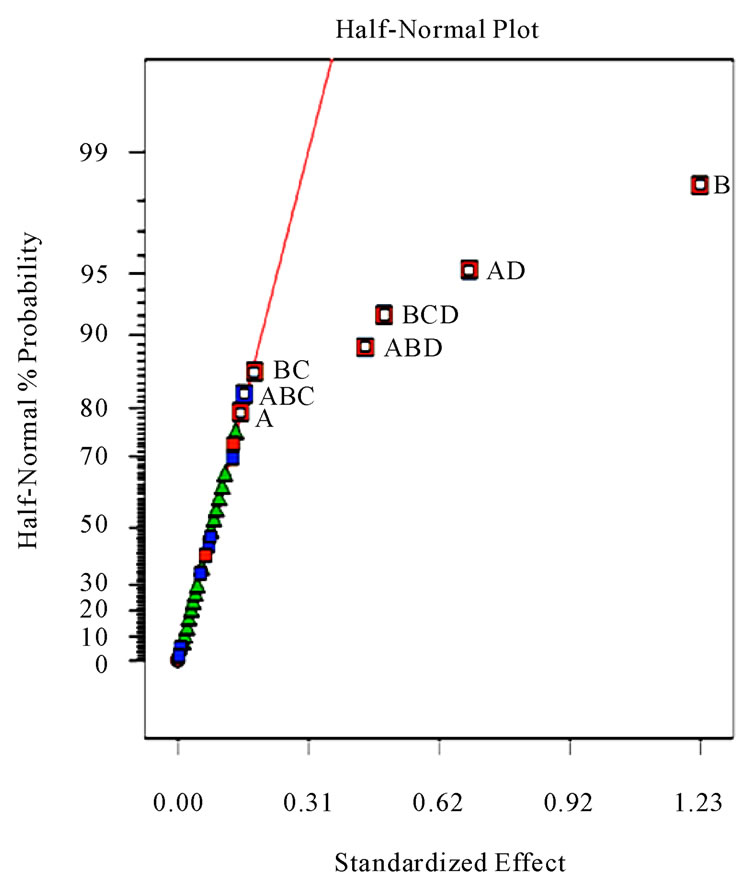
Figure 3. Half-normal plot of effects for Surface roughness (Ra, µm).
face roughness and tangential force which shows no sign of the violation since each point in the plot follows a
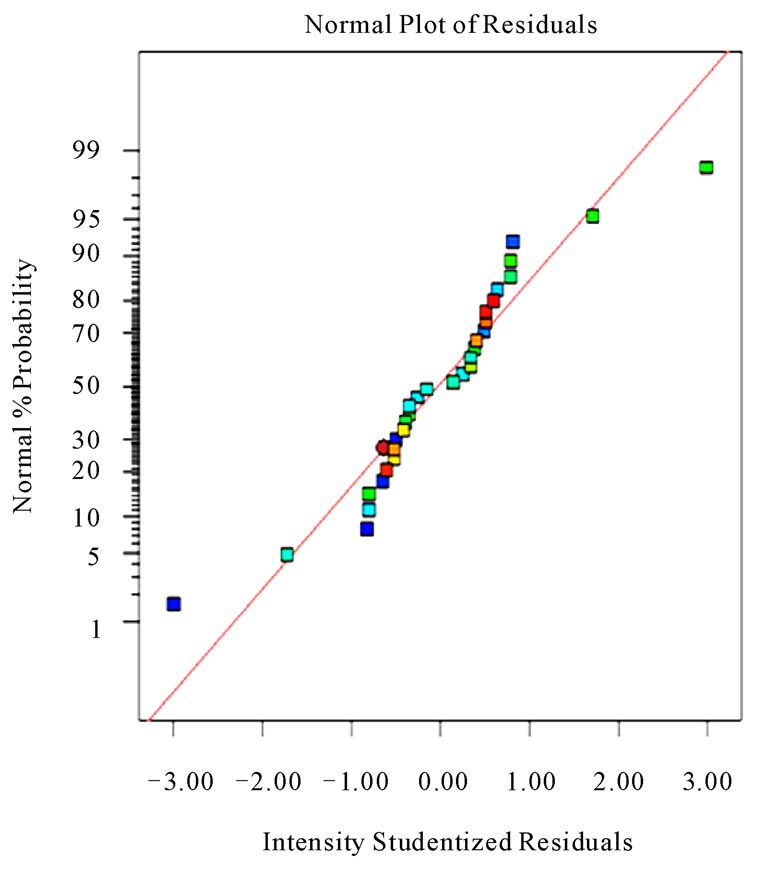
Figure 4. Normal probability plot of residuals for surface roughness (Ra, µm).
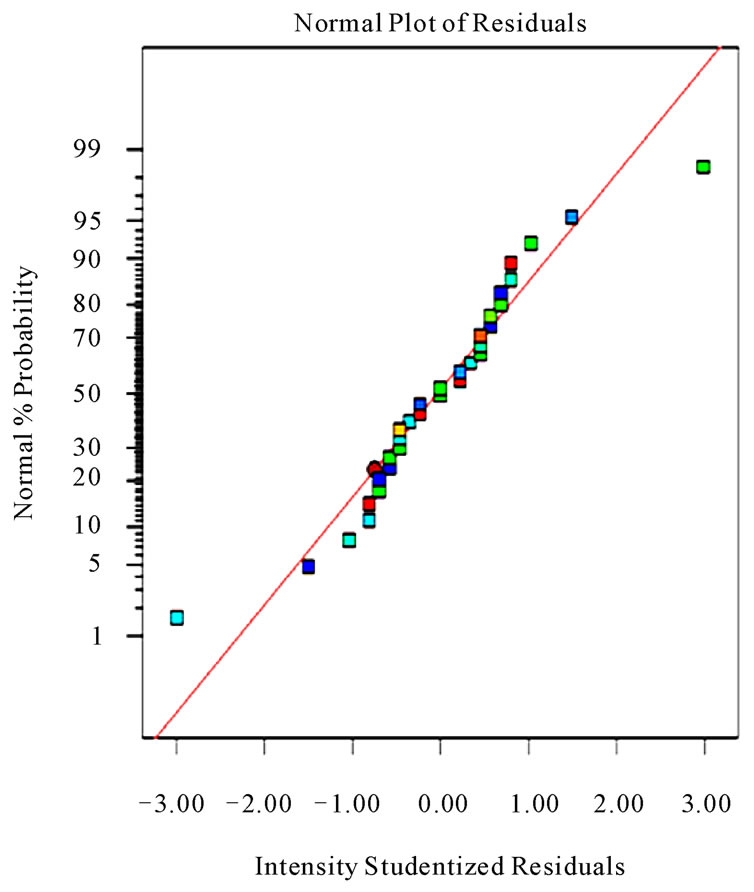
Figure 5. Normal probability plot of residuals for tangential force (Fc, N).
straight line pattern.
The above model obtained can be used to predict the surface roughness (Ra) and tangential force (Fc) within the limits of the factors studied. The differences between measured and predicted responses are illustrated in Figures 6 and 7. The results of comparison were proved to predict values of surface roughness (Ra) and tangential force (Fc) close to those readings recorded experimentally with a 95% confident interval.
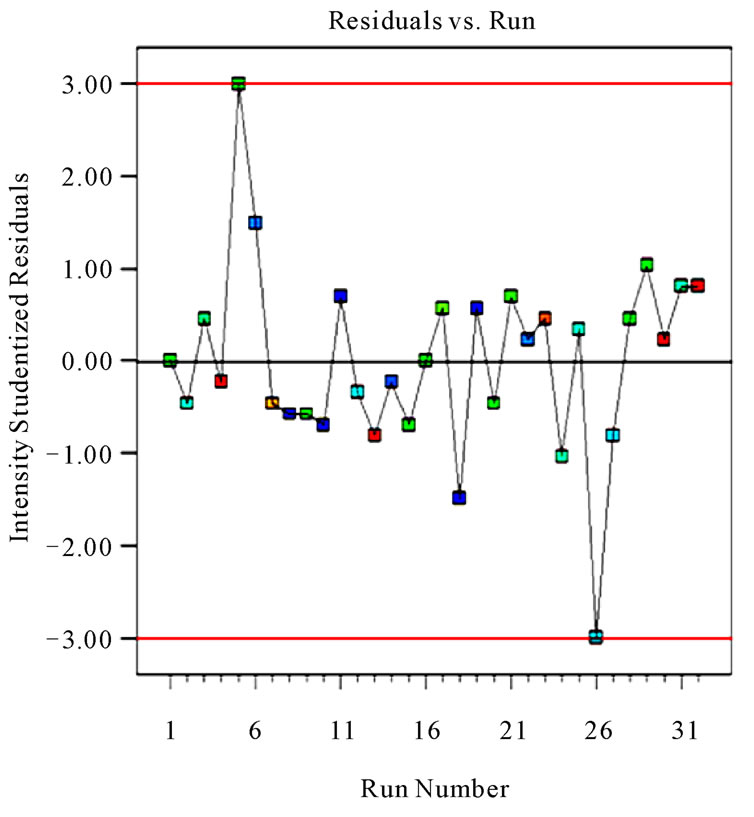
Figure 6. The comparison between measured and predicted value for the surface roughness (Ra, µm).
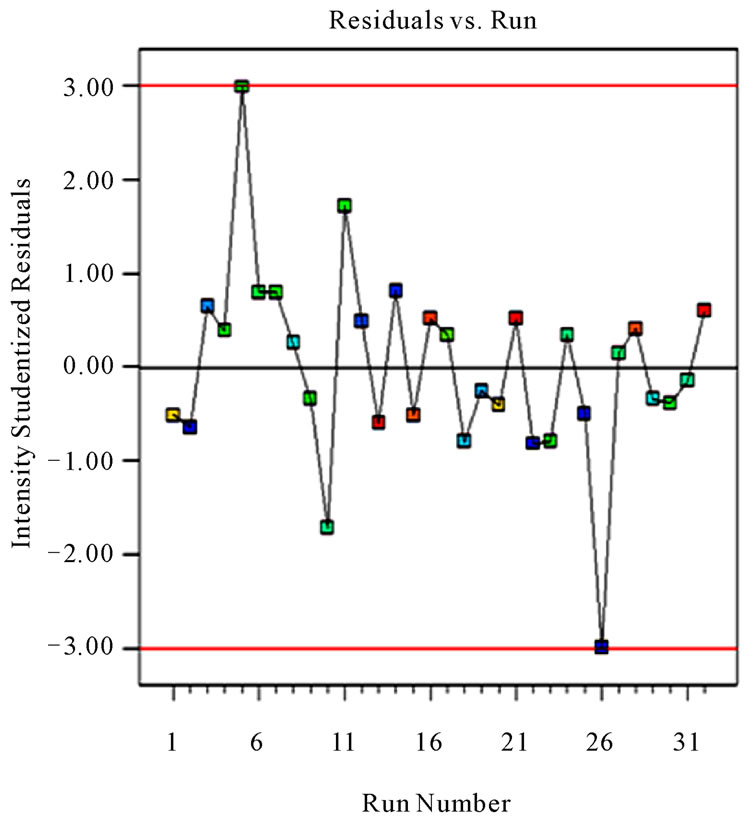
Figure 7. The comparison between measured and predicted value for the tangential force (Fc, N).
Figures 8-13 illustrate the contour plots of the interaction AB, AC and AD for surface roughness (Ra) and tangential force (Fc) respectively. These plots indicate that the surface roughness will be minimized if depth of cut (ap) is set to the high level while the cutting speed (vc) and feed rate (f) are low. Moreover, these results agree with the conclusions from the response plots in Figures 14-19 respectively.
Figures 20 and 21 represent the cube plot which depicts the three-factor interaction among cutting speed (vc), feed rate (f), depth of cut (ap). According to the plot, the surface roughness and the tangential force is significantly
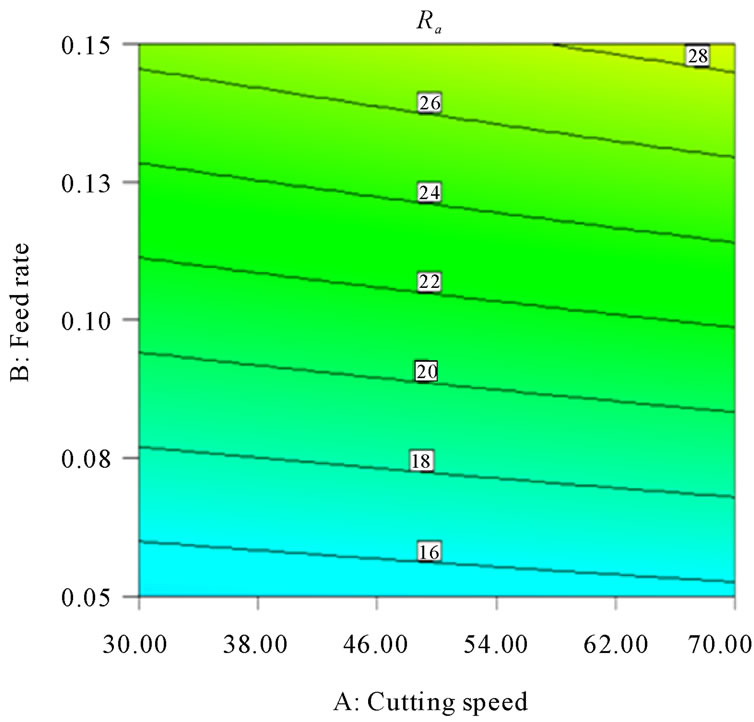
Figure 8. Contour plot of the interaction AB for surface roughness (Ra, µm).
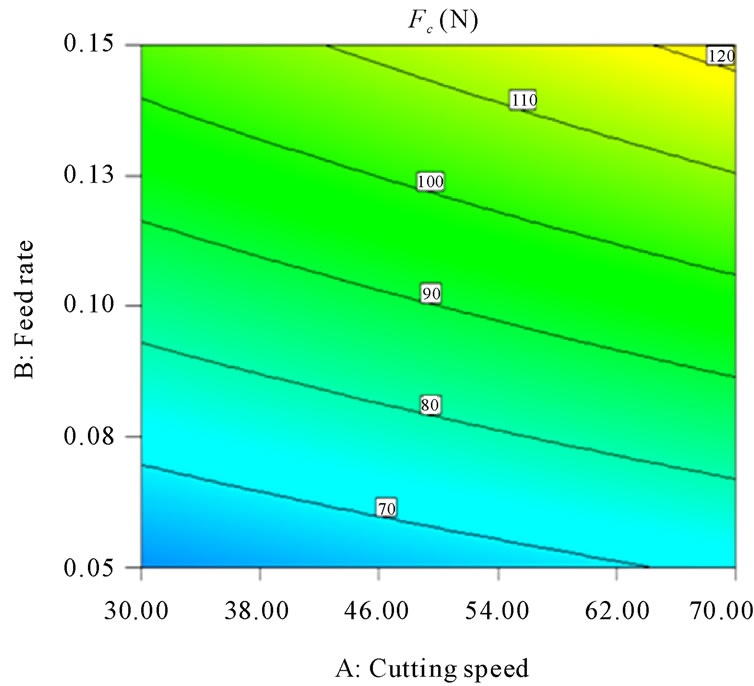
Figure 9. Contour plot of the interaction AB for tangential force (Fc, N).
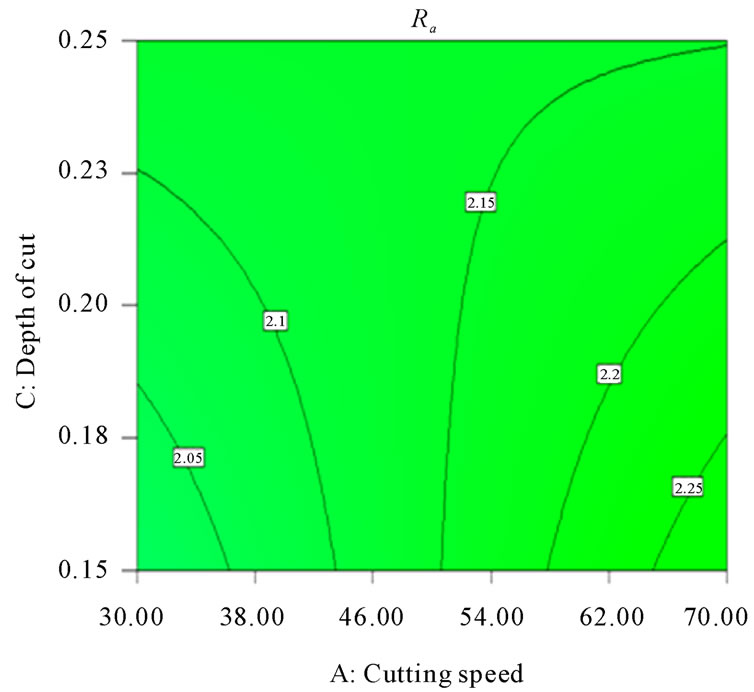
Figure 10. Contour plot of the interaction AC for surface roughness (Ra, µm).
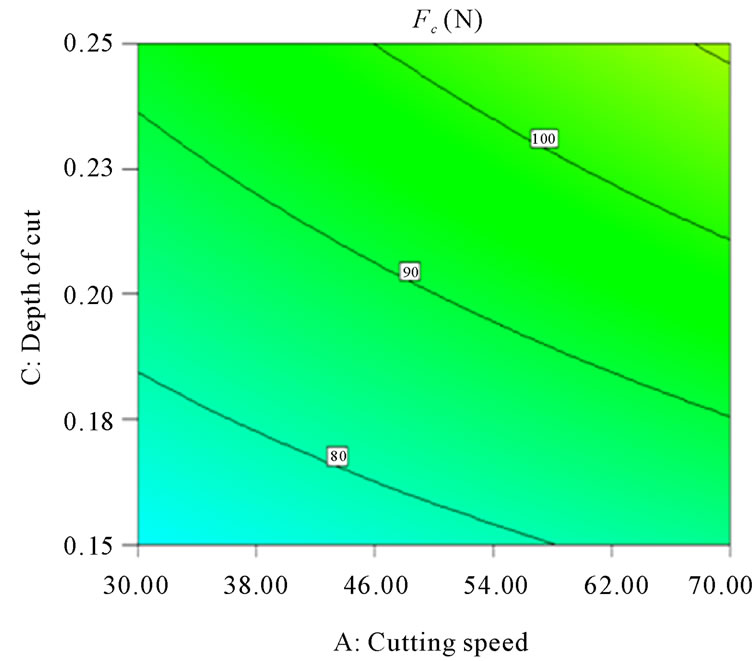
Figure 11. Contour plot of the interaction AC for tangential force (Fc, N).
minimized (Ra = 1.3775 μm, and Fc = 54.5 N) when the depth of cut is set to the high level (0.25 mm) feed rate and cutting speed are low (0.05 mm/rev and 30 m/min respectively).
4.3. Confirmation test
After the regression model and the optimal levels of each machining factor were achieved, the confirmation test was performed in order to validate the minimum surface roughness obtained from the optimization process. For this reason, the titanium (grade-5) alloy was tested by following the optimal conditions: depth of cut = 0.25 mm,
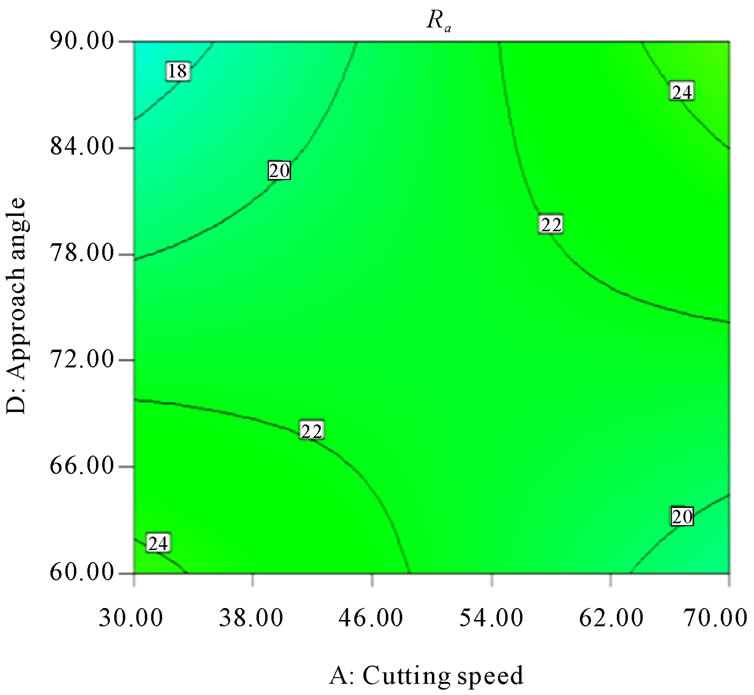
Figure 12. Contour plot of the interaction AD for surface roughness (Ra, µm).
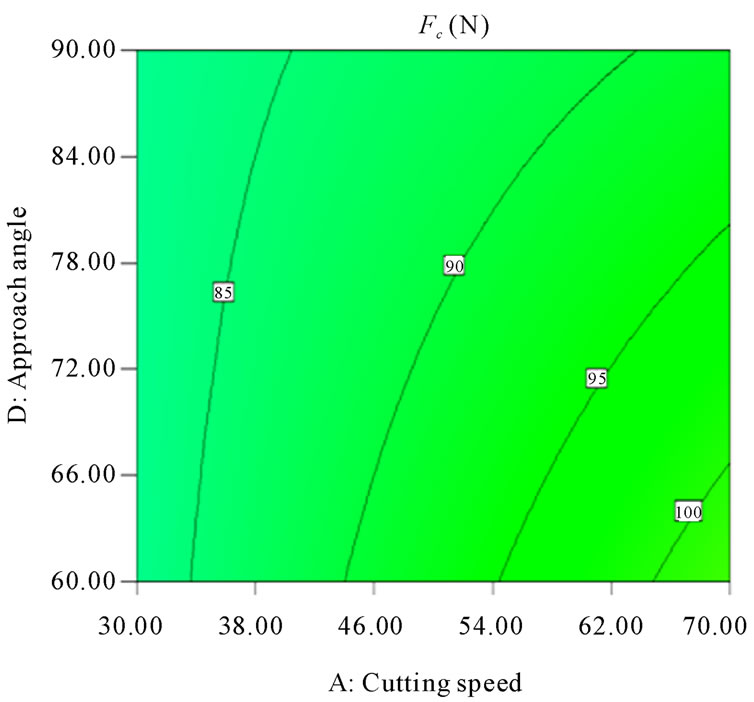
Figure 13. Contour plot of the interaction AD for tangential force (Fc, N).
feed rate = 0.05 mm/rev and cutting speed = 30 m/min. According to the experiment, since the 95% confidence interval of the predicted surface roughness Ra is (1.2894 μm, 1.3775 μm) includes the observed average (Ra = 0.87 μm), and predicted tangential force Fc is (53.3 N, 54.5 N) includes the observed average (Fc = 48 N) there is no much significant difference between these two values as shown in Tables 8 and 9.
5. Conclusions
The purpose of this research is to quantify the effect of
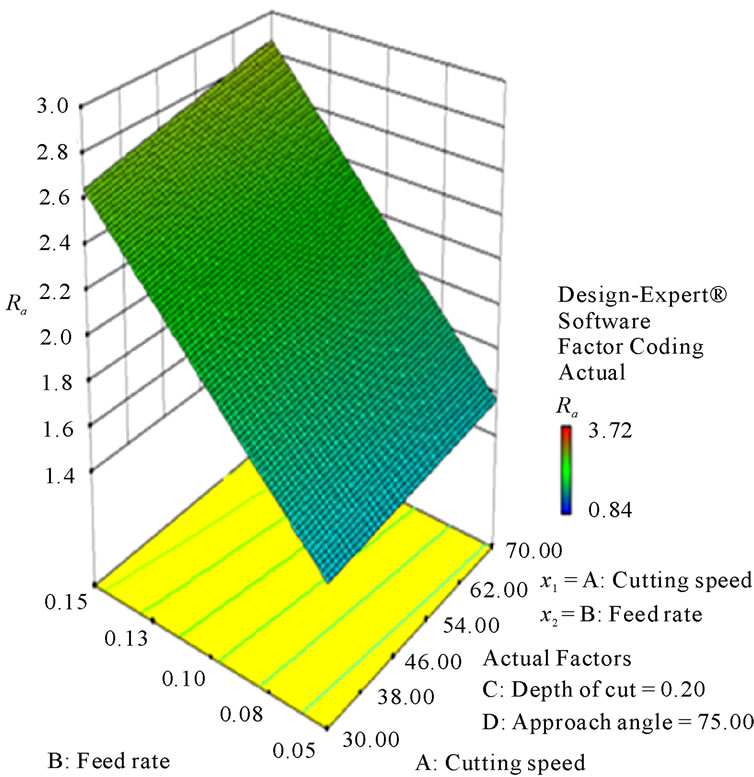
Figure 14. Response plot of the interaction AB for surface roughness (Ra, µm).
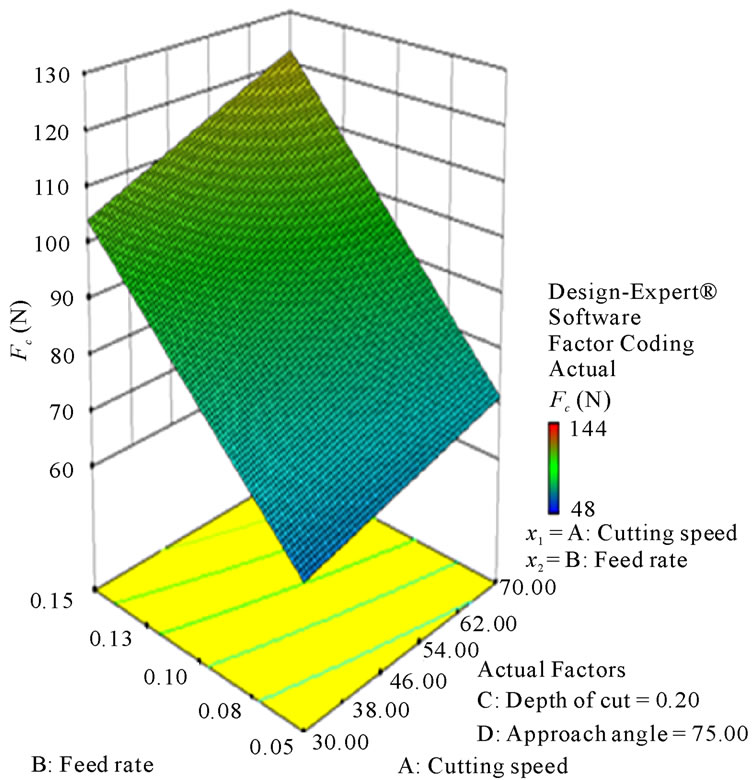
Figure 15. Response plot of the interaction AB for tangential force (Fc, N).
cutting speed, feed rate, depth of cut and approach angle on surface roughness and tangential force of titanium (Grade-5) alloy. The factorial design was utilized to obtain the best cutting condition which leads to the minimization of the surface roughness and tangential force. The half normal plot and ANOVA indicate that the (B) feed rate (f) is the most significant factor followed by (C) depth of cut (ap) and (A) cutting speed (vc). Also it is
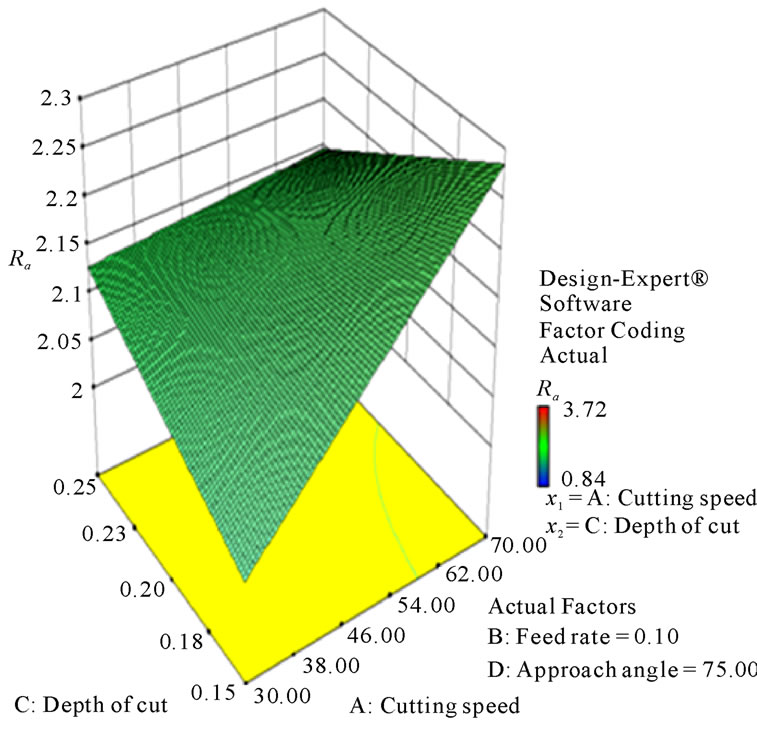
Figure 16. Response plot of the interaction AC for surface roughness (Ra, µm).
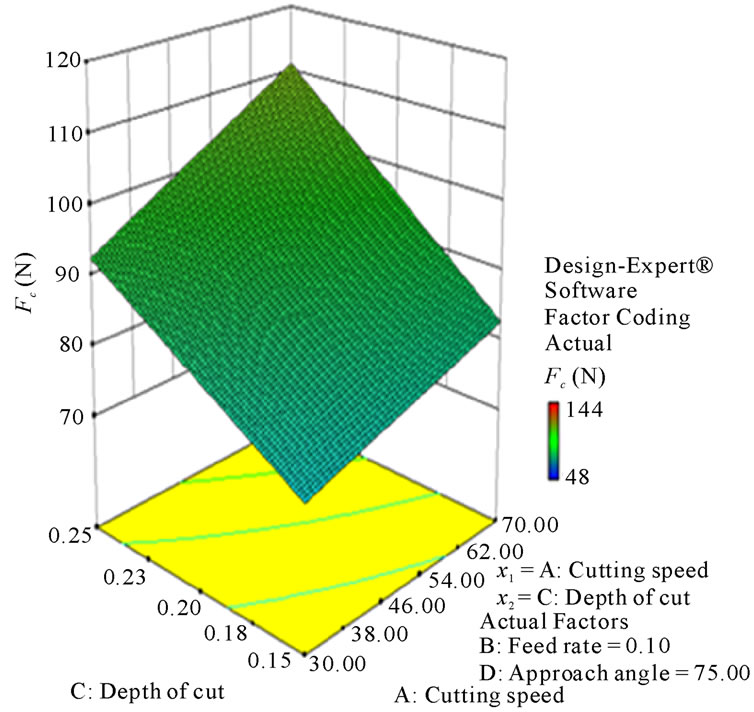
Figure 17. Response plot of the interaction AC for tangential force (Fc, N).
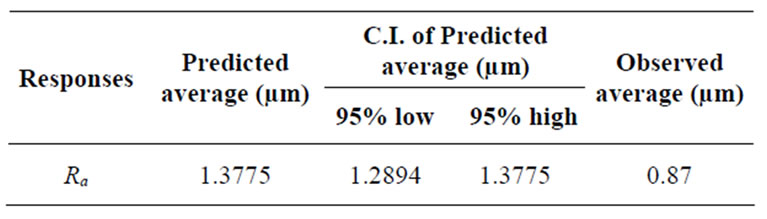
Table 8. Results of the confirmation test for surface roughness (Ra, µm).
observed that the approach angle (aa) has very little affect on the surface roughness. Moreover, it is interesting to note that there are interactions among these three fac-
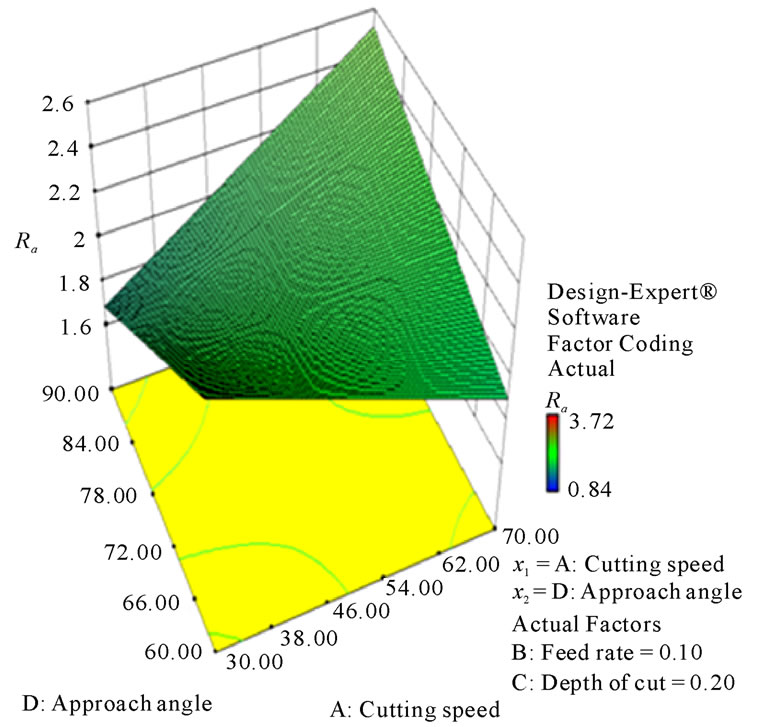
Figure 18. Response plot of the interaction AD for surface roughness (Ra, µm).
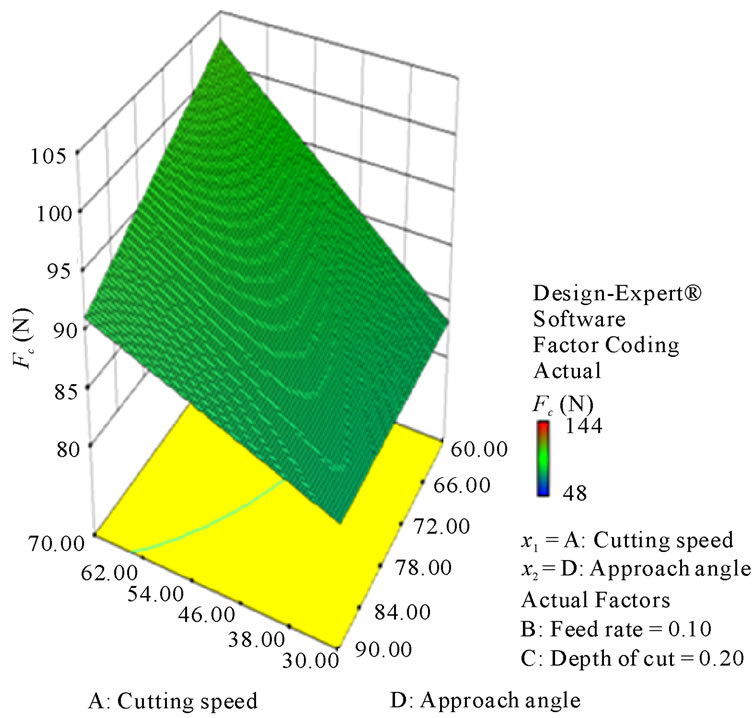
Figure 19. Response plot of the interaction AD for tangential force (Fc, N).
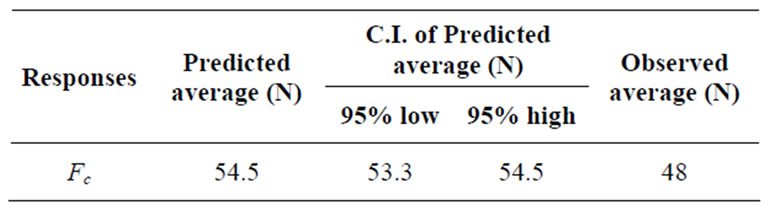
Table 9. Results of the confirmation test for tangential force (Fc, N).
tors with the highest order term, ABC. Regarding the model validation, the regression model developed proves to be accuracy and has the capability to predict the value
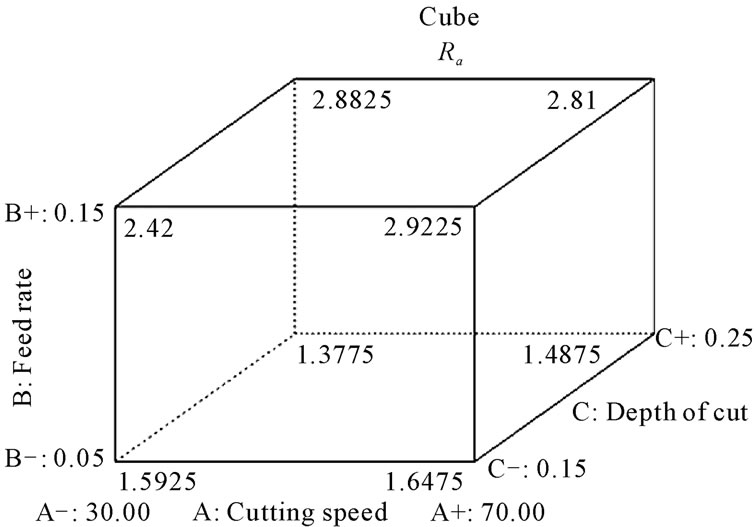
Figure 20. Cube plot of the interaction ABC for surface roughness (Ra, µm).
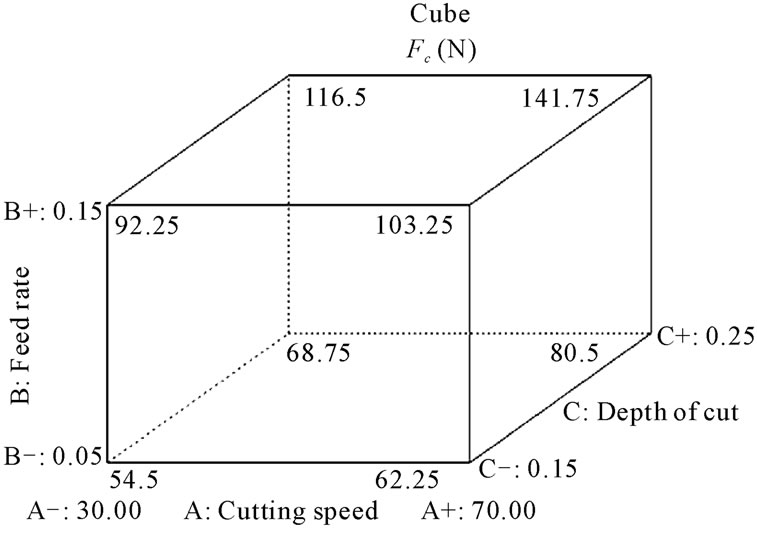
Figure 21. Cube plot of the interaction ABC for tangential force (Fc, N).
of response within the limits of factors investigated. After the optimal cutting condition is implemented, the surface roughness is significantly reduced about 13 percent.
6. REFERENCES
- H. Van Kann, “Titanium and Titanium Alloys,” Plenum Press, New York, 1982, pp. 229-234.
- J. R. Myers, H. B. Bomberger and F. H. Froes, “Corrosion Behavior and Use of Titanium and Its Alloys,” Journal of Metals, Vol. 36, No. 10, 1984, pp. 50-60.
- J. B. Borradile and R. H. Jeal, “Titanium and Titanium,” Alloys, No. 3, 1982.
- R. A. Wood and R. J. Favor, “Titanium Alloys Handbook,” Air Force Materials Laboratory, Wright-Patterson Air Force Base, OH, 1972.
- C. H. Che-Haron and A. Jawaid, “The Effect of Machining on Surface Integrity of Titanium Alloy Ti-6% Al-4% V.,” Journal of Materials Processing Technology, Vol. 166, No. 2, 2005, pp. 188-192.
- D. Umbrello, “Finite Element Simulation of Conventional and High Speed Machining of Ti6Al4V Alloy,” Journal of Materials Processing Technology, Vol. 196, No. 1-3, January 2008, pp. 79-87.
- M. Y. Noordin, V. C. Venkatesh, S. Elting and A. Abdullah, “Application of Response Surface Methodology in Describing the Performance of Coated Carbide Tools When Turning AISI 1045 Steel,” Journal of Material Processing Technology, Vol. 145, No. 1, 2004, pp. 46-58. doi:10.1016/S0924-0136(03)00861-6
- S. J. Heo, “Machining Characteristics of Cemented Carbides in Micro Cutting with in SEM,” International Journal of Precision Engineering and Manufacturing, Vol. 5, No. 3, 2004, pp. 35-42.
- E. M. Trent and P. K. Wright, “Metal Cutting,” Butterworth-Heinemann, 2000, pp. 9-95.
- W. H. Yang and Y. S. Tarng, “Design Optimization of Cutting Parameters for Turning Operations Based on the Taguchi Method,” Journal of Material Processing Technology, Vol. 84, No. 1-3, December 1998, pp. 122-129. doi:10.1016/S0924-0136(98)00079-X
- J. P. Davim, “A Note on the Determination of Optimal Cutting Conditions on the Surface Finish Obtained in Turning Using,” Journal of Material Processing Technology, Vol. 116, No. 2-3, October 2001, pp. 305-308.
- D. C. Montgomery, “Design and Analysis of Experiments,” 4th Edition, Wiley, New York, 1997.
- K. Kandananond, “The Determination of Empirical Model for Surface Roughness in Turning Process Using Design of Experiment,” WSEAS Transactions on Systems, Vol. 8, No. 10, October 2009, pp. 1135-1144.
- M. C. Shaw, “Metal Cutting Principles,” Oxford University, Oxford, 1984.
- M. Thomas, Y. Beauchamp, Y. A. Youssef, J. Masounave, “An Experimental Design for Surface Roughness and Built-up Edge Formation in Lathe Dry Turning,” International Journal of Quality Science, Vol. 2, No. 3, 1997, pp. 167-180. doi:10.1108/13598539710170803
- X. Wang and C. X. Feng, “Development of Empirical Models for Surface Roughness Prediction in Finish Turning,” International Journal of Advanced Manufacturing Technology, Vol. 20, No. 5, 2002, pp. 348-356. doi:10.1007/s001700200162
- I. A. Choudhury and M. A. El-Baradie, “Surface Roughness Prediction in the Turning of High-Strength Steel by Factorial Design of Experiments,” Journal of Materials Processing Technology, Vol. 67, No. 1-3, May 1997, pp. 55-61. doi:10.1016/S0924-0136(96)02818-X
- I. P. Arbizu and C. J. Luis Perez, “Surface Roughness Prediction by Factorial Design of Experiments in Turning Processes,” Journal of Materials Processing Technology, Vol. 143-144, December 2003, pp. 390-396. doi:10.1016/S0924-0136(03)00407-2
- T. Ozel, T. K. Hsu and E. Zeren, “Effects of Cutting Edge Geometry, Work Piece Hardness, Feed Rate and Cutting Speed on Surface Roughness and Forces in Finish Turning of Hardened AISI H13 Steel,” International Journal of Advanced Manufacturing Technology, Vol. 25, No. 3-4, 2005, pp. 262-269. doi:10.1007/s00170-003-1878-5
- Y. Sahin and A. R. Motorcu, “Surface Roughness Model for Machining Mild Steel with Coated Carbide Tool,” Materials & Design, Vol. 26, No. 4, June 2005, pp. 321- 326. doi:10.1016/j.matdes.2004.06.015
- Y. Sun, Y. Liang and R. Du, “Micro Milling: Simulation of Surface Generation and Experimental Analysis of Surface Roughness,” WSEAS Transactions on Systems, Vol. 5, No. 6, 2006, pp. 1293-1300.
- H. Oktem, T. Erzurmlu and H. Kurtaran, “Application of Response Surface Methodology in the Optimization of Cutting Conditions for Surface Roughness,” Journal of Materials Processing Technology, Vol. 170, No. 1-2, December 2005, pp. 11-16. doi:10.1016/j.jmatprotec.2005.04.096
- J. Grum and J. M. Slab, “The Use of Factorial Design and Response Surface Methodology for Fast Determination of Optimal Heat Treatment Conditions of Different Ni-CoMo Surface Layers,” Journal of Materials Processing Technology, Vol. 155-156, November 2004, pp. 2026- 2032. doi:10.1016/j.jmatprotec.2004.04.220
- K. Y. Kung, C. H. Hsu, P. C. Chen and J. R. Lin, “Effects of Surface Roughness on Dynamic Squeeze Behavior of Partial Journal Bearings with Finite Width,” WSEAS Transactions on Mathematics, Vol. 3, No. 1, 2004, pp. 204-209.
- J. P. Davim, “Design of Optimization of Cutting Parameters for Turning Metal Matrix Composites Based on the Orthogonal Arrays,” Journal of Materials Processing Technology, Vol. 132, No. 1-3, January 2003, pp. 340- 344. doi:10.1016/S0924-0136(02)00946-9