Engineering
Vol. 3 No. 3 (2011) , Article ID: 4147 , 4 pages DOI:10.4236/eng.2011.33030
Statistical Control and Investigation of Capability of Process and Machine in Wire Cut EDM Process of Gas Turbine Blade Airfoil Tip
1Mapna Group (Mavadkaran Engineering Co.), Tehran, Iran
2Mechanical Engineering Department of Tafresh University, Tafresh, Iran
E-mail: fazeli@ mavadkaran.com, ebrahimsharifi@voila.fr
Received November 17, 2010; revised January 10, 2011; accepted February 9, 2011
Keywords: Statistical Process Control, WEDM, Capability of Process and Machine
ABSTRACT
Statistical process control (spc), as one of the quality devices, can help manufacturers improve the quality of their products in today’s competitive world. This research examines the statistical method of wire-cut electric discharge machining (WEDM) process of the turbine blade airfoil tip for control and consistency of the process. For this purpose, the standard deviation control chart, S, and the average data,  , which are applied for identifying the acquired factors, have been used. Next, regarding the plan features, the manufacturing process is assessed to determine whether the products meet quality and the customer requirements or not. Therefore, the coefficients Cpk is applied which indicate the capability of the manufacturing process. Then, in order to produce high quality blades within the tolerance range, the capability of WEDM machine is examined, using coefficients CM. Finally, it is shown that in order to produce the desired product, the process can be controlled and fixed by using the statistical process control devices and inspecting the standard deviation of data and investigation of capability of process and machine.
1. Introduction
SPC is a commonly used control method of manufacturing processes which is effective in controlling the fluctuations of the manufacturing process. Thus, in contrast to the methods of product test and inspection, the product is well produced from the start if this method of process control is used. Statistical Process Control (SPC) techniques, when applied to measurement data, can be used to highlight areas that would benefit from further investigation. These techniques enable the user to identify variation within their process. Understanding this variation is the first step towards quality improvement. SPC techniques are tools for highlighting this unusual behavior. Many businesses now use univariate statistical process control (USPC) [1] in both their manufacturing and service operations. Automated data collection, low-cost computation, products and processes designed to facilitate measurement, and demands for higher quality, lower cost, and increased reliability have accelerated the use of USPC.
A large variety of Statistical Process Control (SPC) schemes have been developed for quality and productivity improvement since the 1960s. SPC utilizes statistical methods to monitor manufacturing processes with an aim to maintain and improve the product quality while decreasing the variance. Much research has been conducted on the issues of SPC and the resulting developments are readily available in the literature, see surveys of research on SPC by Lowry and Montgomery [2], Woodall and Montgomery [3] and Stoumbos et al. [4].
Statistical Process Control charts are tools to assist in the decisions about what needs to be improved, the possible methods to improve it, and the steps to take after getting results from the charts are all made by humans and based on wisdom and experience. In particular, the control chart has helped determine whether special-cause variation is present, implying that action needs to be taken to either eliminate that cause if it has a detrimental effect on the process, or to make it standard operating procedure if that cause has a beneficial effect on the process. If no special-cause variation is found to be present, SPC helps define the capability of the stable process to judge whether it is operating at an acceptable level. [5-7]
This research examines the statistical method of WEDM process of the gas turbine blade airfoil tip for control and consistency of the process. For this purpose, the standard deviation control chart, s, and the average data,  , which are applied for identifying the acquired factors, have been used. Next, regarding the plan features, the manufacturing process is utilized to determine whether the products meet quality and the customer requirements or not. Therefore, the coefficients Cp is applied which indicate the capability of the manufacturing process.
Finally, it is shown that in order to produce the desired product, the process can be controlled and fixed by using the statistical process control devices and inspecting the standard deviation of data and investigation of capability of process and machine.
Airfoil tip dimension is one of the important geometrical dimensions in airfoil of gas turbine blade that has a significant effect in correct assembly of blade on the turbine. If this important dimension isn’t controlled correctly and is not within the tolerance range (within 0.2 mm), the blade cannot be assembled on the turbine. In this research we investigate statistical process control of airfoil tip dimension (Figure 1). Figure 2 illustrates the WEDM fixture.
2. The Samples of Control for Variable Characteristics
Basically, the samples of control are applied to identify the acquired factors, and the acquired changes affect the average, standard deviation, or both. The average process is usually controlled by using  or average control chart. The process variability or standard deviation can also be controlled by a controlling chart for standard deviation or the chart S.
3. The Identification Method of Out of Control Conditions in Charts ( , S)
, S)
Some sensitizing laws, called electric western laws, are applied to intensify the control damp in identifying the charge in average and their uncontrollability. These laws are based on the normal distribution and whenever the process takes away from the normal status, these laws, warn that the status is out of control in the given point. The out of control process for the standard deviation diagram in four conditions are as follows:
1) An out of control spot ICL, UCL;
2) Nine consecutive spots in one side of the control line;
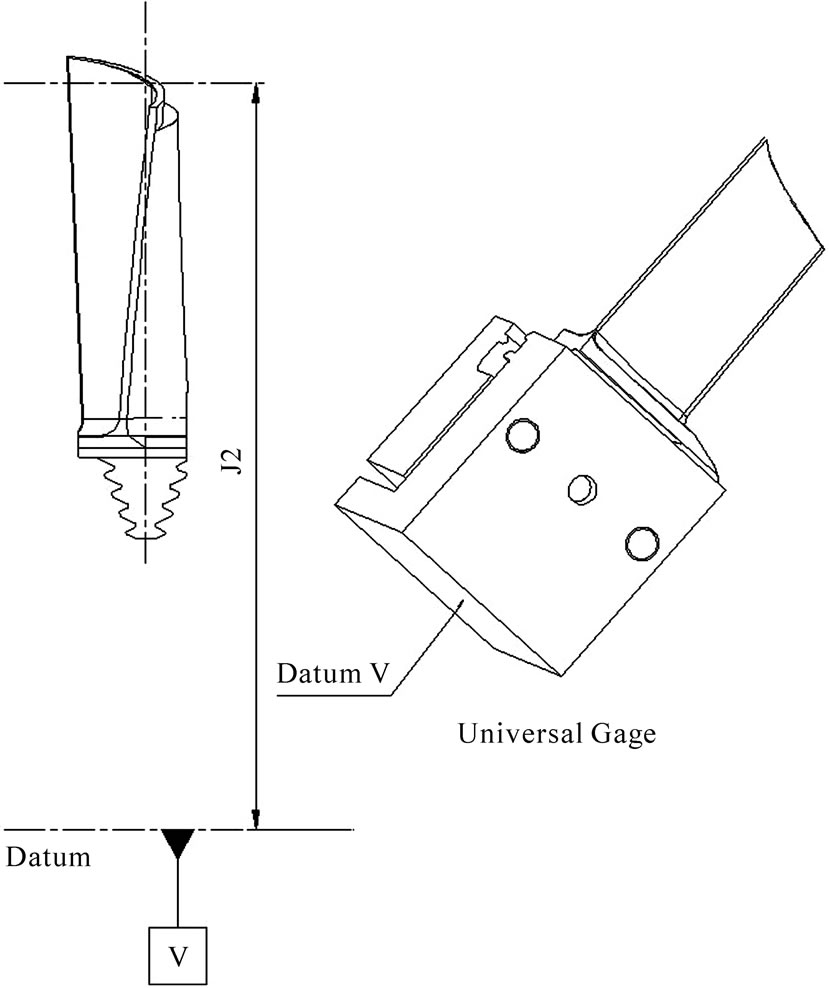
Figure 1. Airfoil tip dimension.
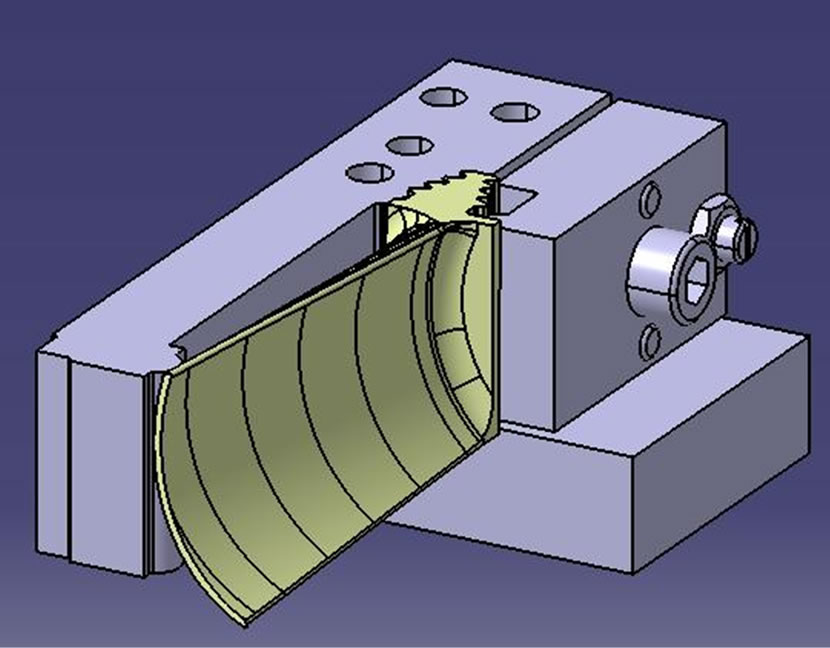
Figure 2. Airfoil tip WEDM fixture.
3) Six consecutive spots in ascending or descending;
4) Fourteen consecutive spots alternatively upward and downward;
4. The Control Diagram ( , S)
, S)
The estimation of “S” is always more accurate for variability, but in practice, due to simplicity of calculation, the estimation of domain is used for variability. If the size of the sample n is relatively small (about 5), the estimation resulted from the range method for variability, is an appropriate estimation, and is not very different from S, but the bigger the size of n the less the efficiency of the range (domain) estimation. Due to ignoring the data between the Xmin and Xmax, the range method completely loses its efficiency for the samples with sizes of 10 or more, and the diagram S needs to be used for stimulating the variability.
5. Statistical Principles of the Sample  by Using the Stimulation of S
If the standard deviation of a population is σ, then S is the stimulation of that population standard deviation and equals to:
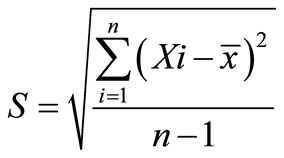 (1)
(1)
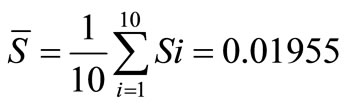
Now if there are m of n samples and the standard deviation of sample i, is shown with Si, then the average standard deviation of the m samples will equal:
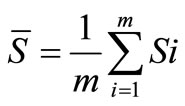 (2)
(2)
Where the given quantitative feature includes relative normal distribution, therefore, we have:
 (3)
(3)
A3 values can be deduced with respect to the sizes of samples which are different from the statistical tables.
6. The Statistical Principles of the Control Diagram S
The central line of the diagram S equals  which was calculated before, In order to compute the control limits of this diagram, it is necessary to have a correct estimation of the S standard deviation.
The control limits of the diagram S is computed as follow:
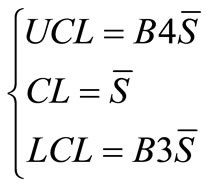 (4)
(4)
B3, B4 values can be deduced with respect to the sizes of samples which are different from the statistical tables.
 and
and  values for our WEDM process are calculated as follow:
Consequently the control limit of the diagram S equals:
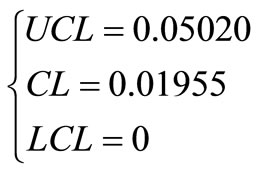
Si values are shown on the Figure 3 in order to explore the controllability of the process variability.
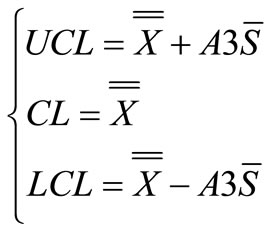
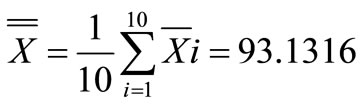
The diagram S never shows beyond the control status or a non-random process, thus, it is possible to examine if the average process is under control. In the next phasethe control limits of the diagram  for our WEDM process are computed as follows:
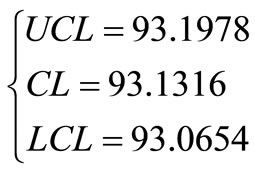
 values in the diagram is down like the Figure 4.
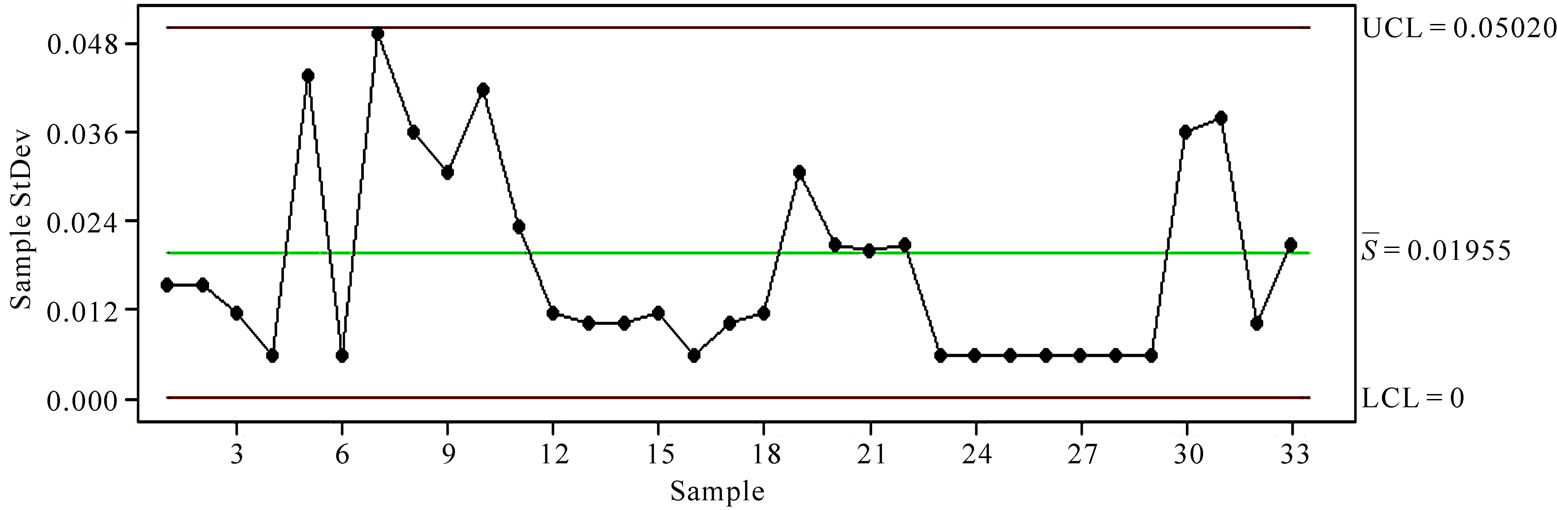
Figure 3. The diagram S for controlling the process variability.
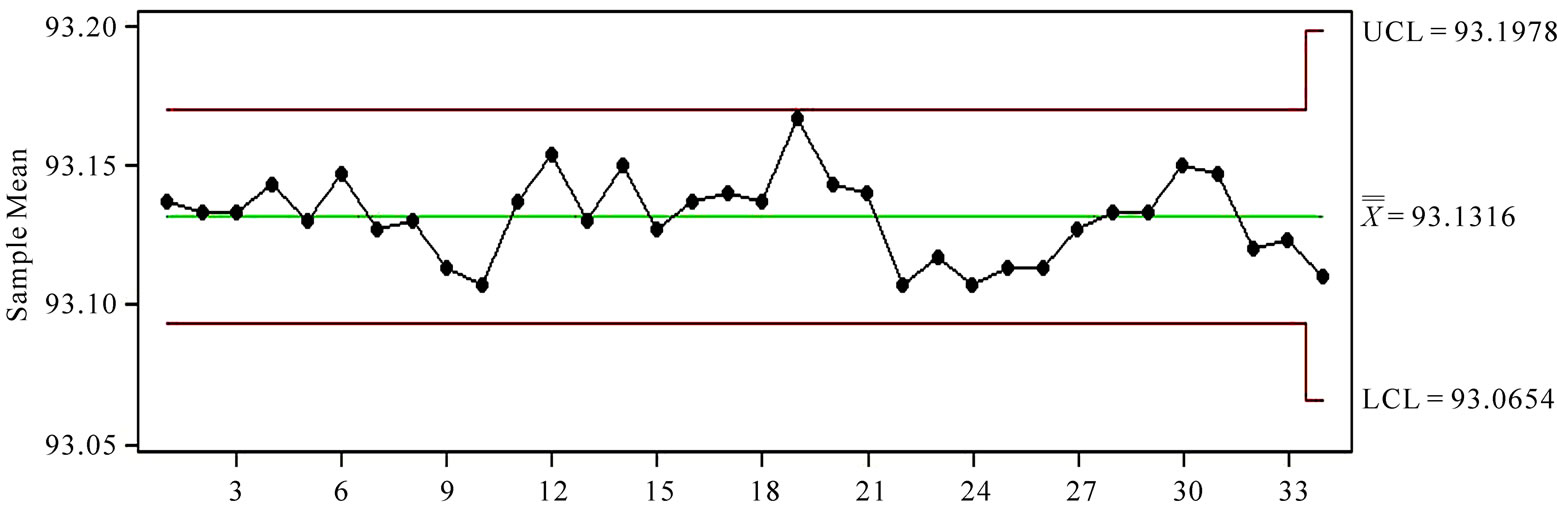
Figure 4. The average diagram for controlling the average process, through the stimulation of S for the standard deviation.
Similarity,  diagram clearly emphasizes that the average process in under the control. Therefore, to control the products, the calculated limits for the diagram S,
  can easily be computed.
7. The Capability of the Process
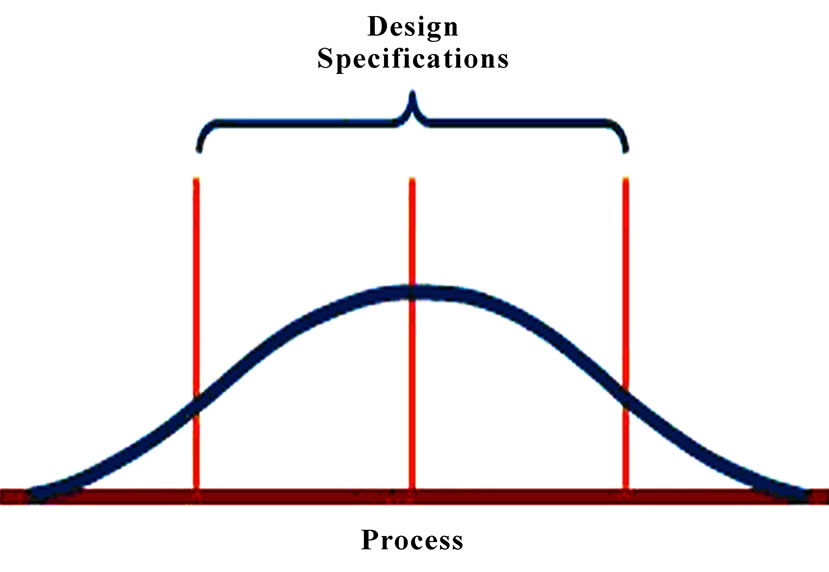
Hitherto, we have studied the manufacturing process independently from limits of project characteristics. This deficiency is well illustrated in Figure 5. All processes are under control, but only the production of the process (b) is accepted by the customer. Therefore, the limits of the manufacturing process need to be compared to the limits of project characteristics. Process capability indices are discussed in this section.
CPK Index Factor CPK consider dispersal of the production process and the location of process in regard to the tolerance limits. The factor CPK illustrated as follow:
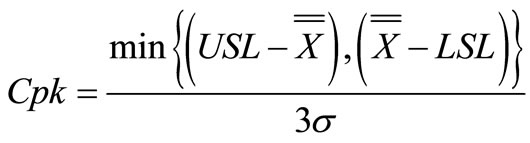 (5)
(5)
σ is the standard deviation in the above relation.
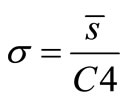 (6)
(6)
C4 values can be deduced with respect to the sizes of samples which are different from the statistical tables.
Then the CPK index for our WEDM process is calculated as follows:

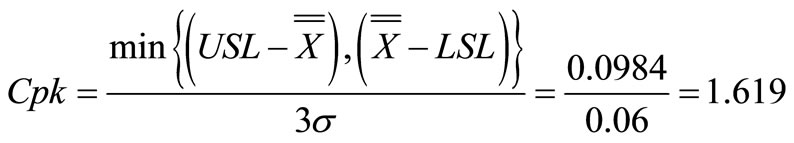
Considering the definition of CPK, the following results are achieved:
1) CPK < 1: The process is not capable of producing the part in the desired range of the customer, and the process will certainly lead to a defective product.
2) CPK = 1: The process is capable of producing the piece within the desired range of the customer with a possibility of producing a defective piece.
3) CPK > 1: The process can produce the piece within the desired range of the customer.
Of course, the WEDM machine is studied through the statistical process control before the tests are carried out to stabilize the reproducibility and assurance of the machine’s performance.
8. The Index of the Machine Capability of CM
If we want to determine a machine’s capability in producing a high-quality part, and for example want to purchase a machine, or receive a mould, or be informed of the machine status after the basic repairs, we can use the index capability of CM [7].
8.1. The Method of Control Diagram
There are many factors, including environment, consumables, materials, production time, operator, etc, that affect the primary process.
In order to identify the capability of the machine, conditions governing the process need take the best position to have the least effect on the amount of the process capability changes.
In such a situation, the amount of the process capability is that very machine capability. Thus, we operate as follows:
1) We prepare the best environmental conditions for the machine.
2) In order to collect data, we provide a stable condition.
 (a)
(a)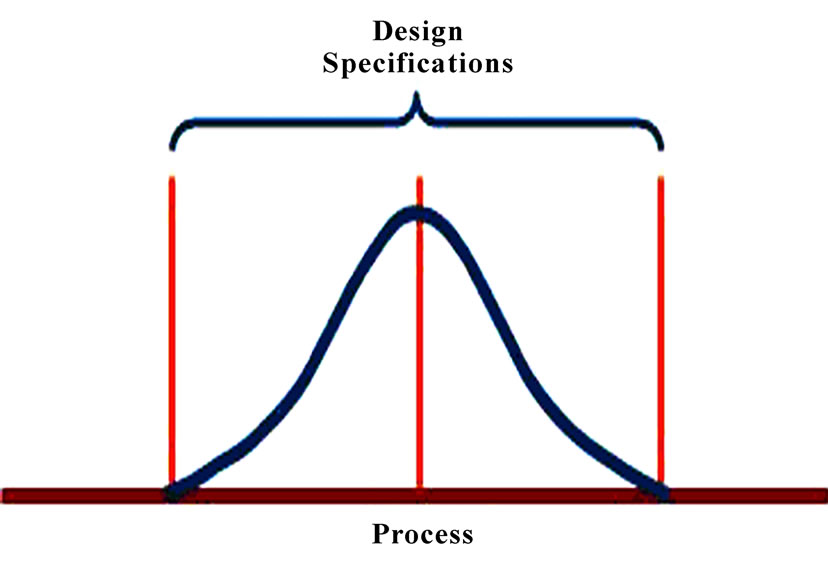 (b)
(b)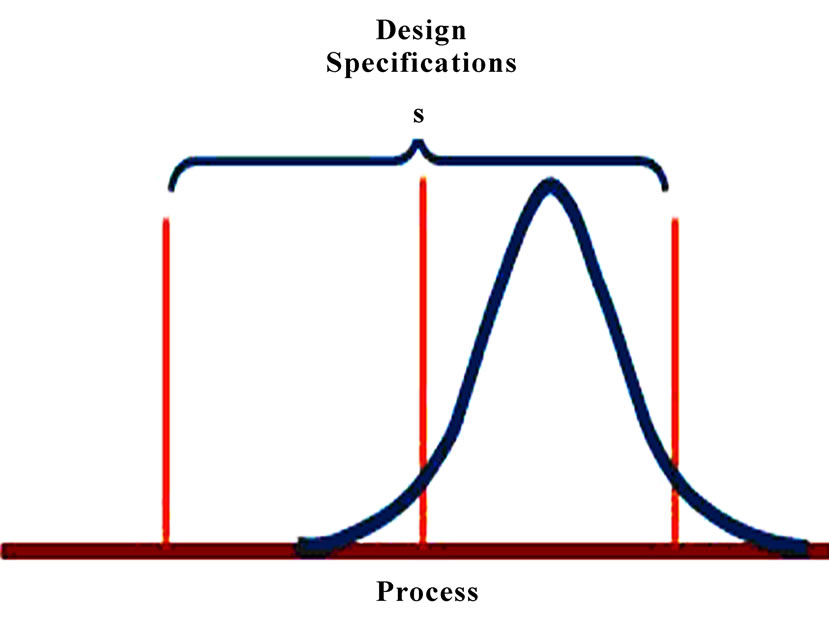 (c)
(c)
Figure 5. The comparison of the production process limits with the project characteristics limits. (a) Natural variation exceeds design specifications; process is not capable of meeting specifications all the time; (b) Design specifications and natural variation are the same; process is capable of meeting specifications most of the time; (c) Specifications are greater than natural variation, but the process is off center; capable but some output will not meet upper specification.
3) We produce 125 samples one after another, and record the size of all pieces along with their production time.
4) We draw the control diagram based on the size of the subgroup (usually n = 3-5).
If the diagram is under the control, we compute the index of the machine capability exactly like the formulas Cpk. A higher capability is expected since we have eliminated all changes accept the machine internal changes.
8.2. S Test Method
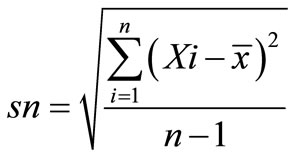
This test is used if, for any reason, we cannot have a large number of parts or if the production of parts is expensive or time consuming. For this purpose, after the machine (system) reached the steady state, the eight first-produced pieces are used to calculate S as follows:
 (7)
(7)
 (8)
(8)
The confidence levels are 90%, 95%, and 99% which are presented in the Table 1. Choosing the confidence level depends on the amount of the analyst strictness. It is evident that the higher the confidence chosen, the greater the strictness of the analyst.
If S < LCVn, then the system meets our expectations.
If S > UCVn, then the system cannot meet our expectations.
If LCVn < S < UCVn, the above method is repeated by adding two more samples.
Continue this until 30 samples are gathered. If the desired result is not obtained, the 30 samples are divided into 10 triplex samples, and the machine (system) capability is calculated using the above-mentioned formula.
In order to examine the questioned process, i.e. WEDM process of the moving gas turbine blade airfoil tip, one of
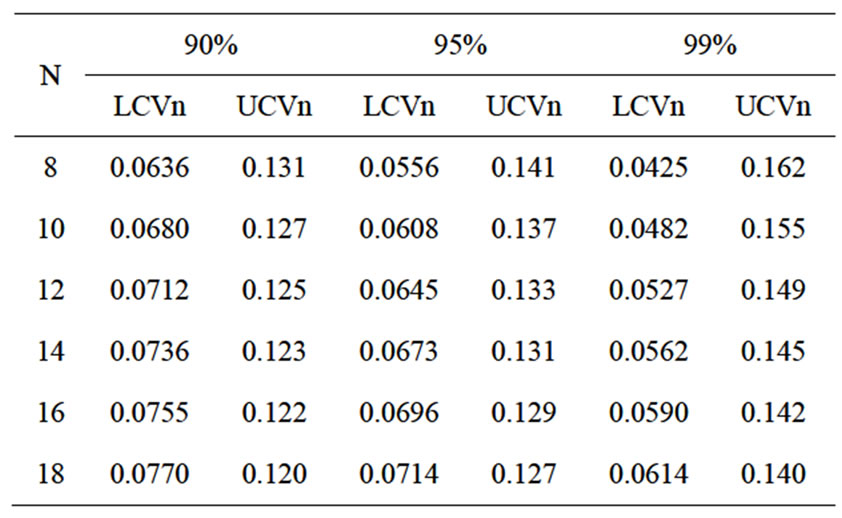
Table 1. The value of S test for CM ≥ 1.67.
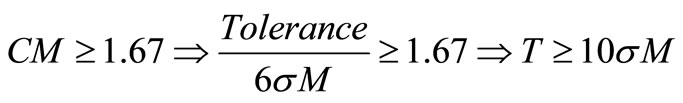
the important parameters is used, which has a significant effect on the system corrosion. For this process, the minimum expected CM is considered with the confidence level of 90%, 1.67.
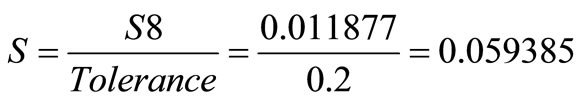
Eight parts are cut and their lengths are measured by minimizing the oscillations resulted from elements (substances, operator, …) other than the machine variations. S8 from 8 produced pieces equals 0.011887.
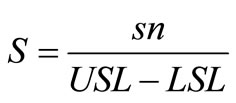
The limits of technical characteristics are the same for given characteristics and consequently, tolerance is 0.2. Ration S is computed as follows:
Since the test is lower than the below limits ( ), the expected capability of the machine (CM ≥ 1.67) is met.
After the process is monitored, and ensuring that it is under the control and it can produce high-quality products, the controlling diagram ( , S) can be used as the benchmark chart (base chart) in the production line; then its above and below limits are applied.
9. Conclusions
The statistical process control (SPC) is a method of process control, that continues when using the controlling diagrams and the related diagrams are under the control; but if they are out of control, the process is modified. The controlling diagram is designed in a way which illustrated the process behavior during the time; and as soon as observing an out of control condition, the problem (deficiency) of the process can be guessed.
Controlling diagrams are considered as efficient device that prevents from producing the defective products. Controlling diagrams present diagnostic information to develop the processes.
SPC gives us comprehensive information about the processes capability and their controllability; thus we can confidently comment on the outputs of the processes. Using SPC technique helps us to easily understand when the permanent improvement occurs in the processes.
Regarding the fact that inspection will have no added value on the product and process and is only considered as a kind of expenditure, the reduction of inspection for highly-capable processes is one of the benefits obtained by using SPC.
10. Acknowledgments
The author is grateful for the technical support of Mavadkaran En.Co. This research is supported by MAPNA group.
11. REFERENCES
- D. C. Montgomery, “Introduction to Statistical Quality Control,” John Wiley & Sons, Hoboken, 1996.
- C. A. Lowry and D. C. Montgomery, “A Review of Multivariate Control Charts,” IIE Transactions, Vol. 27, No. 6, 1995, pp. 800-810. doi:10.1080/07408179508936797
- W. H. Woodall and D. C. Montgomery, “Research Issues and Ideas in Statistical Process Control,” Journal of Quality Technology, Vol. 31, No. 4, 1999, pp. 376-386.
- Z. G. Stoumbos, M. R. Reynolds, T. P. Ryan and W. H. Woodall, “The State of Statistical Process Control as We Proceed into the 21st Century,” Journal of the American Statistical Association, Vol. 95, No. 451, 2000, pp. 992- 998. doi:10.2307/2669484
- L. S. Nelson, “Interpreting Shewhart X Control Charts”, Journal of Quality Technology, Vol. 17, 1985, 114-116.
- R. G. D. Steel and J. H. Torrie, “Principles and Procedures of Statistics,” McGraw-Hill, New York, 1980.
- Western Electric Company, “Statistical Quality Control Handbook,” AT&T Technologies, Indianapolis, 1956.