Materials Sciences and Applications
Vol.10 No.01(2019), Article ID:90242,26 pages
10.4236/msa.2019.101008
The Application of a Representative Volume Element (RVE) Model for the Prediction of Rice Husk Particulate-Filled Polymer Composite Properties
Anil Saigal*, Pandhita Pochanard
Department of Mechanical Engineering, Tufts University, Medford, MA, USA

Copyright © 2019 by author(s) and Scientific Research Publishing Inc.
This work is licensed under the Creative Commons Attribution International License (CC BY 4.0).
http://creativecommons.org/licenses/by/4.0/


Received: August 9, 2018; Accepted: January 26, 2019; Published: January 29, 2019
ABSTRACT
In this study, a numerical representative volume element (RVE) model was used to predict the mechanical properties of a Rice Husk Particulate (RHP)-Epoxy composite for use as an alternative material in non-critical applications. Seven different analytical models Counto, Ishai-Cohen, Halpin-Tsai, Nielsen, Nicolais, Modified Nicolais and Pukanszky were used as comparison tools for the numerical model. RHP-Epoxy biocomposite samples were fabricated with 0%, 10% and 30% RHP volume percentage and the experimental results benchmarked against the numerical and analytical projections. The mechanical properties estimated for 0%, 10% and 30% RHP-Epoxy composites using the numerical and analytical models were in general agreement. Using the analytical models, it was calculated that an increase in volume percentage of RHP to 30% led to continual reduction in elastic Young’s modulus and ultimate tensile strength of the composite. The numerical RVE models also predicted a similar trend between filler volume percentage and material properties. These projections were consistent with the experimental results whereby a 10% increase in RHP content led to 15% and 20% decrease in yield stress and tensile strength, but had no effect on the composite’s elastic property. Further increase in RHP volume percentage to 30% resulted in 8%, 21% and 28% reduction in Young’s modulus, yield stress and tensile strength, respectively. Overall, the results of this study suggest that RHP can be used to reduce the composite raw material costs by replacing the more expensive polymer content with agricultural waste products with limited compromise to the composite’s mechanical properties.
Keywords:
RHP-Epoxy Composites, RVE Model, Mechanical Properties

1. Introduction
Polymer composites are widely used materials with applications in multiple industries [1] . However, its versatility that led to subsequent rise in polymer consumption has prompted an increase in research on alternative materials to address the associated environmental concerns. At the forefront of this research is the investigation on potential applications of biocomposites as a more sustainable replacement to the traditional polymer composites.
Biocomposites are polymer matrix composites that utilize organic fillers materials. Typical organic fillers are derived from plant-based materials such as wood, cotton, kenaf, jute, hemp, and rice. Often times, the majority of these materials are obtained as wastes or by-products from other agricultural processes.
One of the principal matrix materials that are used in polymer matrix composites for several decades is epoxy. This is due in part to its good adhesion, low moisture absorption, minimal shrinkage and processing ease [2] [3] . Consequently, numerous mechanical and morphological studies of organic materials filled epoxy composites have been investigated and reported in literature. Raju et al. studied the effect of agro-waste, particularly groundnut shell particles, with epoxy resin and explored its possibility as substitute for wood-based panels in different applications [3] . They concluded that groundnut shell particle filled epoxy composites can be used as substitutes for wood-based panels. Furthermore, Rout and Satapathy reported that the addition of rice husk fillers influenced and modified the mechanical properties of glass fiber-reinforced epoxy biocomposites [4] . Consequently, these observations fueled the investigation on one of the most globally available agro-waste products, namely rice husk, as the preferred alternative filler material for polymer composites.
Rice (Oyryza Sativa) is one of the most important domesticated cereals that account for over 60% of the calories consumed in Asia [5] [6] . According to the Food and Agriculture Organization of the United Nations (FAO), the annual global rice paddy production in 2013 was approximately 741.4 million tons, of which 33% was wasted as rice mills’ by-product [7] . In addition, rice husk accounted for one-fifth by weight of the harvested and dried rice crops globally [8] [9] [10] .
Despite these benefits, the ability to characterize the behavior of the composite under an applied load still hinges on the model’s capability in capturing the synergistic effects each constituent has on the composite’s macroscopic properties. Analytical and numerical models have been used as alternative tools for the characterization of material’s properties without the need to fabricate and test a considerable number of samples under all types of anticipated loads required for experimental measurements. As a result, the ability to apply theoretical models that are capable of replicating the microstructure of particulate-filled composite to evaluate the mechanical performance and the potential for material costs reduction would make a powerful material design tool.
The properties of a composite system are a complex function of a number of micromechanics parameters, based on the synergistic interaction between the composite’s microstructure [11] [12] [13] . Therefore, the study of micromechanics made it possible to predict the material’s properties as a function of constituent properties and local conditions [14] . As a result, the optimization of a composite’s mechanical properties for different applications is based on the understanding of the relationship between the microstructure and their effects on the composite’s macroscopic response to the applied load [15] . Micromechanics of composites include: properties of the constituent materials, reinforcement size and geometry, reinforcement volume fraction, reinforcement-to-matrix interfacial adhesion, and reinforcement spatial distribution [14] [16] - [23] .
It was hypothesized that the addition of organic filler, such as RHP, can reduce the required polymer matrix content within the structure and subsequently affects the composite’s mechanical properties. It was also postulated that rice husk particulate’s material properties, size, geometry, spatial distribution, particle-matrix interfacial adhesion, and volume fractions were major factors in the determination of the composite’s properties. Given the large difference in mechanical properties between the constituents, an increase in the mechanically inferior filler volume fraction was expected to reduce the mechanical performance of the biocomposite samples.
This paper compared the analytical and numerical models for the prediction of particulate-filled composite properties, and applied them to investigate the effect of natural organic fillers on the mechanical performance of RHP-Epoxy composites.
2. Method
Comparative study between numerical and analytical models was conducted to investigate the application of representative volume element model to predict the mechanical properties of RHP-epoxy composites. The use of analytical models also provided additional reference points for the applied RVE model. All theoretical models outlined in this section were applied to two sets of bio-composites, namely white rice husk ash in polypropylene (WRHA-PP) and rice husk particulate in epoxy resin (RHP-Epoxy).
The experimental results outlined in Fuad et al.’s work on WRHA-PP composite structure were used for validation of all models. Fuad et al.’s work was chosen as a reference for this work because it offered a detailed analysis of an experimental work for a rice husk based biocomposite. Furthermore, RHP-Epoxy samples with 0%, 10% and 30% RHP volume percentage were fabricated and tested in this study. A comparative study between the experimental values and projected values by analytical and numerical models was conducted.
2.1. Material Properties
The materials used for RVE model validation were chosen based on Fuad et al.’s experimental work on the effect of white rice husk ash (WRHA) in polypropylene (PP) composite properties [24] . Additionally, the material properties for both epoxy and RHP were obtained from literature for the subsequent prediction of RHP-Epoxy composite properties and are listed in Table 1.
Multiple analytical, mechanics-based theories were developed to model particulate-filled composite structures. These theories are heavily reliant on filler volume fraction and elastic properties of each constituent. As a result, these models offer a good indication of the resultant properties but may not be able to account for the effect of factors, such as particles interaction and distribution, on the properties of the composites [16] [27] .
2.2. Elastic Young’s Modulus
The elastic modulus of polymer matrix composite is a weighted average value of each constituent’s elastic properties. A large body of literature suggests that the Young’s modulus is the easiest mechanical property to estimate, as it is a bulk property that depends primarily on the geometry, modulus, particle size distribution and concentration of the filler [28] [29] . All models used for the calculation of elastic modulus assume perfect particle-matrix interfacial adhesion as the structures are expected to undergo small deformations within the elastic regime for the calculation of its elastic Young’s modulus. Three different analytical models, namely Counto, Ishai and Cohen, and Halpin-Tsai, are used for these analyses.
2.2.1. Counto
Counto proposed a model for two-phase particulate composites with the assumption of perfect interfacial adhesion between particles and matrix [18] . It was reported that this model fits a wide range of test data.
(1)
where, Ec is composite elastic Young’s modulus, Em is matrix elastic Young’s modulus, Ep is particle elastic Young’s modulus, and Vp is particle volume fraction.
2.2.2. Ishai and Cohen
Ishai and Cohen developed a model that also assumed perfect interfacial adhesion and introduced uniform strain constrain at the boundary to obtain lower bound solution. It was noted by Fu et al. that the model for lower bound solution fits better with the experimental data [15] .
(2)

Table 1. Material properties.
(3)
2.2.3. Halpin-Tsai
Halpin-Tsai model is the semi-empirical relationship for the prediction of the modulus of particulate composites [30] .
(4)
(5)
2.3. Yield Stress
No analytical models were used for the prediction of yield stresses. As a result, the comparative study was conducted between numerical results and experimental values.
2.4. Ultimate Tensile Strength
A material’s ultimate tensile strength is defined as the maximum stress a material can withstand under uniaxial tensile loading [18] . The inclusion of particles was reported to induce both positive and negative effects on the material’s strength as particles can act as both stress concentrators and barriers to crack growth [18] . All chosen models assumed poor interfacial adhesion between the particles and the surrounding matrix material. The model’s assumption of poor interfacial adhesion was deemed valid as an increase in structural deformation that can lead to possible de-cohesion of particles from the matrix material was necessary for the onset of a yield point. Despite this shortcoming, numerous theories for the prediction of composite strength were developed but it should be noted that no particular model has been universally accepted [18] . Four analytical models, Nielsen, Nicolais, Modified Nicolais and Pukanszky models were used for these analyses.
2.4.1. Nielsen
Nielsen model is often used for the prediction of particulate composites’ strength with poor interfacial bonds [18] [24] . The model assumed that the filler particles are not sufficiently wetted by polymer melt, thus agglomerated within the structure and subsequently created porosity.
(6)
where, is composite ultimate tensile strength, and is matrix ultimate tensile strength.
2.4.2. Nicolais
Similarly, Nicolais and Nicodemo developed an expression for the strength of particles composite assuming no interfacial adhesion between fillers and polymer. As it is assumed that only the matrix material carries the load, this model predicts the lower bound strength of the composites [18] .
(7)
2.4.3. Modified Nicolais
A modification to the original Nicolais and Nicodemo model was developed to account for some adhesion between particles and matrix. As a result, this model is appropriate for a composite system where particles have received some surface modification prior to the fabrication of the composite structures.
(8)
2.4.4. Pukanszky
Pukanszky et al. developed an empirical relationship that can account for both extremes of interfacial adhesion by introducing an empirical constant, B. The constant B is dependent on the surface area of particles, particle density and inter-facial bonding energy [18] [24] . It was reported that for poor interfacial bonding, B = 0 because the particles carry no load. This constant varies with the degree of particles adhesion to the matrix and is determined from the experimental results.
(9)
3. Numerical Model
The generation of RVE model in this paper followed the modeling strategies used by Bohm et al. in their work on multi-particles model by modeling elastic reinforcing particles in an elasto-plastic matrix [31] . Consequently, the numerical models were only able to predict the mechanical properties of the composite within the elasto-plastic regime, namely elastic Young’s modulus and yield stress. ANSYS APDL was used for all numerical models generation and tests.
The volume percentage of fillers investigated were 0%, 10% and 30% based on the available experimental data from Fuad et al. [24] . Four unique RVE models were generated for each volume percentage.
3.1. Element Type
Consistent with Bohm et al. and other published works on the computational analysis of particulate-filled composites, all models were meshed with 10-noded tetrahedral elements [19] [31] [32] . This element type was equivalent to ANSYS APDL SOLID 187.
3.2. Particle Dimensions
A particle diameter (d) of 0.21 was used for all subsequent unit cell length calculation. By using a constant particle diameter, the effect of volume fraction (VF %) on the composite properties was isolated and investigated. A particle population (n) of 20 was used for all numerical models. Using these parameters and volume fraction of interest, the unit cell’s edge length (a) was calculated using Equation (10) and is listed in Table 2.
(10)
3.3. Spatial Distribution of Particles
The spatial distribution of particles within the matrix plays a crucial role in determining the homogeneity of the composite system, and by extension its physical and mechanical properties [12] [14] [33] . Homogeneity is a desired characteristic in a material system as it determines the digression in properties of a representative volume of the material from the average properties of the structure [11] . It was noted that both equi-axial and non-equiaxial particles can be used in PFCs to create isotropic materials provided that the particles are randomly orientated within the matrix [11] . Thus, randomly orientated particles were generated for the RVE model.
The particles locations within the matrix were determined with a random numbers generator code written in MATLAB. The use of rand command and a user imposed constraint allowed for the generation of particles positions such that no two particles overlapped. Four unique particles locations were generated for each volume fraction.
3.4. RVE Model Generation
RVE models for each volume fraction were generated using different modeling commands and Boolean operations. The particles were created first (purple), followed by the surrounding cubic matrix phase (blue), as shown in Figure 1. Four different models were generated for each volume fraction.
Table 2. Numerical Model Parameters.
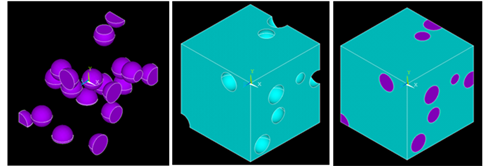
Figure 1. Boolean Command. The particles were created first (purple), followed by the surrounding cubic matrix phase (blue).
3.5. Interfacial Adhesion
The effectiveness in load transfer between matrix and particles is determined by the interfacial adhesion between the constituents. The extent to which the particles adhere to the matrix material is dependent on the particles’ surface wettability. However, it is well known that organic fillers are hydrophilic and polymer materials hydrophobic, thus the incorporation of these materials may not offer perfect interfacial adhesion [11] . As a result, the extent to which the particles adhere to the surrounding matrix material may not be well defined.
Consequently, two types of models (upper and lower bound) were used to investigate the effect of interfacial adhesion on the composite’s mechanical properties and provide an approximated range of properties.
3.6. Upper Bound Model
The use of overlap Boolean command allowed for the simulation of perfect interfacial adhesion between particles and matrix material. This was representative of the upper bound value, or an idealized model, for the calculation of the composite’s material properties.
3.7. Lower Bound Model
In order to emulate the lack of or poor particles-matrix interfacial adhesion, the particle inclusions (purple) were subtracted from the matrix cube using the Boolean subtract command. In doing so, cubic structures with varying structural pore volume fraction were formed.
3.8. Nonlinear Model
A linear elastic model was assigned to both particles and matrix material. Nonlinear rate-independent plasticity model (Bilinear Isotropic Hardening plasticity model) was also assigned to the matrix material to model the elasto-plastic nature of the epoxy matrix under applied stress. This nonlinear model was used in other published works and thus selected for use in this paper [34] .
3.9. Mesh Attributes
The appropriate material properties were assigned to the particles and matrix volume prior to any volume meshing.
3.10. Boundary Conditions
Symmetric boundary conditions were applied to the three faces located at x, y, z = 0 to create a representative microstructural unit cell to the overall particulate-filled composite structure. The remaining three faces located at x, y, z = a of the numerical model in Figure 2 were coupled in the normal direction to each face to ensure uniform macroscopic deformation upon load application. This was assigned through the exclusive selection and coupling of the nodes on each faces in the corresponding normal direction.
3.11. Applied Stress
The uniaxial tensile stress of 50MPa was applied for all arrangements considered. For each volume fraction, one of the four RVE models were evaluated for uniaxial tensile loading in all three perpendicular directions (x, y, z), while the rest were only evaluated for uniaxial tensile loading in the y-direction. Consequently, a total of six result data sets were collected to calculate the average mechanical properties for each volume fraction and also to confirm the isotropic nature of the generated particulate-filled RVEs. This simulation plan was consistent with the works conducted by Bohm et al. [31] .
3.12. Load Steps
To solve nonlinear problems, the applied load was subdivided into a series of load increments and applied to the structure over multiple load steps. Multiple iterative steps were taken to determine the number of substeps, max and min substeps that will allow the simulation to converge with no system errors. Table 3 shows the optimal load steps, max and min substeps that were used in the simulation.
3.13. Output Parameters
The numerically calculated properties of the biocomposite, namely Young’s modulus and tensile stress at yield, for each numerical model were compared to the experimental results reported by Fuad et al for RVE model validation. Once validated, the numerical model was used to predict the properties of RHP-Epoxy.

Figure 2. Symmetrical boundary conditions.
Table 3. Load steps.
3.14. Young’s Modulus
Young’s modulus of the composite was calculated based on the numerical model’s macroscopic deformation in the direction of the applied load. It is well understood that in many materials, a linear relationship exists between the overall applied stress and resultant strain up to a certain limit. Consequently, the material’s Young’s modulus was calculated from the overall applied stress and the resultant maximum elastic strain for each RVE, and the average values and standard deviation were reported.
3.15. Tensile Stress at Yield
The stress-strain curve was constructed from the resultant strains and applied stress extracted from a selected node in each RVE. A node was selected based on the location of a maximum strain in the direction of the applied stress. Once constructed, a parallel line offset to 0.2% strain was drawn along the linear-elastic region of the stress strain curve and its intersection with the stress-strain curve was identified as the composite’s tensile stress at yield [35] .
4. Experimental Model
RHP-Epoxy samples were fabricated in accordance to ASTM D638 standard [36] . The volume percentage of RHP fillers of 0%, 10% and 30% were investigated in this study.
4.1. Materials
4.1.1. Rice Husk
Flaked grains size rice husks were obtained from E.C. Kraus, USA. An average rice husk length of approximately 1 to 5mm was measured. The flaked husks were grinded in a conventional blender and sieved through a medium sieve of 1/16 inches mesh size to generate RHP. Figure 3 shows the flaked rice husk and rice husk particulate.
The standard for the calculation of rice husk bulk density was obtained from ASTM E873 for the Bulk Density of Particulate Biomass Fuels [37] . Following this method, the bulk density of rice husk used in all experimental calculation
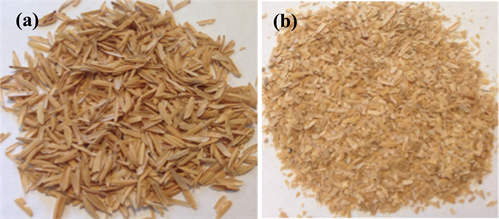
Figure 3. (a) Flaked rice husk; (b) Rice husk particulate.
was 112.2 kg/m3.
4.1.2. Epoxy Resin
LORD 363 A/B Epoxy Adhesive system from LORD Corporation was used as the matrix material in this study. It is a two-component epoxy system used to bond sheet-molded compounds, wood, fiberglass reinforced plastics and other plastics. The reported working time is 3 to 5 minutes at 24 degree Celsius. The density of LORD 363 A/B system was 1160 kg/m3 [38] .
4.2. Sample Dimensions
Dog-boned shape samples of 55 mm gage length (or ASTM D638-Type 1) samples were fabricated according to the ASTM D638 standard as shown in Figure 4. The total volume of each sample was 1.85 × 10⁻⁵ m3 [36] .
The equivalent RHP volume in m3 for each volume fraction percentage was calculated using Equation 11 and the total sample volume of 1.85 × 10⁻⁵ m3.
(11)
The calculated particulate volume was then converted to equivalent RHP weight in gram, , with Equation (12) with the rice husk’s bulk density value as an input parameter.
(12)
It should be noted that the initial RHP volume fraction percentage of interest was 40%. The equivalent RHP weight in gram for each RHP volume fraction percentage was calculated and shown in Table 4.
It was concluded that 0%, 10% and 40% RHP volume fraction percentage were
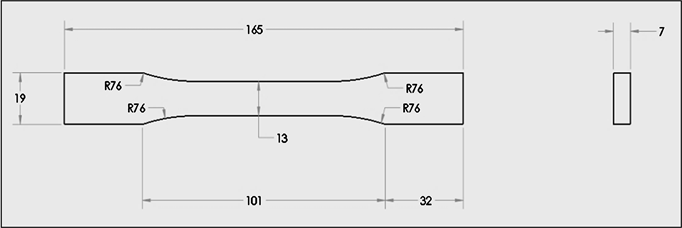
Figure 4. ASTM D638 Type 1 Sample Dimensions. All dimensions in mm [36] .
Table 4. RHP volume to weight conversion.
equivalent to samples with 0, 0.20 and 0.80 gram of Rice Husk Particulate, respectively.
4.3. Samples Fabrication
Epoxy resin and RHP were carefully mixed in the PTFE Teflon mold to minimize the formation of air bubbles. The filled mold was allowed to sit at room temperature until solidified. It was noted that the top surface on all rice husk filled samples were uneven and thus required smoothening with a mill to ensure flat grip surface areas for the tensile tests. Figure 5 shows the premilled and milled samples.
It was deduced that the removal of RHP concentrated top layer of the samples led to an overall reduction in RHP volume fraction percentage within the sample. The revised volume fraction percentage was calculated for each fabricated samples based on the before and after sample thickness. The revised volume fraction percentage calculation suggested that the actual RHP volume fraction in the higher filler content samples were less than 0.40, with most around 0.30. Consequently, all previous 0.40 volume fraction RHP samples were referred to as 0.30 RHP volume fraction samples from here on.
Gage markers were applied on the sample in accordance to the ASTM standard for the optical measurement of axial and transverse strain measurement. As shown in Figure 6, White paint was applied to the gage length section of the samples to minimize any optical interference during the video extensometer measurement.
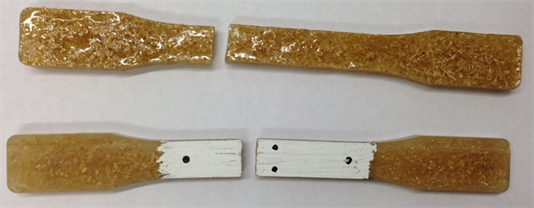
Figure 5. RHP-Epoxy 0.30 Volume Fraction Samples―Premilled (Top) and Milled (Bottom).

Figure 6. 0%, 10% and 30% RHP samples with gage markers.
4.4. Tensile Test Set-Up
Tensile tests were performed in accordance to ASTM 638-10 Type 1 Specimen Procedure. Tests were conducted at a test speed of 5 mm∙min−1 (or a strain rate of 0.1) on an INSTRON 3366 10 kN Dual Column Testing Systems as shown in Figure 7. A load cell of 10 kN and a non-contacting video extensometer were used for the quantification of modulus and elongation.
5. Results and Discussion
5.1. The Effect of Particle Spatial Distribution
The RVE numerical model exhibited more heterogeneous elastic strain fields throughout the structure for both volume fractions as shown in Figure 8(a) and Figure 8(b). It was noted that the matrix material in 10% volume percentage appeared to have experienced relatively higher elastic strain, particularly around the particles. In comparison, the matrix material in 30% volume percentage model appeared to have experienced less plastic deformation with regions of more concentrated strains located in areas between adjacent particles. Consequently, this result suggested that the effect of particle distribution and clusters might not be significant within the elastic regime of structures with low filler content.
Similarly, Figure 8(c) and Figure 8(d) showed the heterogeneous distribution of equivalent plastic strain that was observed throughout the matrix material, with relatively higher equivalent plastic strains in close proximity to the spherical inclusions in all models. Furthermore, the onset of deformation bands was also

Figure 7. Instron 3366 10 kN dual column testing systems with a video extensometer.

Figure 8. Elastic and Plastic Strain Contour Plots for WRHA-PP. (a) 10% Elastic, (b) 30% Elastic, (c) 10% Plastic, (d) 30% Plastic.
observed near the particle’s proximity in all models, particularly in 10% volume fraction percentage structures. These bands appeared to be oriented at 45 degrees from the direction of the applied load, consistent with the observation made by Borbely et al. [39] and the experimental results reported by Wang et al. [40] . The presence of deformation band near the surface of spherical inclusions at a polar angle of about 45 degrees was also reported by Kawaguchi et al. and was deduced to be indicative of strong particle-matrix interfacial adhesion [37] . This was consistent with the assumption made for the development of all numerical models.
Several literatures reported on the considerable effect of particle clusters on the strength and plastic behavior of the composites [15] [41] . These particle clusters contributed to the inhomogeneous properties of the material structure and premature failure was observed in regions of high plastic strain near the clusters. It was noted by Shen et al. (2005) that because the local volume fraction inside the particle clusters is high, these regions are often stiffer than the rest of the material and may bear more loads during deformation, thus are preferential sites for damage initiation [42] . These failures may be attributed to an observation made by Bhrattacharyya et al. (1978) that the composite’s strength is not only dependent on the particle size, but also on the mean free path between the particles [43] . Additionally, the existent of particle clusters also meant that matrix material trapped between parallel clusters was unable to more effectively transfer shear and tensile stresses to the matrix material, thus led to void nucleation.
5.2. WRHA-PP: Numerical Model Verification
5.2.1. Elastic Young’s Modulus
Both numerical and analytical models correctly projected an increase in WRHA-PP Young’s modulus with increased particle volume fraction. This observation was consistent with the reported experimental values by Fuad et al. [24] . This correlation was also in agreement with the comment made by Nielsen et al., whereby the addition of rigid particles worked to enhance the composite’s modulus [44] . This increase in structural stiffness may be attributed to the increase in restrictions on the mobility of the polymer molecules from the increase in particles within the matrix, particularly in regions of matrix materials that were trapped within adjacent particles (Figure 8) [45] . Consequently, the composite stiffness was found to be largely dependent on the filler volume fraction.
As shown in Table 5, the comparative study results suggested that both analytical and numerical models were capable of predicting the elastic response of a composite with low filler volume percentage (10%). However, once the filler content was increased to 30% it was noted that the analytical models began to diverge quickly while the error margins for the numerical model remained relatively low. This was likely attributed to the model’s ability to replicate the particulate-filled composite microstructure, particularly the random distribution of particles. Furthermore, the use of upper and lower numerical models provided a relatively more accurate approximation of the anticipated elastic modulus for a particulate-filled composites.
Yield Stress
In contrast to the reported experimental values, a slight increase in yield stress with increased fillers content was projected by the upper bound model and is presented in Table 6. This discrepancy was likely attributed to the assumption of perfect particle-matrix interfacial adhesion that was used in the upper bound model. As discussed earlier, this assumption may not be an accurate representation of biocomposite material where the particles were untreated, thus perfect adhesion to the surrounding matrix material may not have been attained. On the other hand, the lower bound model correctly projected a decrease in yield stress with increased particle volume fraction. It was noted that the experimental values for all volume fractions were located within these two bounds. This observation
Table 5. WRHA-PP elastic young’s modulus (GPa).
Table 6. WRHA-PP Absolute Yield Stress (MPa).
suggested that some interfacial adhesion existed within the WRHA-PP test samples.
It should be noted that a significant increase in error margins for the composite’s yield stress values with increased particle volume fraction was observed by the upper bound numerical models. As an extension of the idealized theoretical model, this significant discrepancy between the upper bound predictions and measured experimental values for plastic regime properties was anticipated. This increase in error margin was consistent with the observation made by Borbely et al., whereby it was suggested that the large difference between simulation and experimental values was due to void formation in real test materials that may contribute to premature or accelerated yield point [39] .
Other studies have shown that the initiation of particle-matrix de-cohesion can occur upon load application, thus could compromise the composite’s load transfer mechanisms as these were dependent on the quality of particle-matrix interfacial adhesion [46] . It was noted that the extent to which the reinforcements adhere to the matrix material was dependent on the material’s surface wettability that was governed by its properties and surface characteristics. This was of particular concern in a biocomposite system as the combination of the hydrophilic organic materials and hydrophobic polymer often resulted in the formation of poor particle-matrix adhesion. To address this problem, a number of experimental works on biocomposites introduced a coupling agent within the composite to enhance the particle-matrix bonds. However, this was not the case in Fuad et al.’s work [24] . Since coupling agent was not present in their study, negative effects on yield stress and tensile strength was anticipated and captured by the lower bound numerical models.
The experimental results suggested that even without coupling agent, there were some particles-matrix interfacial adhesion in the PP-WRHA structures. Thus, the application of upper and lower bound numerical models were able to capture the microstructures state within the composite and provided a range of anticipated composite properties for material properties prediction.
5.2.2. Ultimate Tensile Strength (UTS)
It should be noted that unlike Young’s modulus calculation, the analytically calculated UTS were only dependent on particle volume fraction. Furthermore, it was noted by Fuad et al. that the tensile stress at yield values for WRHA-PP structures were higher than its tensile stress at break, and no report on the UTS values was available [24] . Consequently, the values for yield stress were deemed suitable as the reference values for UTS values and were used in all subsequent theoretical predictions in this study.
As shown in Table 7, the experimental results indicated that the composite’s UTS values decreased with the increase in filler volume fraction. The analytical models also projected the same correlation and values that were in reasonable agreement with the observed experimental conditions. This correlation was a reflection of the assumption made in all analytical models about the poor
Table 7. WRHA-PP absolute ultimate tensile strength (MPa).
interfacial adhesion between particles and matrix.
The tensile strength projected by all analytical models for both 10% and 30% RHP samples were slightly lower than the experimental values and may be attributed to the presence of some particle-matrix interfacial adhesion in WRHA-PP test samples used by Fuad et al. [24] . It was also discussed by Fuad et al. that this discrepancy might also be credited to the assumption that WRHA particles were discrete, spherical particles by all analytical models, while these particles likely existed as irregular shapes and in the form of agglomerates within the experimental samples. Additionally, the presence of fabrication induced structural flaws may also contribute to the quality of particle-matrix interfacial adhesion within the samples, thus compromised the particles-matrix load transfer efficiency.
Overall, both the analytical and numerical models were in reasonable agreement with the available experimental values for a particulate-filled polymer composite, and therefore were used as tools for the prediction of RHP-Epoxy composite properties. For future work, it was suggested that further optimization for a tighter upper and lower bound models would be beneficial for this work.
5.3. RHP-EPOXY: Prediction and Comparative Study
The validated analytical and numerical models were used for the prediction of RHP-Epoxy composite properties. RHP-Epoxy samples of 0%, 10% and 30% RHP volume fraction percentage were fabricated and its mechanical properties measured in accordance to the ASTM standard for Tensile Test. These experimental findings were subsequently used for a comparative study with the analytical and numerical projections.
5.3.1. Elastic Young’s Modulus
It was postulated that the inclusion of the mechanically inferior rice husk particles in epoxy resin would lead to a decrease in the composite elastic modulus with increased filler content. Both numerical and analytical models were able to model this correlation. The experimental results suggested that a 10% increase in RHP content induced no change to the composite elastic properties. In contrast, a 7% reduction in Young’s modulus was observed in the 30% RHP.
Experimentally, it was observed that the inclusion of RHP in Epoxy resin led to an overall decrease in the overall composite Young’s modulus. It was noted that minimal effect on the composite’s overall elastic property was observed with a 10% increase in RHP content. This nominal change in stiffness between pure epoxy and 10% RHP samples suggested that the presence of some particles clusters in the low filler samples may have no significant effect on the composite elastic response [44] Alternatively, this observation may be reflective of the limited number of pure epoxy test samples which likely contributed to the erroneous representation of the test populations. In this study, only two pure epoxy samples were used for the calculation of Young’s modulus, while four and six samples were tested for 10% and 30% RHP volume percentage, respectively.
As shown in Table 8, all analytical models projected Young modulus values that were approximately 20% and 30% lower than the experimental results for 10% and 30% RHP structures. The high error margins were likely attributed to the models inability to account for the effect of particles spatial distribution in the test samples. It should also be noted that the results obtained from Ishai model were most pessimistic of the composite’s performance. This prediction was consistent with the model’s intent to provide a lower bound solution for Young’s modulus calculation.
In contrast, all numerical models yielded lower error margins percentage relative to the analytical projections. The upper bound and lower bound models generated approximately 2% and 11% of error margin for the 10% RHP structures. The numerical models ability to better represent the real RHP-Epoxy samples may be attributed to the models ability to better account for the effect of particles spatial distribution on the composite properties.
It should be noted that a larger error margin was expected for the lower bound models as these were representative of the scenario with the lowest possible Young’s modulus. Consequently, the experimental results for each volume fraction percentage were expected to lie between the upper and lower numerical model projections. However, this correlation was not evident in the experimental results. It was noted that the error margins for both numerical models deteriorated with increased RHP percentage. This observation may be attributed to the accuracy of the RHP mechanical properties that were used as input parameters in all theoretical models. To the best of the authors’ knowledge, there is a limited number of published works on the properties of rice husk. As a result, the lack of organic material properties database would likely contributed to the large error margins that existed between various models [26] .
5.3.2. Yield Stress
The numerical models predicted a reduction in Yield Stress with increased RHP
Table 8. RHP-EPOXY absolute young’s modulus (GPa).
percentage. This observation was consistent with the experimental results and is presented in Table 9 and Table 10. Experimental yield stress (Exp) is the average yield stress of all samples for each volume fraction. A 15% and 21% reduction in yield stress were observed in the 10% and 30% RHP samples, respectively.
Both numerical models suggested that a 30% increase in rice husk content would result in approximately 12% and 34% decrease in yield stress for upper and lower bound scenarios, respectively. Furthermore, it was also observed that an increase in RHP content also led to a reduction in elongation at yield value for all samples. This may be attributed to the increase in number of weak particle-matrix interfacial adhesion regions which contributed to the earlier onset of plastic deformation.
The correlation between filler content and yield stress in the plastic regime was consistent with numerous published works on biocomposite material systems [47] . According to Nielsen et al (1994), the yielding phenomenon is predominantly determined by the quality of the particle-matrix interfacial adhesion [48] . This suggested that when loading the RHP-Epoxy sample beyond its elastic limit, the particle-matrix interfacial adhesion began to deteriorate and ultimately led to the onset of particle-matrix de-cohesion. This result was consistent with the observation made by Bazhenov et al. (2005) [25] . The increase presence of compromised particle-matrix adhesion sites with increase RHP content resulted in an overall reduction in available load transfer surface for samples with higher filler content. Consequently, the reduction in yield stress with increased RHP content can be attributed to the increased presence of weak particle-matrix interfacial adhesion.
It was noted that the correlation in RHP-Epoxy samples was in contrast to those observed in the WRHA-PP structures. In accordance to that model, it was initially anticipated that the upper bound model, representative of strong particle-matrix adhesion, would predicted an improved in yield stress with increase filler content. This postulation was based on the effect particle-matrix interfacial adhesion had on the composite’s overall plastic responses i.e. perfect interfacial adhesion would allow for more efficient load transfer between matrix
Table 9. RHP-EPOXY yield stress (MPa).
Table 10. RHP-Epoxy elongation at yield.
and organic particles. However in the case of RHP-Epoxy samples investigated in this study, it was deduced that the incorporation of the mechanically inferior RHP worked to weaken the overall composite structures as the particles no longer work as reinforcement as was the case in the WRHA-PP structures. This discrepancy, particularly for the upper bound model, suggested that the mechanical properties of the particles was a more significant factor in determining the plastic properties of the composite compared to the quality of the particle-matrix adhesion alone.
5.3.3. Ultimate Tensile Strength (UTS)
All analytical models predicted a decrease in UTS with increased filler content as shown in Table 11 and Table 12. This correlation was also evident in the experimental setting. The experimental results suggested a 20% and 27.6% reduction in UTS for 10% and 30% RHP samples, respectively.
The analytical model with the most pessimistic outlook projected a trade-off between 30% RHP content and 60% decrease in UTS. This correlation between UTS and RHP content was consistent with the justification previously outlined for WRHA-PP structures, whereby the introduction of particles increased the presence of weak particle-matrix interfacial adhesion sites. It should be noted that this observation was also in agreement with Rout et al. and the correlation stipulated that the inclusion of rice husk resulted in reduced load bearing capacity of the composite [4] . Crespo et al. also reported a similar behavior for plasticized PVC composites [49] . Additionally, a sharp reduction in elongation at break values was observed between pure epoxy and 10% RHP samples. It was noted that the difference in elongation at break was less prominent between 10% and 30% RHP samples. This observation suggested that the inclusion of particles had a significant effect on the sample properties, but that further increase in particle volume fraction made no additional impact on the material’s elongation at break value.
It should be noted that the large gap between the experimental and analytical values for the 30% RHP samples was likely attributed to the presence of some
Table 11. RHP-EPOXY absolute UTS (MPa).
Table 12. RHP-Epoxy elongation at break.
particles-matrix interfacial adhesion in the fabricated samples. The presence of these bonds in the test samples would contradict the assumption of poor interfacial adhesion in all analytical models. Consequently, this discrepancy in modeling assumption may be contributed to the relatively higher error margins in samples with high RHP content. The experimental results suggested that some RHP were sufficiently wetted by the epoxy resin, thus formed some particles-matrix interfacial bonds in the test samples.
For future works, the authors recommend that the interfacial adhesion between organic fillers and polymer matrix be optimized for a more accurate representation of the composite materials. Furthermore, the accuracy of the predicted material properties will also benefit from using constituent material properties obtained from multiple reliable sources in all theoretical models.
6. Manufacturing Issues
The composite material properties were greatly influenced by the fabrication process. Similar to the study on WRHA-PP structures, the presence of structural flaws may vary from sample to sample, thus introduced variability to the observed experimental test results. Several factors that likely affected the quality of the RHP-Epoxy samples include the use of an open face mold, agglomeration of RHP particles during fabrication, characteristics of the epoxy resin and the presence of air bubbles. It should be noted that these factors were often interconnected and their synergistic interactions contributed to the variation in sample properties. Premalal et al. (2002) suggested that particle clusters, trapped air bubbles and other manufacturing flaws all contributed to an early structural failure for high RHP content samples in their work on RHP-filled polypropylene composite [50] .
As part of the fabrication process, the epoxy resin and RHP were mixed directly in the mold and left to solidify at room temperature in an open mold. Despite careful dispensation of the epoxy resin in the mold, this open mold process still resulted in structures of varying thickness. This was especially problematic for tensile tests as samples were often too thick for the available mechanical grips.
Furthermore, rice husk particles floated to the top while the samples rested at room temperature. These particles form clusters and float to the top during the curing process, thus resulted in samples with bumpy top surface and the bottom half of the samples were left mostly free of RHP. The agglomeration of RHP was likely attributed to the material properties of the rice husk particles and the solidification characteristics of the LORD epoxy system. The fabrication process included an application of the viscous epoxy resin with a dispensing gun directly into the PTFE Teflon mold, followed by the addition of RHP particles. As the purchased epoxy system came in a dispensing gun, this two-part system prohibited the mixing of epoxy and RHP in larger volume, which may have allowed for a more thorough mixing. This limitation, together with a short working time from the two-part epoxy system, meant that a careful mixing of RHP particles and the complete filling of the mold must occur simultaneously.
If the solution was mixed too vigorously then air bubbles may be introduced into the structures as porosity. Additionally, if the epoxy material is applied too quickly then gaps or notches may exist, particularly at the bottom of the samples, where the epoxy resin may fail to completely fill out the mold. These flaws may serve as stress concentrators in the structures, thus lead to premature failure. Consequently, the limitation in fabrication time likely contributed to the properties variation between samples and affected the composite properties.
To overcome this shortcoming related to thickness variation, the samples were further processed by a mill to remove the uneven top surface. As a result, some rice husk particles were removed from the sample and thus likely affected the RHP volume fraction and ultimately contributed to the variation in sample properties.
7. Conclusions
Theoretical results calculated for 0%, 10% and 30% WRHA-PP composites were compared to existing experimental values and used to validate the numerical model’s effectiveness in predicting the mechanical properties of particulate-filled composites. The results suggest that the numerical models provide a reasonably accurate representation of a particulate-filled composite structure. Of the analytical models, Ishai’s and Nielsen’s were most able at predicting the elastic Young’s modulus and ultimate tensile strength of the structure, respectively. As a result, both analytical and numerical models were subsequently applied for the prediction of mechanical properties of RHP-Epoxy composites, which are also a function of the extent of interfacial adhesion between particles and matrix.
The experimental results for the RHP-Epoxy composites suggested that a 10% increase in RHP did not affect the composite elastic property, but led to 15% and 20% decrease in yield stress and tensile strength, respectively. Further increase in RHP to 30% volume fraction percentage also led to 8%, 21% and 28% reduction in Young’s modulus, yield stress and tensile strength. Additionally, the composite’s responses to uniaxial loading as predicted by the RVE model were found to be in reasonable agreement with the analytical and experimental results. Overall, both analytical and numerical models predicted that the addition of rice husk particles can be used to replace some polymer content within the composite structure with minimal effect to the composite’s mechanical properties.
Conflicts of Interest
The authors declare no conflicts of interest regarding the publication of this paper.
Cite this paper
Saigal, A. and Pochanard, P. (2019) The Application of a Representative Volume Element (RVE) Model for the Prediction of Rice Husk Particulate-Filled Polymer Composite Properties. Materials Sciences and Applications, 10, 78-103. https://doi.org/10.4236/msa.2019.101008
References
- 1. La Mantia, F.P. and Morreale, M. (2011) Green Composites: A Brief Review. Composites: Part A, 42, 579-588.
https://doi.org/10.1016/j.compositesa.2011.01.017 - 2. Faruk, O., et al. (2012) Biocomposites Reinforced with Natural Fibers: 2000-2010. Progress in Polymer Science, 37, 1552-1596.
https://doi.org/10.1016/j.progpolymsci.2012.04.003 - 3. Raju, G.U. and Kumarappa, S. (2012) Experimental Study on Mechanical and Thermal Properties of Epoxy Composites Filled with Agricultural Residue. Polymers from Renewable Resources, 3, 117-138.
https://doi.org/10.1177/204124791200300303 - 4. Rout, A.K. and Satapathy, A. (2012) Development and Characterization of Rice Husk-Filled Glass Fiber-Reinforced Epoxy Biocomposites. Composites: Mechanics, Computations, Applications, an International Journal, 3, 95-106.
- 5. Kim, H.S., et al. (2004) Thermogravimetric Analysis of Rice Husk Flour Filled Thermoplastic Polymer Composites. Journal of Thermal Analysis and Calorimetry, 76, 395-404.
https://doi.org/10.1023/B:JTAN.0000028020.02657.9b - 6. Mahadevamma, S. and Tharanathan, R.N. (2007) Processed Rice Starch Characteristics and Morphology. European Food Research and Technology, 225, 603-612.
https://doi.org/10.1007/s00217-006-0419-5 - 7. FAO, Rice Market Monitor, T.a.m. Division, Editor 2013, Food and Agriculture Organization of the United Nations, 1-40.
- 8. Emadi, S., et al. (2013) Preparation and Properties of Rice Husk-Filled Plasticized Wheat Gluten Biocomposites. Polymer Engineering and Science, 1-7.
- 9. Ramle, M.S., Romli, A.Z. and Abidin, M.H. (2013) Tensile Properties of Aminosilane Treated Rice Husk/Recycled PVC Composite. Advanced Materials Research, 812, 151-156.
https://doi.org/10.4028/http://www.scientific.net/AMR.812.151 - 10. Chaudhary, D.S., Jollands, M.C. and Cser, F. (2004) Recycling Rice Hull Ash: A Filler Material for Polymeric Composites? Advances in Polymer Technology, 23, 147-155.
https://doi.org/10.1002/adv.20000 - 11. Matthews, F.L., et al. Finite Element Modelling of Composite Materials and Structures. Woodhead Publishing Limited, Cambridge.
- 12. Balac, I., et al. (2003) Finite Element Modeling of Mechanical Properties of Particulate Composite Biomaterials. Materials Science Forum, 413, 257-261.
https://doi.org/10.4028/http://www.scientific.net/MSF.413.257 - 13. Peng, X., et al. (2009) Evaluation of Mechanical Properties of Particulate Composites with a Combined Self-Consistent and Mori-Tanaka Approach. Mechanics of Materials, 41, 1288-1297.
https://doi.org/10.1016/j.mechmat.2009.07.006 - 14. Daniel, I.M. and Ishai, O. (1994) Engineering Mechanics of Composite Materials. Oxford University Press.
- 15. Balasivanandha Prabu, S. and Karunamoorthy, L. (2008) Microstructure-Based Finite Element Analysis of Failure Prediction in Particle-Reinforced Metal-Matrix Composite. Journal of Materials Processing Technology, 207, 53-62.
https://doi.org/10.1016/j.jmatprotec.2007.12.077 - 16. Ouyang, Y., et al. (2012) A New 3-D Unit Cell Model Used in Homogenization Estimation of Effective Properties of Particle-Filled Composites. Advanced Materials Research, 374-377, 1269-1273.
- 17. Kaundal, R., Patnaik, A. and Satapathy, A. (2012) Comparison of the Mechanical and Thermo-Mechanical Properties of Unfilled and SiC Filled Short Glass Polyester Composites. Silicon, 4, 175-188.
https://doi.org/10.1007/s12633-012-9121-3 - 18. Fu, S.-Y., Feng, X.-Q., Lauke, B. and Mai, Y.-W. (2008) Effects of Parti-cle Size, Particle/Matrix Interface Adhesion and Particle Loading on Mechanical Properties of Particulate-Polymer Composites. Composites Part B: Engineering, 39, 933-961.
https://doi.org/10.1016/j.compositesb.2008.01.002 - 19. Alfonso, I., et al. (2013) Young’s Modulus Estimation Based on High Symmetry 3-D Finite Element Model for Metal Matrix Composites. Computational Materials Science, 69, 304-310.
https://doi.org/10.1016/j.commatsci.2012.11.047 - 20. Ayyar, A., Crawford, G.A., Williams, J.J. and Chawla, N. (2008) Numerical Simulation of the Effect of Particle Spatial Distribution and Strength on Tensile Behavior of Particle Reinforced Composites. Computational Materials Science, 44, 496-506.
https://doi.org/10.1016/j.commatsci.2008.04.009 - 21. Virk, A.S., Hall, W. and Summerscales, J. (2012) Modulus and Strength Prediction for Natural Fibre Composites. Materials Science and Technology, 28, 864-871.
https://doi.org/10.1179/1743284712Y.0000000022 - 22. Masa, B., Nahlik, L. and Hutar, P. (2013) Numerical Modelling of Particulate Composite with a Hyperelastic Matrix. Key Engineering Materials, 525-526, 25-28.
https://doi.org/10.4028/www.scientific.net/KEM.525-526.25 - 23. Leggoe, J.W., Mammoli, A.A., Bush, M.B. and Hu, X.Z. (1998) Finite Element Modelling of Deformation in Particulate Reinforced Metal Matrix Composites with Random Local Microstructure Variation. Acta Materialia, 46, 6075-6088.
https://doi.org/10.1016/S1359-6454(98)00279-1 - 24. Fuad, M.Y.A., Ismail, Z., Mansor, M.S., Mohd Ishak, Z.A. and Mohd Omar, A.K. (1995) Mechanical Properties of Rice Husk Ash/Polypropylene Composites. Polymer Journal, 27, 1002-1015.
https://doi.org/10.1295/polymj.27.1002 - 25. Bazhenov, S.L., Goncharuk, G.P., Oshmyan, V.G. and Serenko, O.A. (2006) The Effect of Filler Content on the Lower Yield Stress of Polymer Composites. Polymer Science Series B, 48, 70-74.
https://doi.org/10.1134/S1560090406030031 - 26. Xu, L.Z., Li, Y.M., Ma, Z., Zhao, Z. and Wang, C.H. (2013) Theoretical Analysis and Finite Element Simulation of a Rice Kernel Obliquely Impacted by a Threshing Tooth. Biosystems Engineering, 114, 146-156.
https://doi.org/10.1016/j.biosystemseng.2012.11.006 - 27. Mortazavi, B., Baniassadi, M., Bardon, J. and Ahzi, S. (2013) Modeling of Two-Phase Random Composite Materials by Finite Element, Mori-Tanaka and Strong Contrast Methods. Composites Part B: Engineering, 45, 1117-1125.
https://doi.org/10.1016/j.compositesb.2012.05.015 - 28. Bigg, D.M. (1987) Mechanical Properties of Particulate Filled Polymers. Polymer Composites, 8, 115-122.
https://doi.org/10.1002/pc.750080208 - 29. Wang, M. and Pan, N. (2009) Elastic Property of Multiphase Composites with Random Microstructures. Journal of Computational Physics, 228, 5978-5988.
https://doi.org/10.1016/j.jcp.2009.05.007 - 30. Battegazzore, D., Alongi, J. and Frache, A. (2014) Poly(Lactic Acid)-Based Composites Containing Natural Fillers: Thermal, Mechanical and Barrier Properties. Journal of Polymers and the Environment, 22, 88-98.
https://doi.org/10.1007/s10924-013-0616-9 - 31. Bohm, H.J. and Han, W. (2001) Comparison between Three-Dimensional and Two-Dimensional Multi-Particle Unit Cell Models for Particle Reinforced Metal Matrix Compo-sites. Modelling and Simulation in Materials Science and Engineering, 9, 47-65.
https://doi.org/10.1088/0965-0393/9/2/301 - 32. Kari, S., Berger, H., Rodriguez-Ramos, R. and Gabbert, U. (2007) Computational Evaluation of Effective Material Properties of Composites Reinforced by Randomly Distributed Spherical Particles. Composite Structures, 77, 223-231.
https://doi.org/10.1016/j.compstruct.2005.07.003 - 33. Ramakrishnan, N. and Arunachalam, V.S. (1997) Finite Element Methods for Materials Modelling. Progress in Materials Science, 42, 253-261.
https://doi.org/10.1016/S0079-6425(97)00031-5 - 34. Galli, M., Botsis, J. and Janczak-Rusch, J. (2007) An Elastoplastic Three-Dimensional Homogenization Model for Particle Reinforced Composites. Computational Materials Science, 41, 312-321.
https://doi.org/10.1016/j.commatsci.2007.04.010 - 35. Ahmeti, G., Kocaman, S., Ozaytekin, I. and Bozkurt, P. (2013) Epoxy Composites Based on Inexpensive Char Filler Obtained from Plastic Waste and Natural Resources. Polymer Composites, 34, 500-509.
https://doi.org/10.1002/pc.22452 - 36. ASTM (2010) ASTM D638-10: Standard Test Method for Tensile Properties of Plastics. ASTM International.
- 37. ASTM (1998) ASTM E873-82: Standard Test Method for Bulk Density of Densified Particulate Biomass Fuels. ASTM International.
- 38. LORD (2010) LORD 363 Epoxy Adhesive Technical Data, in LORD Corporation. LORD Publication, Cary.
- 39. Borbely, A. and Biermann, H.S. (2000) Finite Element Investigation of the Effect of Particle Distribution on the Uniaxial Stress-Strain Behavior of Particulate-Reinforced Metal-Matrix Composites. Advanced Engineering Materials, 2, 366-369.
https://doi.org/10.1002/1527-2648(200006)2:6<366::AID-ADEM366>3.0.CO;2-K - 40. Wang, Z., Chen, T.K. and Lloyd, D.J. (1993) Stress Distribution in Particulate-Reinforced Metal-Matrix Composites Subjected to External Load. Metallurgical Transactions A, 24, 197-198.
https://doi.org/10.1007/BF02669616 - 41. Chawla, N. and Shen, Y.L. (2001) Mechanical Behavior of Particle Reinforced Metal Matrix Composites. Advanced Engineering Materials, 3, 357-370.
https://doi.org/10.1002/1527-2648(200106)3:6<357::AID-ADEM357>3.0.CO;2-I - 42. Shen, H. and Lissenden, C.J. (2005) Stress and Strain Localization Three-Dimensional Modeling for Particle-Reinforced Metal Matrix Composites. Metallurgical and Materials Transactions A, 36, 1653-1660.
https://doi.org/10.1007/s11661-005-0027-1 - 43. Bhattacharyya, S.K., Basu, S. and De, S.K. (1978) Effect of Particle Size on the Mechanical Properties of Poly(Vinylchloride)-Copper Particulate Composite. Journal of Materials Science, 13, 2109-2118.
https://doi.org/10.1007/BF00541664 - 44. Mammoli, A.A. and Bush, M.B. (1995) Effects of Reinforcement Geometry on the Elastic and Plastic Behaviour of Metal Matrix Composites. Acta Metallurgica et Materialia, 43, 3743-3754.
https://doi.org/10.1016/0956-7151(95)90158-2 - 45. Ayswarya, E.P., Francis, K.F.V., Renju, V.S. and Thachil, E.T. (2012) Rice Husk Ash—A Valuable Reinforcement for High Density Polyethylene. Materials and Design, 41, 1-7.
https://doi.org/10.1016/j.matdes.2012.04.035 - 46. Subramanian, K.N., Bieler, T.R. and Lucas, J.P. (1995) Mechanical Shaping of Metal Matrix Composites. Key Engineering Materials, 104-107, 175-214.
https://doi.org/10.4028/http://www.scientific.net/KEM.104-107.175 - 47. Monette, L. and Anderson, M.P. (1993) Effect of Particle Modulus and Toughness on Strength and Toughness in Brittle Particulate Composites. Scripta Metallurgica et Materialia, 28, 1095-1100.
https://doi.org/10.1016/0956-716X(93)90016-L - 48. Nielsen, L.E. and Landel, R.F. (1994) Mechanical Properties of Polymers and Composites. 2nd Edition. In: Faulkner, L.L., Ed., Mechanical Engineering, Marcel Dekker, Inc., New York.
- 49. Crespo, J.E., Sánchez, L., García, D. and López, J. (2007) Study of the Mechanical and Morphological Properties of Plasticized PVC Composites Containing Rice Husk Fillers. Journal of Reinforced Plastics and Composites, 27, 229-243.
https://doi.org/10.1177/0731684407079479 - 50. Premalal, H.G.B., Ismail, P. and Baharin, A. (2002) Comparison of the Mechanical Properties of Rice Husk Powder Filled Polypropylene Composites with Talc Filled Polypropylene Composites. Polymer Testing, 21, 833-839.
https://doi.org/10.1016/S0142-9418(02)00018-1
Nomenclature
Composite elastic Young’s Modulus, Ec
Matrix elastic Young’s modulus, Em
Particle volume fraction, Vp
Particle elastic Young’s modulus, Ep
Particle equivalent volume, vp
Particle equivalent weight, Wp
Composite ultimate tensile strength, σc
Matrix ultimate tensile strength, σm