Materials Sciences and Applications
Vol.5 No.4(2014), Article ID:44380,14 pages DOI:10.4236/msa.2014.54028
Interlaminar Fracture Toughness of Epoxy Glass Fiber Fly Ash Laminate Composite
Ajit Bhandakkar1, Niraj Kumar1, R. C. Prasad1, Shankar M. L. Sastry2
1Department of Metallurgical Engineering and Materials Science, Indian Institute of Technology Bombay, Mumbai, India
2Mechanical, Aerospace and Structural Engineering, Washington University in St. Louis, Saint Louis, USA
Email: ajitbb@iitb.ac.in
Copyright © 2014 by authors and Scientific Research Publishing Inc.
This work is licensed under the Creative Commons Attribution International License (CC BY).
http://creativecommons.org/licenses/by/4.0/


Received 8 December 2013; revised 16 January 2014; accepted 6 February 2014
ABSTRACT
Epoxy glass fiber laminate composite (PMCs) are finding ever increasing applications in aerospace and automobile industries due to its high strength to weight ratio and resistance to aqueous environment. Additions of particulate reinforcements in the polymer matrix are reported to improve the Interlaminar Shear Strength and Interlaminar Fracture Toughness of the composites. In the present investigation, epoxy glass fiber laminate composites were processed using hand layup and vacuum bagging technique. The particulate reinforcement precipitator fly ash (25 - 45 µm) was added in the epoxy matrix by mechanical mixing up to 10 wt%. The effects of fly ash reinforcement on the mechanical properties and Interlaminar Fracture Toughness were studied before and after exposure to aqueous fog in a salt fog chamber at 45˚C. In unexposed condition Mode I interlaminar fracture toughness of epoxy glass fiber laminate composite improved by the addition of fly ash reinforcement 10% (By weight) by 49.43% and when it was subjected to aqueous fog for 10 days the interlaminar fracture toughness improved 58.42%. Exposure to aqueous fog for 10 days causes plasticization of resin matrix and weakening of fiber/matrix interface results in improvement in interlaminar fracture toughness. The fracture surfaces were analyzed using scanning electron microscopy.
Keywords:Interlaminar Fracture Toughness; Epoxy Glass Fiber Laminate Composite; Fly Ash

1. Introduction
Polymer matrix composites (PMCs) are extensively used for light weight structures where a high specific stiffness, strength and corrosion resistance is required. During service, components absorb moisture from their surroundings and their properties get affected. The kinetics of moisture absorption and its effect on mechanical properties must be understood when designing components and structures made of PMCs [1] . Hot and wet environments are expected to play an important role in determining the damage tolerance behaviour of the composites and these influences have to be assessed in order to ensure the performance of the component to be reliable in extreme environmental conditions.
Various researchers have studied the effect of particulate (polymer/elastomer) addition on the kinetics of moisture absorption and on mechanical properties [2] -[5] . Addition of particulate reinforcement is reported to alter the kinetics of moisture uptake which is expected to be further enhanced in the case of fly ash addition as reinforcement. Studies conducted by many researchers have indicated that water penetration into PMC involves three mechanisms: 1) direct diffusion of water molecule into the resin matrix, 2) flow of water molecules through fiber/matrix interface, and 3) transport of water molecules through micro cracks and micro damages. Experimental studies have indicated that the moisture absorption initially follows Fick’s Second Law of diffusion which is governed by concentration gradient and the weight gain is proportional to square root of time [6] . Deviation from Fickian behavior is also reported such as non attainment of equilibrium, a decrease in mass gain after maximum moisture uptake and double step absorption kinetics [7] .
Moisture uptake can influence the tensile strength and interlaminar fracture toughness (GIC) of such composites. Delamination is the major mechanism contributing to the interlaminar fracture in PMCs. It is important to study the effect of exposure to moisture on the delamination characteristics indicated by the interlaminar fracture toughness (GIC). Fly ash which is cheap and available in abundance is emerging as reinforcement for Metal matrix and PMCs.
2. Experimental
2.1. Material
Epoxy (Araldite LY556—Bisphenol a Diglycidyl Ether Polymer) with hardener HY951 supplied by M/s Huntsman, Mumbai was used as resin matrix. Glass fiber mat (E Glass) (Grade T-10) manufactured and supplied by M/s Urja Products Ltd, Ahmadabad was selected as fiber reinforcement for the fabrication of Glass/ Epoxy laminate composites. The closeness of fabric in threads per cm was 35 in warp and 21 in weft direction. The fibers were oriented in 0˚ and 90˚ direction. The weaving and mechanical properties of the glass fiber mat is listed in Table 1 and Figure 1.

Table 1. Mechanical properties of the glass fiber mat.

Figure 1. SEM micrograph of glass fiber mat.
The particulate reinforcement chosen was fly ash grade P60 (precipitator fly ash) supplied by M/s Dirk India Ltd., Nasik. These particles were mostly spherical in nature and in the size range of 25 - 45 µm. The chemical composition of the fly ash reinforcement is listed in Table 2 and EDAX analysis is listed in Figure 2.
2.2. Processing of Epoxy Glass Fiber Laminate Composite
The epoxy glass fiber laminates composite (0.6 weight fraction of fiber) (300 mm × 300 mm × 4 mm) were fabricated at IIT Bombay using hand layup technique and were cured under vacuum (Vacuum Bagging Technique) as shown in Figure 3. The laminates were fabricated with 5% and 10% (w/w) fly ash addition and without fly ash. During fabrication of composite laminate 15 µm thick and 50 mm wide PTFE film was inserted in mid section of the laminate composite near one edge for making pre crack double cantilever beam (DCB) samples as per ASTM standard ASTM D 5528. The test specimens for various tests were prepared from the processed composite laminates. Dog bone tensile test specimens were cut using a profile cutter. The specimens for moisture absorption and DCB tests were cut using a high speed abrasive wheel cutter. Dog bone tensile test specimens were prepared in both warp (longitudinal) and weft (transverse) direction. For the environmental testing, the edges were masked using a lacquer (Varnish of Asian Paints) to prevent ingress of moisture through the edges. The DCB samples were prepared by fixing brass piano hinges on the two faces using Araldite.
2.3. Effect of Water Absorption
The epoxy glass fiber fly ash reinforced laminate composites were immersed in distilled water at 45˚C to study the kinetics of moisture absorption in the samples. The samples were removed from the container from time to time at various time intervals for weight measurement. The surfaces of the wet samples were wiped before weighing using a water absorbent paper. The change in weight of the samples was measured using and electronic weighing machine of 0.0001 g accuracy. The weight gain was calculated according to the following Equation (1).
Table 2. Properties of fly ash reinforcement.
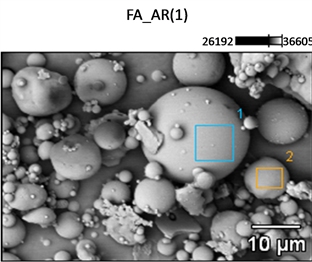
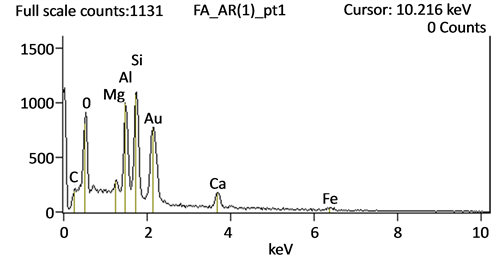
Figure 2. EDAX analysis of fly ash reinforcement.
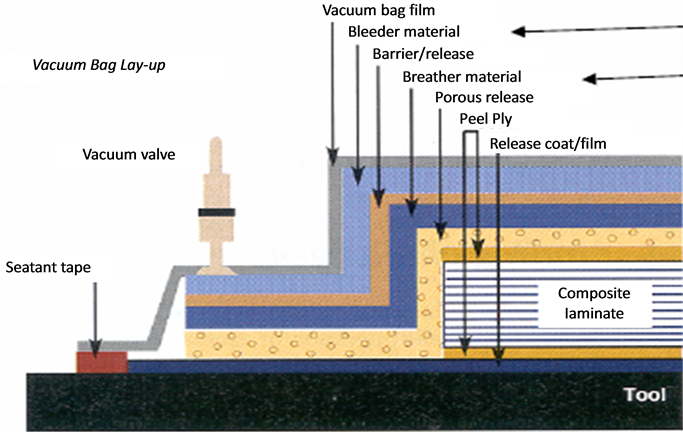
Figure 3. Experimental setup for vacuum curing.
 (1)
(1)
where, md is dry weight and mw is wet weight of the test sample. The fabricated samples were exposed to degrading environment (aqueous fog at 45˚C) in a 100 liter Kaleidoscope Salt Fog Chamber.
2.4. Tensile Strength
The tensile testing of composite samples were conducted on 25 kN capacity Tinius Olsen (H25KS) bench top universal testing machine. The tensile testing was carried out at 1 mm/min crosshead velocity as per ASTM D638-03 [8] . The width of the sample in the gauge portion was 10 mm and length of straight portion was 80 mm as given in Figure 4.
2.5. Mode I Interlaminar Fracture Toughness Testing of Laminate Composite
The Mode I Interlaminar Fracture Toughness Test (DCB Test) was conducted as per ASTM D 5528 [9] at crosshead velocity of 2 mm/min. The GIC has been evaluated for 0% fly ash, 5%fly ash and 10% fly ash composite laminates with and without exposure to aqueous fog at 45˚C for 10 days and 20 days. To monitor the position of the crack tip using a travelling microscope, both sides of the specimen were coated with the white correction fluid to enhance the visibility of the propagating crack. The first 10 mm length of the specimen from the delamination front was marked at an interval of 1 mm and further 25 mm length was marked at an increment of 5 mm as shown in Figure 5.
The rate of loading was maintained same for all the test specimens. The load verses crack opening displacement was recorded. Crosshead separation was used as a measure of opening displacement of the specimen.
2.6. Interlaminar Shear Strength
The short beam shear test is used to determine interlaminar shear strength of the composite material. The tests were conducted as per ASTM D 2344-00. Flat specimens with span length to thickness ratio of 4.0 and length to thickness ratio of 6.0 were tested. The test were performed using three point bend flexure test set up as shown in Figure 6 mounted on a 10 ton capacity MTS machine, at a crosshead displacement of 1.00 mm/min. The force was recorded and ILSS was calculated as below as per ASTM D2344/ASTM D 2344M.

Figure 4. Tensile test specimen.
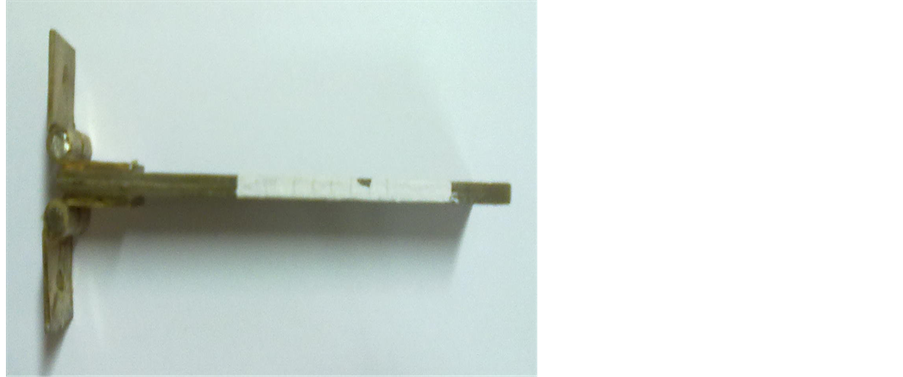
Figure 5. DCB Test specimen with brass piano hinges for measurement of interlaminar frcture toughness.
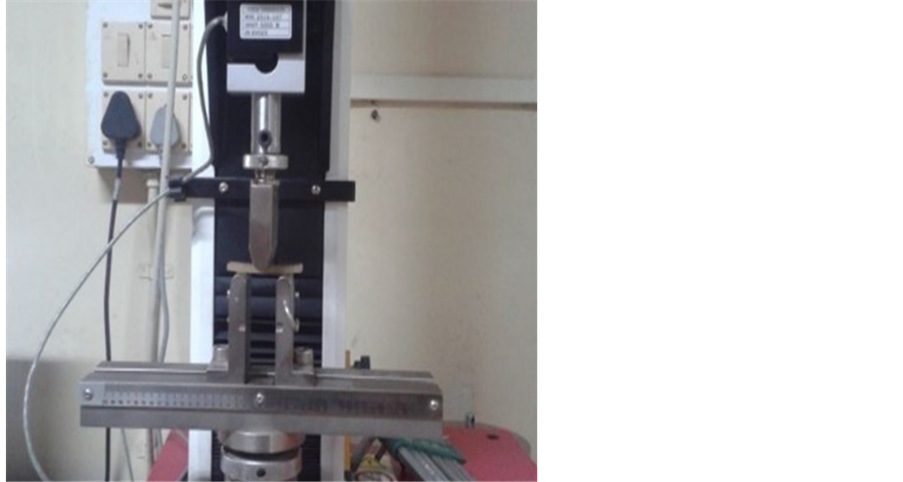
Figure 6. Horizontal shear load diagram and test setup ILSS test.
where, σILSS is the interlaminar shear stress Fmax is the maximum flexural load and t is the thickness of the sample and b is width of specimen.
2.7. Fractography
Scanning Electron Microscopy was used to study the fractured surface of tensile and DCB test specimens to understand the origin of cracking, modes of fracture and various fracture toughening mechanisms.
3. Results and Discussion
3.1. Kinetics of Moisture Absorption
A graph between% moisture absorbed Vs square root of time in hours was plotted and is listed in Figure 7. It was observed that the rate of moisture absorption is more in composite epoxy glass fiber laminates composite containing 10 wt% Fly ash reinforcement as compared to the rate of moisture absorption in epoxy laminate composites containing 5% Fly ash and 0% fly ash reinforcement addition of the particulate fly ash in the matrix and hence with the increase in the wt% of fly ash the moisture uptake rate is seen to be increasing.
It was observed that % moisture uptake with respect to square root of time followed an increasing trend in all the composites. In the present case, micro-defects (e.g. micro cracks and porosity in the matrix) are introduced due to the addition of fly ash reinforcement as shown in Figure 7.
3.2. Effect of Moisture Absorption on Tensile Strength
The tensile test data for both exposed and unexposed (in moisture at 45˚C for 10 and 20 days) samples have been presented in Table 1 for all three composite laminates (with 0%, 5% and 10% fly ash). The test was carried out in both longitudinal and transverse direction of the composite laminates. The stress Vs strain curves of the exposed and unexposed composites were linear until the point of fracture. When the tensile test specimens were exposed to aqueous fog in salt fog Chamber at 45˚C and tensile test conducted, reduction in ultimate tensile strength was observed as shown in Figure 8 for longitudinal direction and Figure 9 for transverse direction, it was observed that the reduction in UTS is following the trend observed in the moisture absorption study. In samples containing 0% fly ash, the reduction in tensile strength was 23% over 20 days. In samples containing 5% and 10% fly ash this reduction was observed to be 26% and 28% respectively. It is clearly evident that, degradation of strength during exposure to moisture depends on fly ash content of the samples. The increased reduction in tensile strength of samples containing fly ash is thought to be related to enhanced moisture absorption kinetics as observed in moisture absorption studies. The moisture absorption by resin matrix leads to plasticization of matrix and weakening of fiber matrix interface. This is due to enhanced micro-defects in the composite specimen with addition of fly ash. Micro-defects generated by addition of fly ash actually help in crack propagation by providing reduced cross section of the composite and stress concentration which lead to early failure of the

Figure 7. Plot of % moisture absorbed Vs square root of time in hours.

Figure 8. Plot on variation in Ultimate Tensile Strength with moisture absorption time (Longitudinal direction).

Figure 9. Plot on variation in Ultimate Tensile Strength with moisture absorption time (Transverse direction).
Time (hrs)
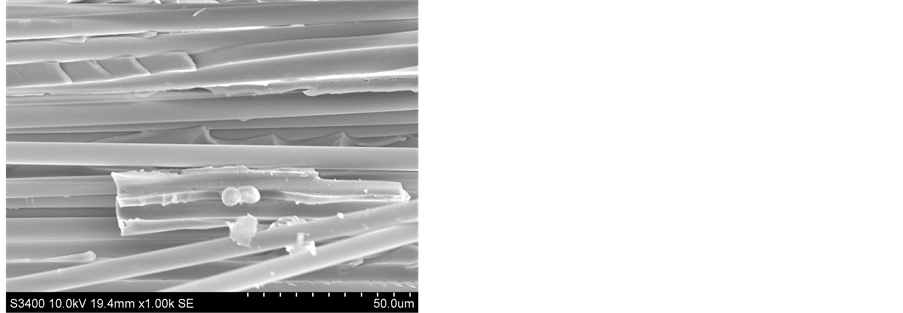
composite. SEM micrographs shown in Figure 10 do not show any damage to fiber themselves. This leads to a conclusion that matrix cracking and fiber/matrix interface cracking are the major failure mechanisms.
3.3. Influence of Environment on Interlaminar Shear Strength (ILSS)
The ILSS of epoxy glass fiber reinforced composite in as received and sample saturated in 3.5% NaCl solution for different durations were carried as per ASTM D2344/ASTM D 2344M. The results of ILSS in unexposed and exposed in 3.5% NaCl for 10 and 20 days are listed in Table 3, Figures 11 and 12.
The ILSS of Epoxy glass fiber laminate composite is 22.61 MPa and that 5% fly ash reinforcement is 27.07 MPa and 10% fly ash is 27.57 MPa. The ILSS of epoxy glass fiber reinforced composite increases with the addition of 5% and 10% fly ash reinforcement. However, when these composites are soaked in 3.5% NaCl for 10 days and 20 days the ILSS value decreases due to plasticization of epoxy matrix. The decrease in the ILSS value in more case of 10% fly ash reinforced sample after saturation in 3.5% NaCl solution for 20 days. This may be
 (a)
(a)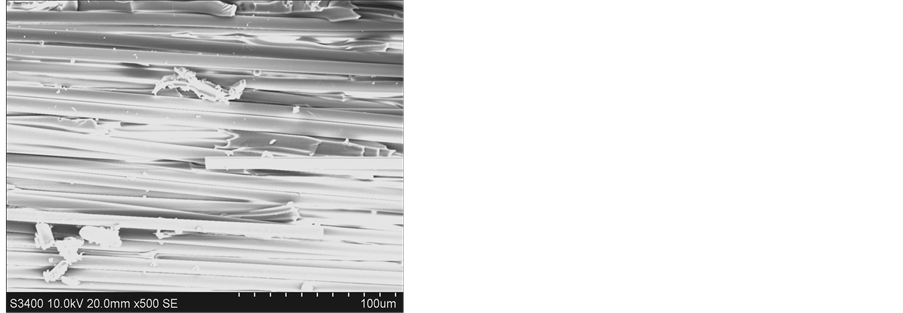 (b)
(b)
Figure 10. SEM micrograph of (a) 0% and (b) 10% Fly Ash added glass/epoxy composite after moisture exposure at 45˚C for 20 days.
Table 3. Comparison of ILSS of differnt composities.
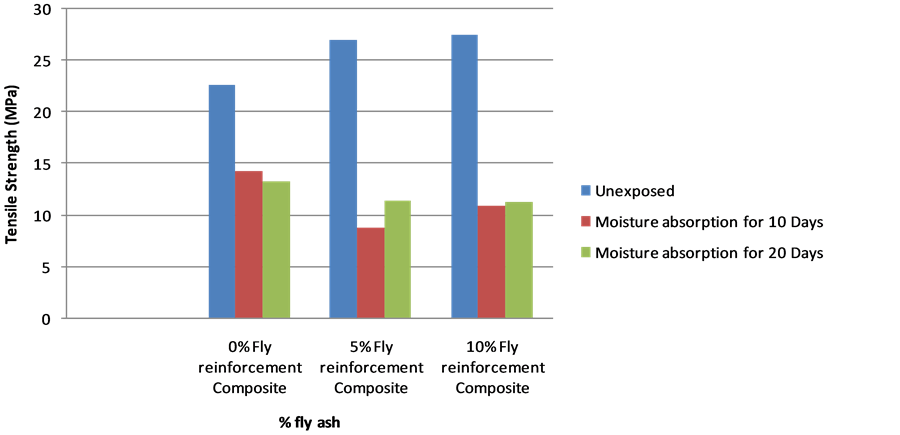
Figure 11. Effect of ILSS on moisture absorption.
due to presence of porosity and voids in the composite laminate samples, which favors transport of NaCl solution to the bulk polymer and it affects the fiber matrix interface.
3.4. Effect of Moisture Absorption on Mode I Interlaminar Fracture Toughness
A typical load Vs displacement curves observed during DCB testing is shown in Figure 13. The non-linearity was observed in the load Vs displacement curves before the maximum load was reached. This could be attributed to two reasons, one being fiber bridging and other due to undulation of the weft yarns as the crack propagated from the end of the non adhesive Teflon insert.

Figure 12. Comparison of ILSS for different composites.
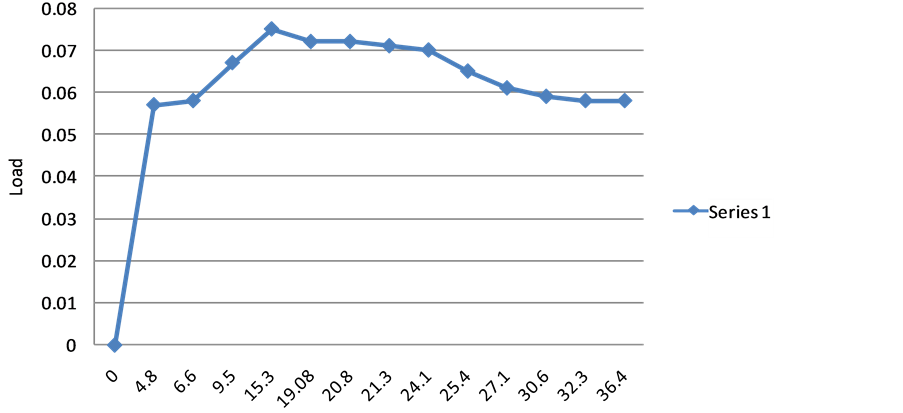
Figure 13. Typical Load Vs displacement curve for 0% fly ash glass fiber reinforced composites in unexposed condition.
The calculation of GIC value was carried out using modified beam theory method and the comparison is made at maximum load point. The different plots of GIC Vs delamination length has been listed in Figure 14 for unexposed epoxy glass fiber laminate composite, Figure 15 for epoxy glass fiber laminate composite exposed for 10 days and Figure 16 for exposed for 20 days. The GIC obtained has been tabulated in Table4
Representative GIC values for the each of the specimen are plotted against Square root of time (hrs1/2) as shown in Figure 17. It has been observed that the GIC values increased with addition of fly ash when the samples were not exposed to moisture.
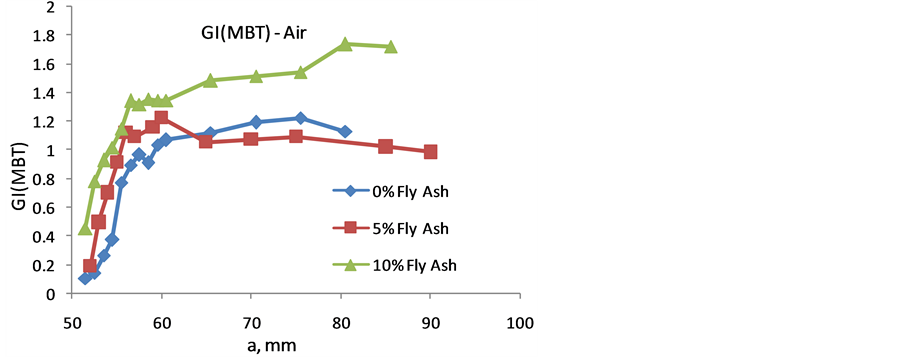
Figure 14. GIC(MBT) Vs “a” after exposure of composite laminate samples in air.
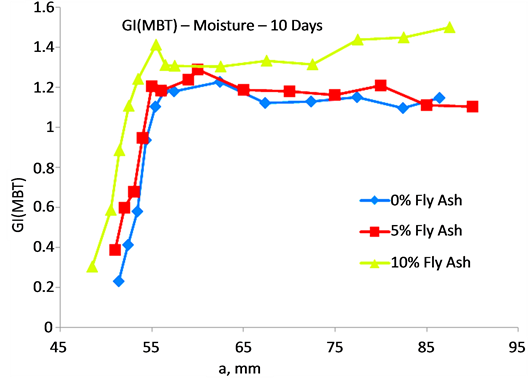
Figure 15. GIC(MBT) Vs “a” after exposure of composite laminate samples in moisture at 45˚C for 10 days.

Figure 16. GIC(MBT) Vs “a” after exposure of composite laminate samples in moisture at 45˚C for 20 days.
Table 4. GIC obtained values of Glass fiber laminate composites.

Figure 17. GIC Vs Square root of time.
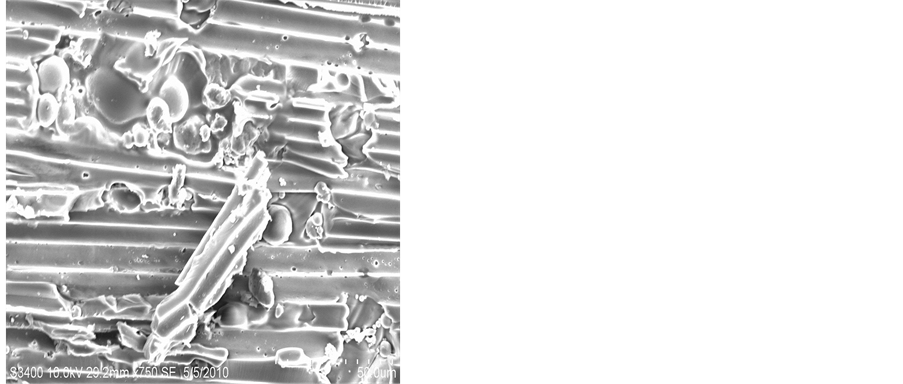
This is because, with the addition of fly ash, various other mechanisms add to the already present toughening mechanism. These are mainly crack pinning, crack bowing, increased surface roughness, increased friction between parting surface, crack tip blunting, and interface debonding out of which crack pinning, crack tip blunting and interface debonding are important for inorganic particles in thermo set resins [10] . The debonding of fly ash/matrix interface can be seen in Figure 18. When the similar samples were exposed to moisture, the GIC value for all the fly ash composite laminate first increased (for moisture exposure up to 10 days) and then decreased with increasing exposures (for 20 Days).
Similar studies carried out by Srivastava and Hogg has reported that the GIC value increases significantly by immersion in water and moisture absorption in case of glass fiber reinforced polyester resin which was attributed to increase in sub-micro cracks and fiber bridging because of increased plasticity of the matrix which has resulted in weakening of fiber-matrix and particle-matrix interfacial strength increase in sub-micro cracks and fiber bridging. But it is worth noting that they have observed that the material followed the Fick’s second law of diffusion through thickness and extent of moisture absorption (maximum 1.2%) was significantly less compared to the present study where moisture absorption up to 1.78% for 528 hrs of exposure has been observed. In case of epoxy-fly ash/glass reinforced composite, the material is assumed to be following Langmuir’s law as explained earlier. It has been observed that moisture absorption is higher in the case of samples following Langmuir’s kinetics which may result in higher degree of plasticization of the matrix. It has been shown that the moisture doesn’t affect the fibers as shown in Figure 10 but it weakens the fiber/matrix interface. Interlaminar fracture toughness (GIC) which is a measure of resistance of crack growth is energy intensive. Thus incase of exposure for 10 days the, the higher GIC has been attributed to plsiticization of the resin matrix which has resulted in increased matrix cracking and fiber/matrix interface cracking. When the samples were exposed to 20 days, severe plasticization of the resin matrix occurred which was evident in increased featureless matrix cracking and interplay fracture as shown in Figures 19 and 20.
As these fracture surfaces are featureless, no fiber/matrix interface cracking is observed as shown in Figures 21 and 22. This might have resulted in lowering the GIC value after 20 days of exposure.
4. Conclusion
Moisture uptake in the fly ash/glass fiber reinforced epoxy composites was higher than the glass fiber-epoxy
 (a)
(a)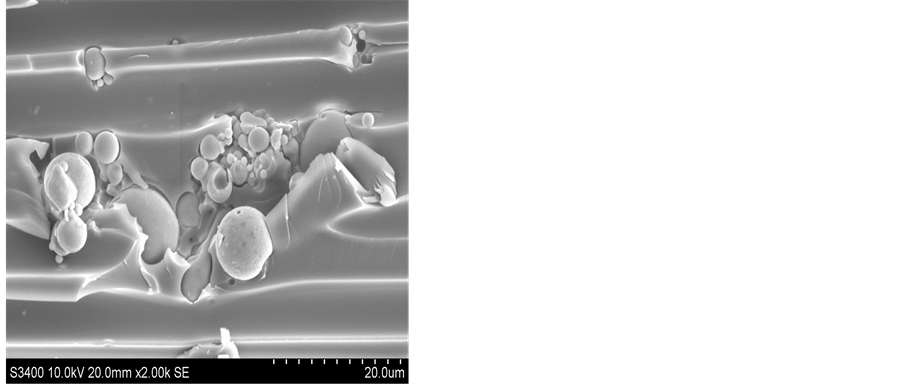 (b)
(b)
Figure 18. SEM micrograph of (a) 5% and (b) 10% fly ash epoxy glass fiber laminate composite.
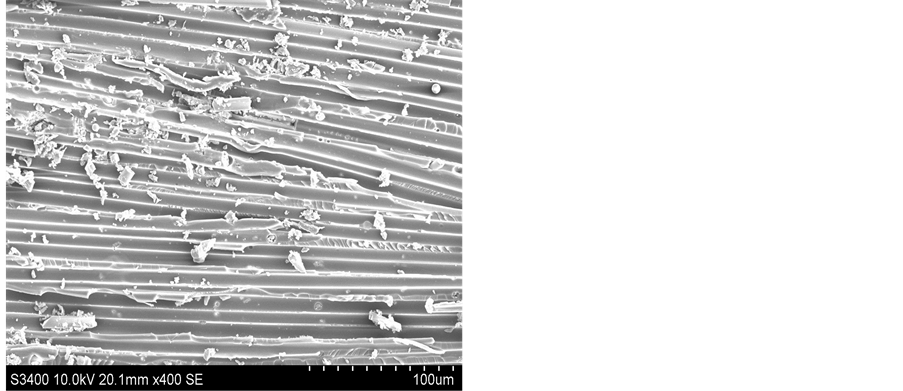
Figure 19. SEM micrograph of 10% fly ash epoxy laminate composite.

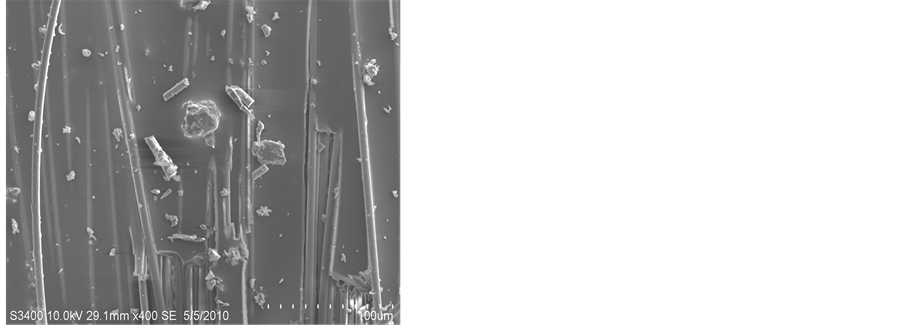
Figure 20. SEM fractograph of 0% Fly Ash composite laminate after exposure to moisture at 45˚C for 20 Days.
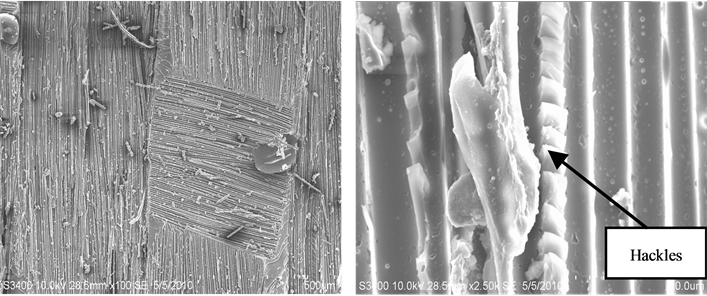
Figure 21. SEM fractograph of 0% fly ash epoxy laminate composite showing resin rich region.
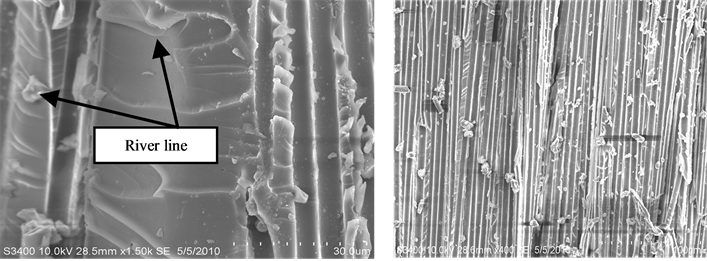
Figure 22. SEM fractogrpah of epoxy laminate composite showing river marking lines.
composite and it didn’t show any saturation. Attaining saturation or steady state is typically observed in Fick’s Law. This led to an assumption that moisture absorption in fly ash/glass fiber reinforced epoxy composites might be following Langmuir’s Model of moisture absorption. Tensile strength of the fly ash/glass fiber reinforced-epoxy composite was lower than that of glass fiber-epoxy composites. This was expected because addition of fly ash increased micro defects/micro cracks and reduced load bearing cross section of the composites. When the samples were exposed to aqueous fog, the UTS decreased further due to weakening of fiber/matrix interface. The effect was more pronounced in case of 10% fly ash added composite laminates. Interlaminar fracture toughness (GIC) which is energy intensive, increased with fly ash content in unexposed condition. After 10 days exposure, plasticization of resin matrix and weakening of fiber/matrix interface has resulted in increased matrix and interface cracking causing increase in GIC values. When the samples were exposed to 20 days, increased featureless fracture of matrix and interplay fracture were noticed which had been attributed to severe plasticization of resin matrix resulting in lower load bearing capability of fiber/matrix interface and decreased GIC values.
References
- Srivastava, V.K. and Hogg, P.J. (1998) Moisture Effects on the Toughness, Mode-I and Mode-II of Particles Filled Quasi-Isotropic Glass-Fiber Reinforced Polyester Resin Composites. Journal of Materials Science, 33, 1129-1136. http://dx.doi.org/10.1023/A:1004305104964
- Fu, S.-Y. and Lauke, B. (1998) Characterisation of Tensile Behaviour of Hybrid Short Glass Fibre/Calcite Particle/ ABS Composites. Composites Part A, 29A, 575-583.
- Lauke, B. (2008) On the Effect of Particle Size on Fracture Toughness of Polymer Composites. Composite Science and Technology, 68, 3365-3372. http://dx.doi.org/10.1016/j.compscitech.2008.09.011
- Lee, J. and Yee, A.F. (2000) Fracture of Glass Bead/Epoxy Composites: On Micro-Mechanical Deformations. Polymer, 41, 8363-8373. http://dx.doi.org/10.1016/S0032-3861(00)00187-7
- Suri, C. and Perreux, D. (1995) The Effects of Mechanical Damage in a Glass Fiber/Epoxy Composite on the Absorption Rate. Composite Engineering, 5, 415-424. http://dx.doi.org/10.1016/0961-9526(94)00014-Z
- Browning, C.E., Husman, G.E. and Whitney, J.M. (1977) Moisture Effects in Epoxy Matrix Composites. ASTM STP, 617, 481-496.
- Ray, B.C. (2006) Temperature Effect during Humid Ageing on Interfaces of Glass and Carbon Fibers Reinforced Epoxy Composites. Journal of Colloid and Interface Science, 298, 111-117. http://dx.doi.org/10.1016/j.jcis.2005.12.023
- ASTM D 638-03 (2005) Standard Test Method for Tensile Properties of Plastics. ASTM Standards, 8.
- ASTM D 5528-01 (2005) Standard Test Method for Mode-I Interlaminar Fracture Toughness of Unidirectional Fiber Reinforced Polymer Matrix Composite. ASTM Standards, 15.
- Rothon, R.N. (2003) Particulate Filled Polymer Composites. 2nd Edition, Rapra Technology Limited, UK.