Materials Sciences and Applications
Vol.4 No.5(2013), Article ID:31475,6 pages DOI:10.4236/msa.2013.45042
Band Gap Determination from Diffuse Reflectance Measurements of Irradiated Lead Borate Glass System Doped with TiO2 by Using Diffuse Reflectance Technique
![]()
National Center for Radiation Research and Technology, Atomic Energy Authority, Cairo, Egypt.
Email: anter_protect@yahoo.com, seif_dose@hotmail.com
Copyright © 2013 Saif Ebraheem, Antar El-Saied. This is an open access article distributed under the Creative Commons Attribution License, which permits unrestricted use, distribution, and reproduction in any medium, provided the original work is properly cited.
Received March 11th, 2013; revised April 12th, 2013; accepted April 26th, 2013
Keywords: Diffuse Reflectance Accessory; Optical Gap; Borate-Lead-Titanium-Glasses Gamma Radiation
ABSTRACT
Ultraviolet-visible UV-Vis diffuse reflectance measurements of irradiated lithium tetra-borate glass have been acquired using. Evolution 600 Spectrophotometer equipped with praying Mantis Diffuse Reflectance Accessory DRA base upon the onset of the diffuse reflectance spectra of the powdered or bulk materials. Also the absorption edge and band gap energies of the prepared glass were determined. The optical energy gap is calculated and found to be (3.0 - 3.5) eV. Which is in close agreement to the one calculated for r = 1/2, i.e. the transition mechanism, is accordingly direct allowed transition. The density increases from 3.1 to 3.9 gm/cm3 for the undoped and doped glass.
1. Introduction
Measurement of diffuse reflectance with UV-visible spectrophotometer is a standard technique in the determination of the absorption properties of materials. In the case of semiconductors for water splitting, the properties that can potentially be estimated from the diffuse reflectance, are the band-gap energy and the absorption coefficient. Determination of the band gap from the measurement of the diffuse reflectance of a powder sample is a standard technique [1,2]. The powder sample has to be sufficiently thick that all incident light is absorbed or scattered before reaching the back surface of the sample; typically a thickness of 1 - 3 mm is required. It may also be reasonable to apply this method to coatings that are sufficiently thick to absorb or scatter the entire incident light.Titanium dioxide (TiO2) has been used previously for the production of bioactive and biocompatible phosphate-based glasses. TiO2 acts as a nucleating agent, and although it is miscible in the molten glass, it induces phase separation during cooling of the melt. It was observed that the addition of 0.5 mol% TiO2 enhanced the bioactivity which started to decrease upon further increase of the TiO2 content [3]. Glass materials are one of the possible alternatives to concrete because they can be transparent to visible light and their properties can be modified by composition and preparation techniques. Boric oxide, B2O3, acts as one of the most important glass formers and flux materials. Melts with compositions rich in B2O3 exhibit rather high viscosity and tend to be the formation of glasses. In crystalline form, on the other hand, borates with various compositions are of exceptional importance due to their interesting linear and nonlinear optical properties. The boron atom usually coordinates with either three or four oxygen atoms forming [BO3]3 or [BO4]5 structural units. Furthermore, these two fundamental units can be arbitrarily combined to form different BxOy structural groups [4]. Good reviews on radiation shielding borate glass development have been published recently by several authors [5-8]. These results show that the borate glass can be used in radiation shielding materials.
The purpose of this paper is to demonstrate a method by which the band gap can be derived from measurements of diffuse reflectance. To this end, measurements of the diffuse reflectance of different titanium concentration are reported. The measurements are first used to check the calculated dependence of the diffuse reflectance on titanium concentration, after that studying the effect of gamma radiation on the prepared glass.
2. Experimental
The glass samples of the formula 70Li2B4O7-30Pb3O4 dopped with different concentration of TiO2 where 0.1, 0.2 and 0.3 mol% have been prepared by the melt quenching technique. The mixture is melted in porcelain crucible at about 1100 K for about 60 min to homogenize the melt. The melt was quickly quenched by pouring on to a stainless steel plate and covering with another stainless steel plate and the random pieces of samples thus formed were collected. Density at room temperature was measured by following Archimedes principle using a sensitive single pan balance. The carbon tetrachloride, CCl4 (density = 1.595 m/cc) was used as an immersion liquid. Irradiations were carried out with gamma radiation in the 60Co gamma chamber 4000 A for the dose rates 1.23 Gy/sec. The absorption spectra of the unirradiated and irradiated were measured through the wavelength range (200 - 900) using Evolution 600 EV-600 (located at NCRRT, EGYPT), ultraviolet/visible, spectrophotometer wavelength ranged from 200 - 900 nm is used for scanning the absorption spectra and measuring the optical density at λmax of the prepared glass.
3. Results and Discussion
3.1. Density, Molar Volume
The value of density and molar volume of the prepared glasses are shown on Figures 1 and 2 illustrate the density of 70Li2B4O7-30Pb3O4 doped with different concentration of TiO2. The density increase from 3.1 to 3.9 gm/cm3 for the undoped and doped glass and the decrease of molar volume is expected result due to the highly molecular weight of TiO2. It is observed that, for unirradiated samples, the addition of TiO2 to the prepared glass leads to the increase of the number of ions in the system which decreases the inter-ionic distance or due to the formation of Pb-O covalent bond in ternary lead
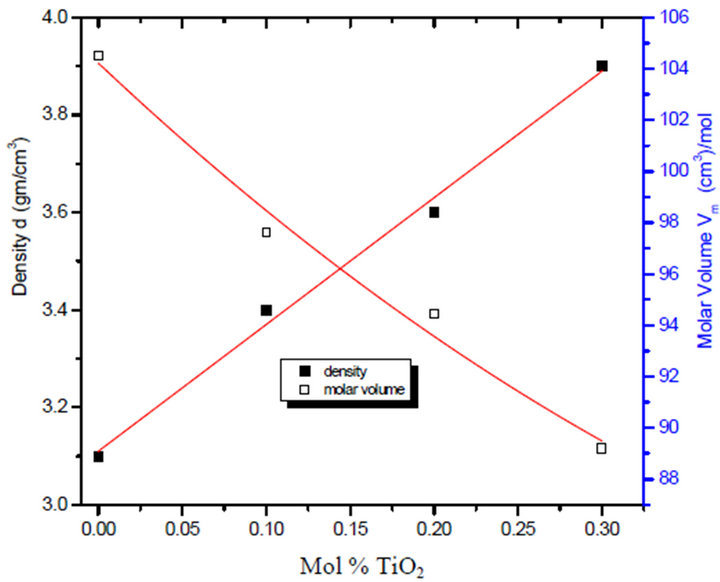
Figure 1. Variation of density and molar volume with TiO2% uirradiaded for the glass system LTbPTiO2.
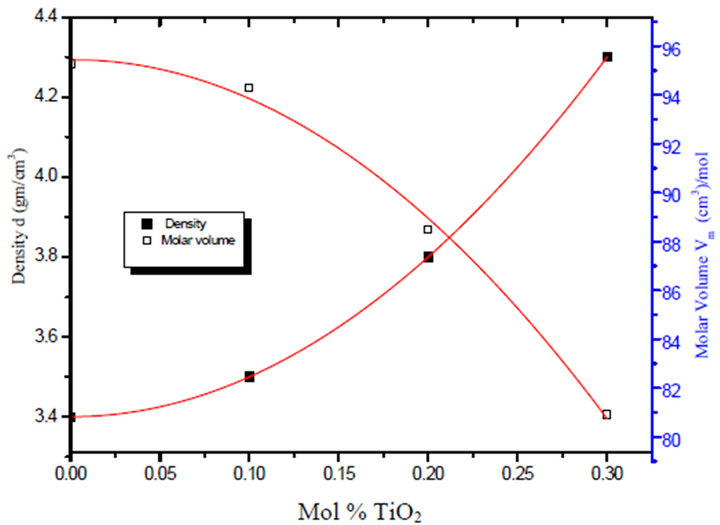
Figure 2. Variation of density and molar volume with TiO2% irradiaded with 3 Mrad gamma dose for the glass system LTbPTiO2.
lithium borate glass which leads to close the structure of the glasses. As a result, the molar volume of LTbPTiO2 decreased and consequently its density increased in the range of 25% ± 1% for each molar volume and density as shown in Figure 1, this means that TiO2 can be considered as an indication of an increase in the number of the non-bridging oxygen associated with a structure contraction.
3.2. Effect of Irradiation
Irradiation with gamma rays are assumed to create displacements, electronic defects and/or breaks in the network bonds, which allow the structure to relax and fill the relatively large interstices that exist in the intercomnected network of boron and oxygen atoms causing a compaction of the volume [9].
Shelby [10] suggested that the boron-oxygen bond is more likely to be affected by irradiation. Damage by an irradiation species can cause the compaction of B2O3 by the breaking of the bonds between triagonal elements, allowing the formation of different ring configurations. This result is in agreement with the results obtained by El-Batal et al. [11] where they found that nuclear irradiation is believed to cause noticeable structural changes.
4. Band Gap Determination
4.1. Rule of the Band Gap and Band Tail
Figures 3 and 4 show the reflectance (R) and transmittance (T), which are measured at room temperature at normal incident as a function of wavelength in the spectral range from 200 nm up to 900 nm for the LTbPTiO2 glass system. The optical absorption coefficient, α, which is the relative rate of decrease in light intensity along its path of propagation, was calculated from the transmit
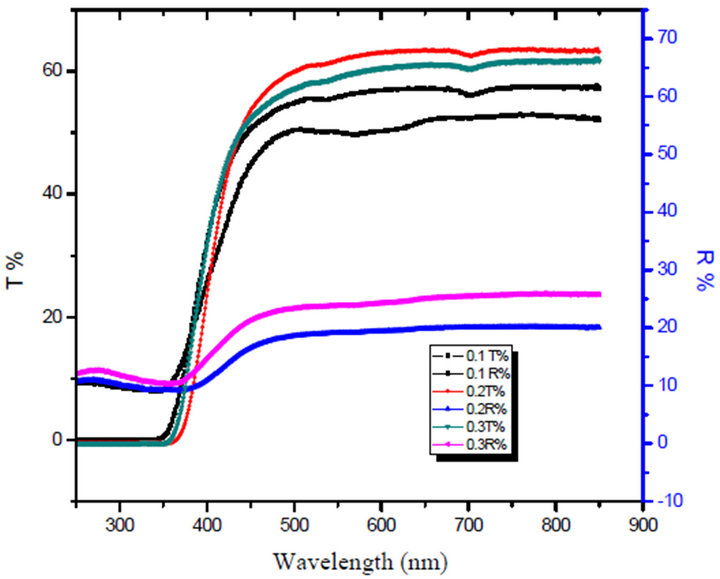
Figure 3. The transmitance T% and the Reflectance R% of unirradiated LTbPTiO2 with different concentration of TiO2.

Figure 4. The transmitance T% and the Reflectance R% of 3 Mrad gamma irradiated LTbPTiO2 with different concentration of TiO2.
tance and reflectance data in the wavelength range 200 - 900 nm. The nature of the optically induced transitions was determined from these data [12].
 (1)
(1)
where T is the transmittance, R is the reflectance, and d is the sample thickness. The optical absorption coefficient of glass system near the fundamental absorption edge was found to be exponentially dependent on the photon energy. The exponential dependence of the optical absorption coefficient may arise from the electronic transitions between the localized states, which have tailed off in the band gap.
To obtain the optical gap Eop for the investigated glass Equation (2) will be used, [13] but, which value of “r” must be applied to have the exact value of the optical band gap? Accordingly we may say that it is not adequate alone to be used for the determination of both the type of conduction and the optical gap; it is necessary but not sufficient [14]. Different value of “r” was applied to the experimental data as present in Tables 1 and 2.
 (2)
(2)
where B is a constant, r is an index, which assumes the values 1/2, 3/2, 2 or 3, depending on the nature of the electronic transition responsible for absorption mechanism of electron transition. The exponent r = 1/2, 3/2 for direct transition is allowed or forbidden in the quantum mechanical sense, and r = 2, 3 for allowed and forbidden indirect transition, respectively [15].
The optical gap Eop for each samples obtained from Equation (2) will be used, but, which value of “r” must be applied to have the exact value of the optical band gap, different values of “r” was applied to the present experimental data for glass system LTbPTiO2, It is found that the obtained optical gap changes with changing the value of the exponent “r” as shown in Tables 1 and 2.
On the other hand, Figure 5 shows the variation of lnα with incident photon energy hv for the glass system LTbPTiO2, as was found to be linear in the absorption region near the fundamental absorption edge. The absorption edge is found to be exponentially dependent on the incident photon energy and obeys the empirical Urbach rule Equation (3) [15,16]. The width of the localized states Ee (band tail energy or Urbach energy) estimated from the inverse slopes of lnα versus hv.
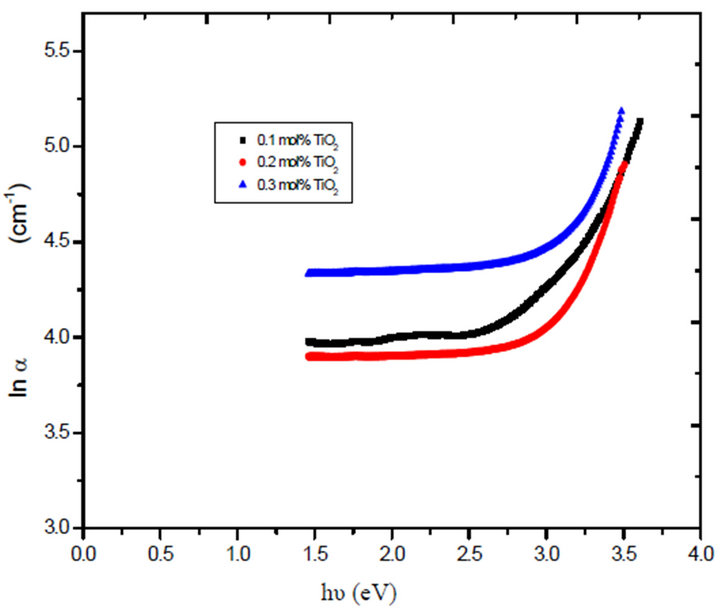
Figure 5. The relation between absorption coefficient lnα and energy hυ for the prepared glass system.

Table 1. The obtained values of optical gap at different values of the exponent (r) for Unirradiated LTbPTiO2 system.

Table 2. The obtained values of optical gap at different values of the exponent (r) for 3 Mrad gamma irradiation of LTbPTiO2 system.
 (3)
(3)
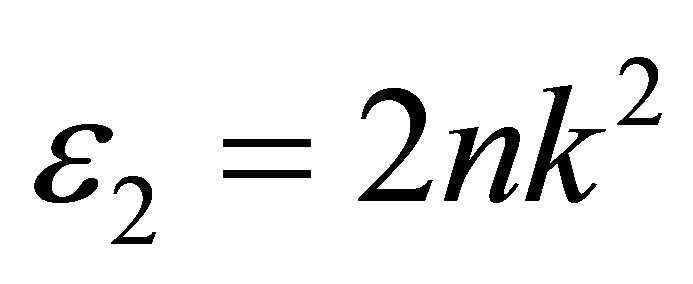
Tables 1 and 2 show that, the obtained values of the optical gap have changed according to the value of the exponent “r”. This is together with that the change in the value of Regression coefficient does not give good indication of which is the real value of “r” which can be selected. So, Equation (2) may be used only for determination the type of conduction mechanism and the optical gap itself should be determined using another parameter, by which the exact value of exponent can be selected. The selected parameter is the imaginary part of the dielectric constant ε2, which is a function of refractive index n, and extinction coefficient k;
 (4)
(4)
Figure 6 shows the relation between (α hv)2 versus (hv) plot according to Equation (2). The direct optical energy gap can be obtained from the intercept of the resulting straight lines with the energy axis at (α hv)2 = 0. Plotting the imaginary part ε2 versus the photon energy as shown in Figure 7, the optical energy gap obtained and found to be 3.0 - 3.3 eV.
Comparing the optical band gap which obtained from Figure 5 and that’s from Figure 7 and the data in both Tables 1 and 2, we can see the energy gap is close agreement to the one calculated for r = 1/2, i.e. the transition mechanism is accordingly direct allowed transition.
4.2. Effect of Radiation
The optical band gap Eopt in Urbach region Figures 8 and

Figure 6. The relation between energy hυ eV and (αE)2 for unirradiated glass (R: is the reability of fitting, best fitting R = ±1).
9 of the glasses can be obtained according to its dependence on absorption coefficient á and the energy hµ of the incident photon [15]. After irradiation, the defect centers formed by charge trapping of the radiolytic electrons or holes often have electronic states in the gap between the valence and conduction bands. So, optical photons may induce transition between the valence band and the defect levels or from the defect levels to excited states or the conduction band. Figure 8 shows the band gap has decreased, and the width of the energy tail has increased after irradiation. These changes can be explained by an

Figure 7. The relation between Optical dielectric constant ε2 and phonon energy for irradiated LTBPTiO2 system.
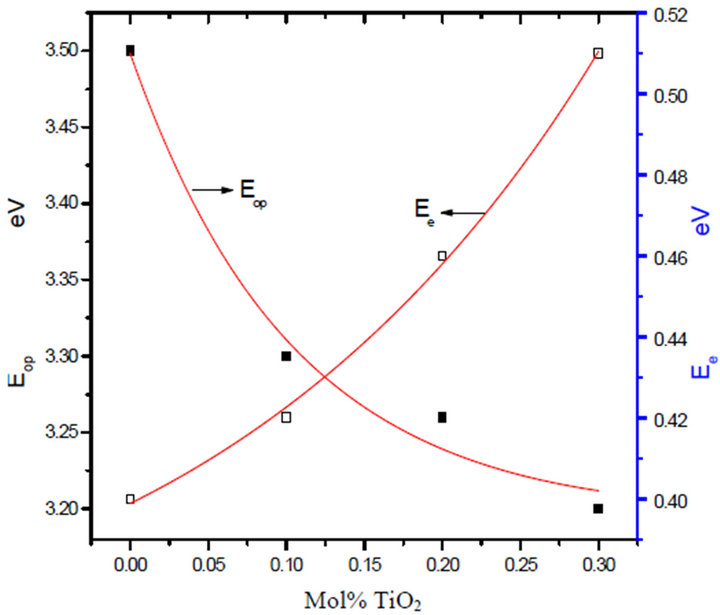
Figure 8. Variation of optical band gap Eop and band tail Ee with TiO2 mol% for unirradiated glass system LTbPTiO2.
increased electronic density after gamma irradiation. The interaction of gamma rays with materials is dominated by the Compton Effect, the cross section of which is proportional to the atomic number. Hence, there are an increasing number of energetic electrons in the glass network with increasing TiO2 content. This electronic ionization will increase the electronic transitions between localized states, so that the band gap decreases and the width of the energy tail increases after irradiation.
5. Conclusion
Titanium oxide is used in the composition of some glasses in order to achieve and tailoring all together a certain optical glass features. Density and band tail results show an increase with increasing gamma radiation doses. The molar volume and the optical gap show opposite trend.

Figure 9. Variation of optical band gap Eop and band tail Ee with TiO2 mol% for 3 Mrad gamma irradiation for the glass system LTbPTiO2.
The addition of titanium to the glass makes it sensitive to radiation on the other hand titanium dioxide glass can be used as electrolytes where it has high conductivity.
REFERENCES
- B. Arvaly, I. Hevesi and Z. Naturforsch, “Diffuse ReflecTance Spectra of Vanadium Pentoxide Powder,” The Journal of Physical and Chemistry, Vol. 26, No. 11, 1971. pp. 245-249.
- W. Wendlandt and H. G. Hecht, “Reflectance Spectroscopy,” Wiley Interscience, New York, 1966.
- G. Fuxi, “Optical and Spectroscopic Properties of Glasses,” Springer-Verlag, Berlin, 1992.
- O. Isabella, H. Hartmut and B. Klaus, “Optical Properties of Bismuth Borate Glasses,” Optical materials Journal, Vol. 26, No. 3, 2004, pp. 235-237.
- N. Singh, K. J. Singh, K. Sigh and H. Singh, “GammaRay Attenuation Studies of PbO-BaO-B2O3 Glass System,” Radiation Measurements, Vol. 41, No. 1, 2006, pp. 84-87. doi:10.1016/j.radmeas.2004.09.009
- N. Singh, K. J. Singh, K. Singh and H. Singh, “Comparative Study of Lead Borate and Bismuth Lead Borate Glass System as Gamma-Radiation Shielding Materials,” Nuclear Instruments and Methods in Physics, Vol. 225, No. 3, 2004, pp. 305-309.
- K. Singh, H. Singh, V. Sharma, R. Nathuram, A. Khanna, R. Kumar, S. Bhatti and H. Sahota, “Gammaray AttenuaTion Coefficient in Bismuth Borate Borate Glasses,” Nuclear Instruments and Methods in Physics, Vol. 194, 2002, pp. 1-6.
- J. Kaewkhao, J. Laopaiboon and W. Chewpraditkul, “ Determination of Effective Atomic Numbers and Effective Electron Densities for Cu/Zn Alloy,” Journal of Quantum Mechanics and Radiative Transfer, Vol. 109, No. 7, 2008, pp. 1260-1264.
- W. Primak, “Induced Stress Relaxation in Quartz and Vitreous Silica,” Journal of Applied Physics, Vol. 35, No. 4, 1964, pp. 1342-1349. doi:10.1063/1.1713616
- J. Shelpy, J. Vitko and G. Pantano, “Weathering of Glasses for Solar Applications,” Solar Energy Materials, Vol. 3, No. 1-2, 1980, pp. 97-112.
- H. A. El-Batal and F. M. Ezz-Eldin, “Interaction of Υ- Rays with Some Alkali-Alkaline-Earth Borate Glasses Containing Chromium,” Jornal of American Ceramics Society, Vol. 76, No. 2, 1993, pp. 523-529. doi:10.1111/j.1151-2916.1993.tb03817.x
- K. L. Chopra, “Thin Film Phenomena,” McGraw-Hill Book Company, New York, 1969.
- J. Tauc, “Amorphous and Liquid Semiconductors,” Plenum Press, London and New York, 1974. doi:10.1007/978-1-4615-8705-7
- A. Monem, H. ElBatal, E. Khalil, M. Azooz and Y. Hamdy, “In Vivo Behavior of Bioactive Phosphate Glass— Ceramics from the System P2O5-Na2O-CaO containing TiO2,” Journal of Material Science: Materials in Medicine, Vol. 19, No. 3, 2008, pp. 1097-1108. doi:10.1007/s10856-007-3044-3
- F. Urbach, “The Long-Wavelength Edge of Photographic Sensitivity and of the Electronic Absorption of Solids,” Journal of Physical Review, Vol. 92, No. 5, 1953, pp. 627-636.
- M. Ojovan and M. Lee, “Glassy Wasteform for Nuclear Waste Immobilization,” Journal of Nuclear Materials, Vol. 335, No. 3, 2004, pp 425-432. doi:10.1016/j.jnucmat.2004.07.050

