Materials Sciences and Applications
Vol.3 No.7(2012), Article ID:21162,7 pages DOI:10.4236/msa.2012.37068
Synthesis and Characterization of Mesoporous Aluminosilicates for Copper Removal from Aqueous Medium
![]()
1School of Chemical Engineering and Analytical Sciences, University of Manchester, Manchester, UK; 2División de Ciencias Naturales y Exactas, University of Guanajuato, Guanajuato, Mexico.
Email: david.deharodelrio@postgrad.manchester.ac.uk
Received March 23rd, 2012; revised May 2nd, 2012; accepted June 1st, 2012
Keywords: Mesoporous Aluminosilicates; Surface Properties; Copper Adsorption
ABSTRACT
In this study the characterization of an aluminosilicate synthesized from commercial Al2(SO4)3 and colloidal SiO2 is presented, as well as its capacity for the removal of copper from aqueous solution. Characterization of the synthesized material was performed using X-ray diffraction, BET nitrogen adsorption-desorption, mass titration and the Boehm method. In order to obtain stable agglomeration and enhance its surface area (165 - 243 m2/g) and solid adsorbing capabilities, the molar ratio SiO2:Al2O3 (1:3, 1:1 and 3:1) was studied, the solubility of the preparation material, synthesis-procedure time and solution pH function were also examined. The maximum capacity to remove copper ions from an aqueous solution by synthesized aluminosilicate was 16 mg/g at pH 4 and 25˚C. The Langmuir model fitted better to the copper adsorption experimental data.
1. Introduction
The disposal of waste materials for a number of Industries is an issue which has attracted special attention due to the importance that this concern has from the standpoint of: both reutilization of available resources and environmental protection [1,2]. Public awareness has raised concerns about water pollution generated by industries, which has led to legislation on waste control, becoming more demanding, introducing ever more restrictive rules on the permitted content of toxic compounds or hazardous industrial discharges [3-5]. The dilemma posed by the public health protection against the progress, is the requirement calling for the incorporation of economically viable technologies to be implemented quickly as possible [6-8].
Mining solid wastes and acid liquid mine drainage have contributed significantly to pollution with dissolved copper going to industry effluent streams in the Bajío Mexican region (Guanajuato, Mexico) which is renowned as a mining zone and consequently has been facing this problem for a long period of time [9,10]. Other industrial sources are: fertilizer chemicals, refining petroleum products, paints and pigments production, steelworks, foundries, electroplating etc [11-13]. It is known; copper is an essential element for life, but acute doses cause disorders in the human metabolism. The average concentration of copper in rivers and lakes is 0.01 ppm while in groundwater is around 0.005 ppm [14]. Nevertheless, in some cases levels up to 2.7 ppm have been measured in groundwater. The USEPA1 standard for drinking water is 1.3 ppm [15]. Copper poisoning causes stomach and intestinal distress, kidney damage, hemolytic anemia, neurological abnormalities and corneal opacity [16]. For that reason, the industry traditionally have used chemical and electrochemical methods to precipitate and reduce metals [17-25]; however, some of those are expensive and/or lead to other problems such as large quantities of waste solids [26]. Research and development of processes for metals removal of wastewater from industries, through the use of adsorbents, aims to address specific issues raised in relation to water pollution and its treatment costs.
The adsorption process of metals in aqueous solutions is one of the most efficient and economical techniques for contaminant removal, particularly if it uses a low cost adsorbent. Mesoporous materials2 are attractive for adsorptive processes due their potential for isomorphous substitutions and ease of access to the pores relative to micropores. It has been reported that this type of porosity facilitates more efficient mass transfer inside the pores and at same time makes more effective the process of heavy metals removal [27]. Furthermore, they can be reused with the implementation of an efficient desorption and regeneration process [28].
In this work is presented an alternative to commercial aluminosilicates and natural clays at low cost is presented. These materials always have been attractive in adsorption field, but they have been currently used as powders having some notorious drawbacks when utilized in packed columns, due to the high pressure drop that they cause. Furthermore, aluminosilicates pellets have shown to be more efficient inside applications in continuous processes. Therefore, this work was focussed on the synthesis of aluminosilicates with low-cost precursors in alkaline media varying the SiO2/Al2O3 molar ratio. Also, several characterization methods to identify their crystallographic and surface features were carried out. In addition, the agglomerated pellets have been used to remove effectively copper ions (Cu2+) from aqueous solution and; finally, to add sustainable to this process, three different copper desorption treatments were performed.
2. Methodology
2.1. Synthesis of Mesoporous Aluminosilicates
The synthesis of aluminosilicates was based on the methodology previously reported by González Figueroa [29]. The of Al2(SO4)3, is dissolved in distilled water with a ratio of 12 ml for 1 g of aluminium sulphate (Prosi PSV Chemicals, technical), the solution is maintained in a glass vessel with magnetic agitation, while increasing the temperature by heating up to 80˚C under vacuum. The final solution pH value is approximately 2. After that step, a three neck round bottle flask is utilized to simultaneously: 1) add Al2(SO4)3 dropwise, 2) add colloidal SiO2 (30 wt% suspension in H2O, Aldrich) dropwise, and finally, 3) inject the hydrolyzing agent, ammonia gas (anhydrous, Refriamonia). The reactant amount depends on the required molar ratio (1-3). The reaction is carried out until all reagents are depleted, the pH is measured again, and it should show a value of 10 - 12. The precipitated solid was filtered and was washed with a solution of ammonia-water (10%) followed by 1 L of hot water (90˚C), additionally cold water is needed to ensure that no sulphates compounds remain in the solid, (a test is performed with barium chloride, BaCl2). The wet cake is dried at room temperature overnight and subsequently goes to the oven for a period of time of 24 h at 110˚C. Finally, the collected dry material is ground and meshed in a Tyler sieve (0.6 - 0.7 mm). In parallel, some dried material was mixed vigorously with a dilute nitric acid solution to form a suspension, which was dripped into a glass column containing two phases: an upper liquid zone 10 cm high of an organic phase which is composed of hexane (99.8%, J.T. Baker) and a 60 cm lower liquid zone of a ammonium hydroxide solution (30%, Karal) with the purpose of shaping spherical agglomerates (pellets).
2.2. Characterization of Aluminosilicates
2.2.1. Structural and Textural Properties
X-ray diffraction (XRD) patterns were obtained for each of materials synthesized at different molar ratios to determine the material structure. The XRD patterns were obtained with a Diffractometer INEL model Equinox System Cu/λ = 1.54 Ǻ, with 30 kV and 20 mA. The textural characterization (surface area, pore volume and pore diameter) was performed using the technique of SBET. To the latter case, a physisorption analyzer Micromeritics model ASAP 2010 was used.
2.2.2. Surface Acidity Determination
The active sites of the aluminosilicate were determined by Böehm titration method [30,31]. The total acid and basic sites were neutralized with 0.1 M NaOH and 0.1 M HCl, respectively. The determination of the active sites was performed by adding 1 g of material to each of the polypropylene tubes, which contained 50 ml of neutralizing solution. The tubes were partially submerged in a bath at constant temperature (25˚C) for 5 days until equilibrium was reached, during this period, the tubes were agitated in laboratory vertical agitation equipment. Then a sample of 10 ml from each tube was taken and was titrated with 0.1 M solutions of HCl or NaOH, as appropriate.
2.2.3. Point of Zero Charge Determination
Sample of 1 g of aluminosilicate was poured into 50 ml polypropylene tubes with 10 ml of 0.1 M NaCl. The container was covered and left for 48 h in magnetic agitation. After this time, the solution’s pH is measured and the final pH was plotted against the mass of activated alumina.
2.3. Aluminium Solubility Determination
Aluminum (Al3+) in solution was measured after contact with deionized water at different pH values. Addition of 4 ml of water to a sample of 0.02 g of the material was performed, at different pH values (1-6), the setup was then left under magnetic agitation for 1, 2, 3, 4, and 24 h respectively, after that period of time, the sample was centrifuged and the Al3+ concentration was measured in the supernatant volume with the Inducted Coupled Plasma Optical Emission Spectrometry (ICP-OES) model PerkinElmer Optima 4300 DV equipment.
2.4. Adsorption
2.4.1. Kinetics
Samples of 0.02 grams of the synthesized material (SiO2: 3Al2O3) were in contact with 4 ml of 100 ppm copper solution in continuous agitation for 5, 10, 15, 20, 30 and 60 min, respectively; afterwards samples were centrifuged and copper (Cu2+) concentration was measured in the supernatant with the ICP-OES equipment.
2.4.2. Isotherms
The adsorption isotherms were obtained in batch studies that were carried out subjecting a sample (0.02 g) to mechanical shaking for a period of 30 min at 25˚C and 35˚C respectively. Volume utilized was 4 ml of Cu2+ solution, the different concentrations used were 1, 20, 40, 60 and 100 ppm, at pH 4 (pH for better copper adsorption). For each tube the material was separated using a centrifugation step (6000 rpm) for over 5 min. Copper concentrations in the supernatant were determined with the ICPOES equipment. All assays were carried out three times and the mean values are plotted
3. Results and Discussion
3.1. Aluminosilicates Structural and Textural Properties
Figure 1 shows the XRD patterns of the powders obtained by the hydrolysis-precipitation reaction. Characteristic peaks of SiO2 at 23˚ and γ-Al2O3 peak at around 43˚ and 64˚. The large peak in Figure 1 at ~3˚ demonstrates the mesoporous nature of the structure. Also, it
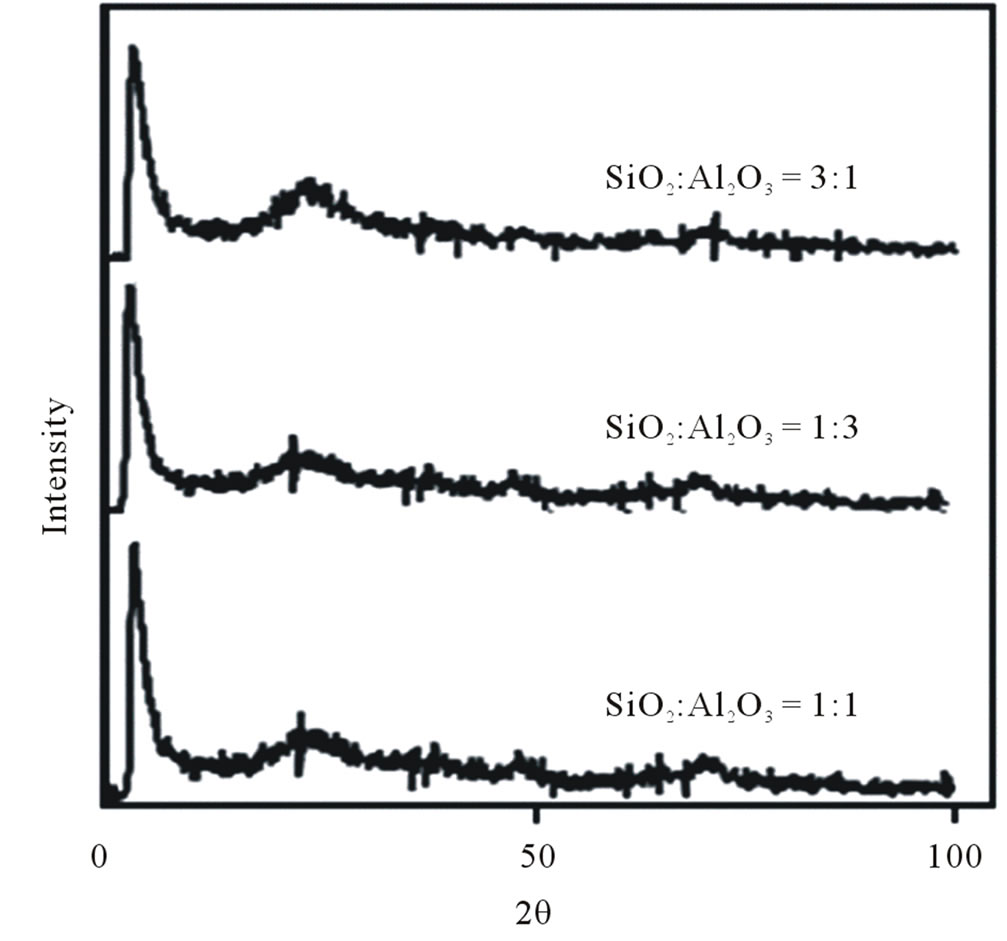
Figure 1. Different molar ratio SiO2:Al2O3 diffractograms showing a similar structure regardless the different molar ratio.
can be seen that the molar ratio SiO2:Al2O3 do not have significant influence on the structure formation process due to the fact that the diffraction patterns are quite similar. A summary of the textural properties is shown in Table 1; furthermore, in Table 1 it is shown that increasing the molar ratio of SiO2:Al2O3 the surface internal area decreases, a fact to be considered because the molar ratio of 1:3 turned out to be the condition that best agglomerated the solid.
The N2 adsorption isotherm is shown in Figure 2, it was found to have a Type IV isotherm; this kind of behavior is associated with mesoporous materials. Additionally, hysteresis loops are characteristics in mesoporous materials and they are related with capillarity condensation, also, it can be observed that the loop’s shape is classified as type H3 and this could be related to the presence of slit-shaped pores [32,33].
3.2. Surface Acidity
These kind of materials usually have an amphoteric behavior [34]. Table 2" target="_self"> Table 2 shows the quantification of acid and basic sites on the material surface, by the well-known Boehm method, showing a predominance of basic sites.
3.3. Point of Zero Charge
Figure 3 shows a plot of surface charge as a function of
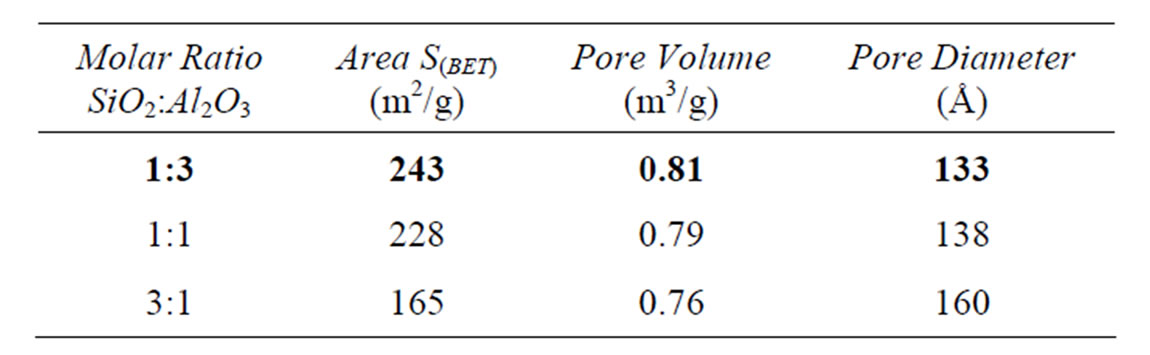
Table 1. Summary of textural properties for each prepared molar ratio.

Figure 2. N2 Adsorption-Desorption isotherm for SiO2: 3Al2O3 where is shown the hysteresis loop associated to the capillary condensation and related to the presence of mesopores in material.
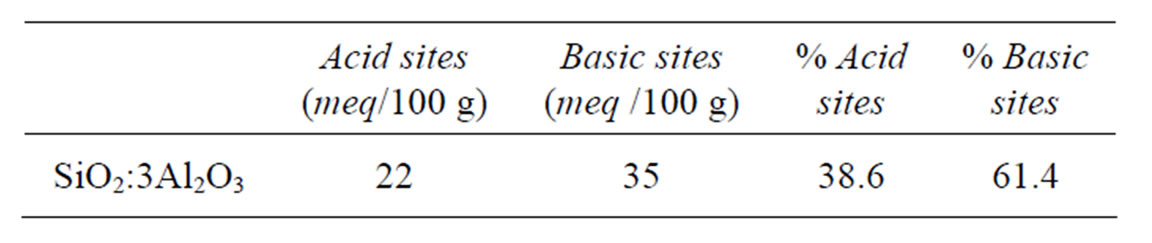
Table 2. Acid and basic sites of 1:3 molar ratio.
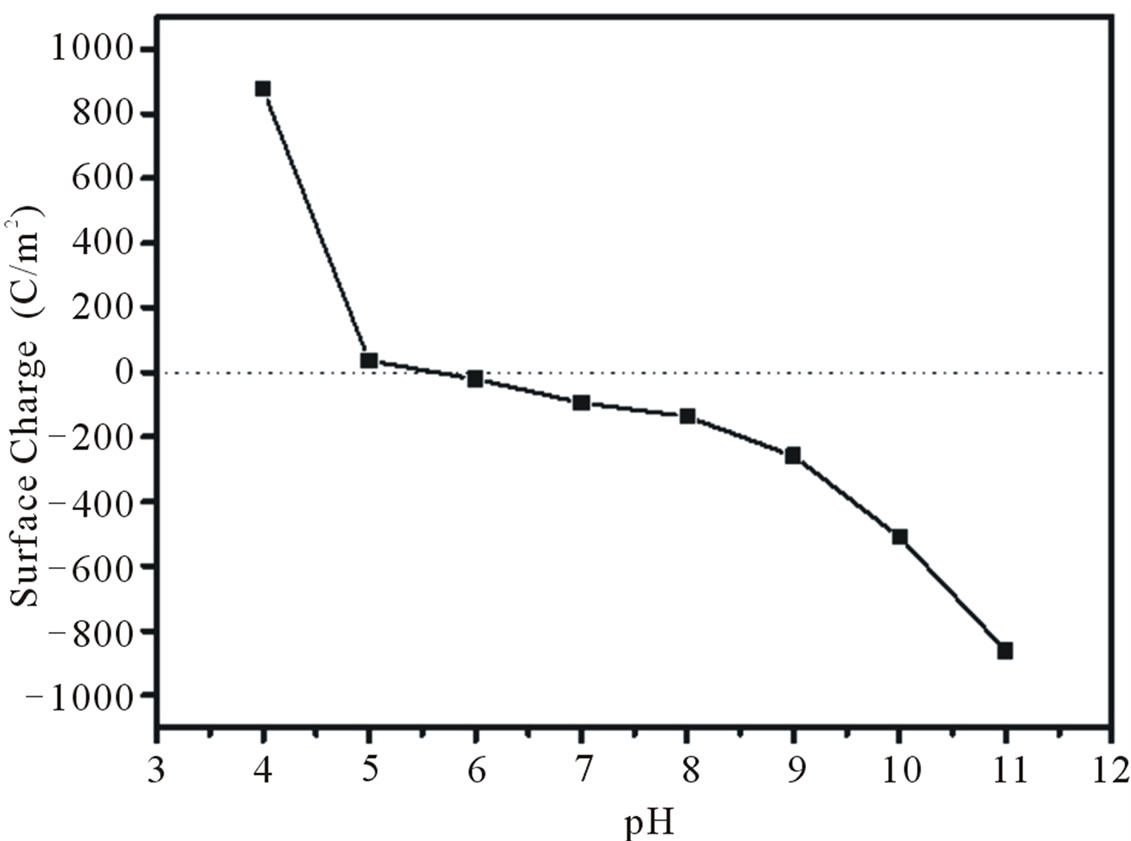
Figure 3. Surface charges distribution of SiO2:3Al2O3. Point of zero charge for this molar ratio is near to pH 5.3 value.
pH, when the net total particle charge is zero, the pH value is called the point of zero charge (PZC), an important factor that characterizes solid surfaces [35]. The PZC was found to be around pH 5.3, noting that at pH 4 value there is a majority of positive charges, and at higher pH values than the PZC, the negative charges increase and may have a preference for cationic species, as was the case with this study, copper (Cu2+).
3.4. Aluminium Solubility
No aluminium in solution was detected for over 24 h after the material was held in contact with deionized water at different pH until 6 (data not shown). From these results, at pH 4 no Al+3 was detected in solution; therefore, it was considered acceptable proceeding to the copper adsorption-desorption experiments.
3.5. Adsorption Isotherms Analyses
3.5.1. Langmuir and Freundlich Models
The major assumption of Langmuir’s adsorption model is that the adsorbent’s surface has a finite and energetically equivalent number of distributed adsorption sites. When all adsorption sites are covered, there is no possible any more accumulation of sorbate on surface; a monolayer has been formed [36]. Equation (1) describes the Langmuir model for adsorption:
 (1)
(1)
where qe is the adsorbate concentration in the solid, Ceq is the concentration in the liquid; both qe and Ceq are in equilibrium. QM is the adsorptive capacity, and K is an equilibrium constant [37].
The Freundlich model considers the adsorption process based on multilayer formation. Also, this model assumes that adsorption sites are energetically nonequivalent due to a heterogeneous surface [37]. The mathematiccal expression that describes this is shown in Equation (2):
 (2)
(2)
where qe is the adsorbate concentration in the solid, Ce is the concentration in the liquid; both qe and Ce are in equilibrium. QM is the adsorptive capacity, and K and Fr are equilibrium constants [37]. Both Langmuir and Freundlich models were rearranged in their respective linear form in order to be able to plot and compare with experimental data.
Figure 4 shows the copper (Cu2+) adsorption isotherm at 25˚C and pH 4 for experimental data as well the fitted Langmuir and Freundlich models. The maximum adsorption capacity (QM) of copper on the material was 16.8 mg/g. To determine the percentage of deviation of each model, Equation (3) was used:
 (3)
(3)
where qexp is the experimental value and qcal is the calculated one. These results can be seen in Table 3, where Langmuir’s adsorption model shows a better fit to the experimental data than Freundlich’s one, explainable by the suggestion of a probable monolayer adsorption process instead of a multilayer behavior.
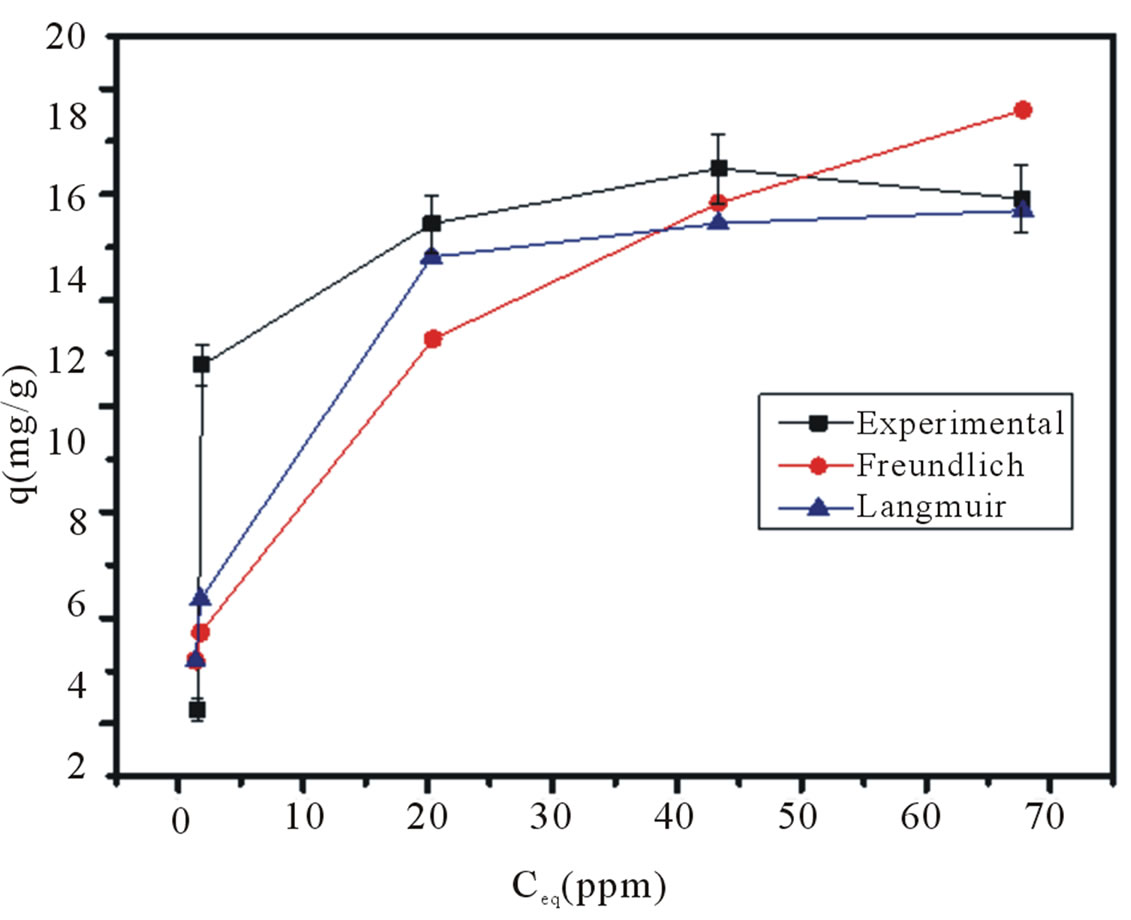
Figure 4. Copper adsorption isotherm on agglomerated Al2O3:3SiO2, pH 4 at 25˚C. Also, are plotted Langmuir and Freundlich models to contrast with experimental data.
3.5.2. Temperature Effect over the Adsorption Process
For this particular case it was found that at temperatures over the 35˚C level, the adsorption capacity diminishes to 15.97 mg/g. This behavior may be related to an increase in the metals kinetic energy on the adsorption process, causing those attractive forces between sorbent-sorbate to weaken. Evidence of this concept is observed in Figure 5.
3.6. Desorption Process
Copper desorption tests were carried out using three substances as desorbing agents: 0.1 M NaCl, 0.1 M HCl and 0.1 M NaOH. Figure 6 shows that HCl was the reagent which desorbs the larger copper amount compared with NaCl and NaOH. Additionally, is important to note that time period has no influence on the copper desorption process.
4. Conclusions
This study has shown that it is feasible to synthesize a low cost aluminosilicate. This material exhibits a mesoporous characteristic that is able to adsorb copper ions from aqueous solution. Molar ratio SiO2:3Al2O3 presented a larger surface area (243 m2/g) and a better ag-

Table 3. Langmuir and Freundlich Adsorption Models fitted to experimental data for copper adsorption.

Figure 5. Effect of temperature in the adsorption process of copper at 25˚C and 35˚C. The degree of uncertainly represented by error bars increase with the higher concentration levels.
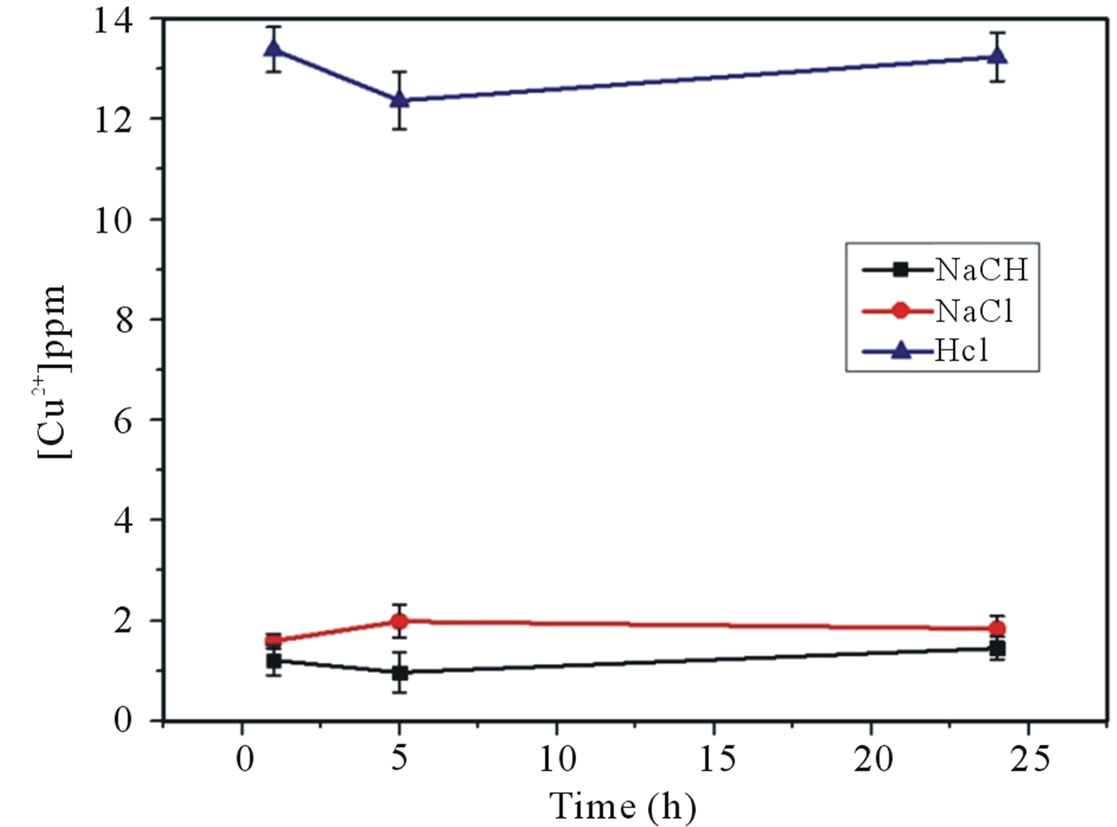
Figure 6. Cu+2 desorption from aluminosilicate with NaCl, HCl and NaOH at 25˚C for 1, 6 and 24 h.
glomeration process to form stable pellets, with no Al3+ dissolved in solution at pH 4, and a higher copper adsorption capacity.
The influence of temperature over the copper adsorption could indicate that the predominant mechanism could be chemisorption. The predominance of basic sites on the surface of the solid indicates that an ion exchange could be discarded as the main mechanism. Finally, the copper desorption studies showed that acid treatment with HCl 0.1 M, were able to recover up to 40% of Cu2+. The Langmuir model fitted better to the copper adsorption experimental data.
5. Acknowledgements
The authors wish to thank to University of Guanajuato (Mexico) for the required facilities and Mexican Council of Science and Technology (CONACyT) for sponsoring this work.
REFERENCES
- M. Karvelas, et al., “Occurrence and fate of Heavy Metals in the Wastewater Treatment Process,” Chemosphere, vol. 53, No. 10, 2003, pp. 1201-1210. doi:10.1016/S0045-6535(03)00591-5
- N. Chubar, et al., “Heavy Metals Biosorption on Cork Biomass: Effect of the Pre-Treatment,” Colloids and Surfaces A: Physicochemical and Engineering Aspects, vol. 238, No. 1-3, 2004, pp. 51-58. doi:10.1016/j.colsurfa.2004.01.039
- C. Brooks, “Metal recovery from Industrial Waste,” Lewis Publishers, Chelsea, 1991.
- E. Commission, “Heavy Metals in Waste,” COWI, Kongens Lyngby, 2002.
- Norma official mexicana NOM-127-SSA1-1994, “Salud ambiental, agua para uso y consumo humano. Límites permisibles de calidad y tratamientos a que debe someterse el agua para su potabilización”, SSA, Mexico City, 1994.
- I. N. Sax, “Dangerous Properties of Industrial Materials,” Van Nostrand Reinhold Co., New York, 1975.
- M. A. Barakat, “New trends in Removing Heavy Metals from Industrial Wastewater,” Arabian Journal of Chemistry, vol. 4, No. 4, 2011, pp. 361-377. doi:10.1016/j.arabjc.2010.07.019
- I. Oller, et al., “Combination of Advanced Oxidation Processes and Biological Treatments for Wastewater Decontamination—A review,” Science of the Total Environment, vol. 409, No. 20, 2011, pp. 4141-4166. doi:10.1016/j.scitotenv.2010.08.061
- C. E. d. A. d. Guanajuato, “Estudio para la determinación del grado de alteración de la calidad del agua subterránea por compuestos orgánicos en Salamanca,” Guanajuato, Mexico, 2000.
- A. Medel-Reyes, et al., “Caracterización de Jales Mineros y Evaluación de su Peligrosidad con Base en su Potencial de Lixiviación,” Conciencia Tecnológica, vol. 1-6, 2008, pp. 32-35.
- M. Meybeck, et al., “Historical perspective of Heavy Metals Contamination (Cd, Cr, Cu, Hg, Pb, Zn) in the Seine River basin (France) following a DPSIR approach (1950- 2005),” Science of The Total Environment, vol. 375, No. 1-3, 2007, pp. 204-231. doi:10.1016/j.scitotenv.2006.12.017
- G. YaylalI-Abanuz, “Heavy Metal Contamination of Surface Soil around Gebze Industrial Area, Turkey,” Microchemical Journal, vol. 99, No. 1, 2011, pp. 82-92. doi:10.1016/j.microc.2011.04.004
- R. Kumar Sharma, et al., “Heavy Metal Contamination of soil and vegetables in Suburban Areas of Varanasi, India,” Ecotoxicology and Environmental Safety, vol. 66, No. 2, 2007, pp. 258-266. doi:10.1016/j.ecoenv.2005.11.007
- US Department of Health and Human Services, “Toxicological Profile for Copper,” US Department of Health and Human Services, Atlanta, 2004.
- EPA National Primary Drinking Water Regulations, “[Sec. 141.32(e) (20)], Federal Regulations,” The Bureau of National Affairs, Inc., 1992.
- J. L. Gardea-Torresdey, et al., “Copper adsorption by esterified and Unesterified Fractions of Sphagnum peat moss and Its Different Humic Substances,” Journal of Hazardous Materials, vol. 48, No. 1-3, 1996, pp. 191- 206. doi:10.1016/0304-3894(95)00156-5
- O. Tünay and N. I. Kabdasli, “Hydroxide precipitation of Complexed Metals,” Water Research, vol. 28, No. 10, 1994, pp. 2117-2124. doi:10.1016/0043-1354(94)90022-1
- S. Babel and T. A. Kurniawan, “Low-Cost Adsorbents for Heavy Metals Uptake from Contaminated Water: A Review,” Journal of Hazardous Materials, vol. 97, No. 1-3, 2003, pp. 219-243. doi:10.1016/S0304-3894(02)00263-7
- Z. Hu, et al., “Impact of Metal Sorption and Internalization on Nitrification Inhibition,” Environmental Science & Technology, vol. 37, No. 4, 2003, pp. 728-734. doi:10.1021/es025977d
- B. Volesky, “Detoxification of Metal-Bearing Effluents: Biosorption for the Next Century,” Hydrometallurgy, vol. 59, No. 2-3, 2001, pp. 203-216. doi:10.1016/S0304-386X(00)00160-2
- K. S. Low, C. K. Lee and S. G. Tan, “Sorption of Trivalent Chromium from Tannery Waste by Moss,” Environmental Technology, vol. 18, No. 4, 2010, pp. 449-454. doi:10.1080/09593331808616559
- L. Charerntanyarak, “Heavy Metals Removal by Chemical Coagulation and Precipitation,” Water Science and Technology, vol. 39, No.10-11, 1999, pp. 135-138. doi:10.1016/S0273-1223(99)00304-2
- N. K. Lazaridis, et al., “Flotation of Metal-Loaded Clay Anion Exchangers. Part I: The Case of chromates,” Chemosphere, vol. 42, No. 4, 2001, pp. 373-378. doi:10.1016/S0045-6535(00)00143-0
- M. Pansini, et al., “Chromium removal from water by Ion Exchange Using Zeolite,” Desalination, vol. 83, No. 1-3, 1991, pp. 145-157. doi:10.1016/0011-9164(91)85091-8
- G. Chen, “Electrochemical technologies in Wastewater Treatment,” Separation and Purification Technology, vol. 38, No. 1, 2004, pp. 11-41. doi:10.1016/j.seppur.2003.10.006
- A. Santarsiero, et al., “Heavy Metal Distribution in Wastewater from a Treatment Plant,” Microchemical Jounal, vol. 59, No. 2, 1998, pp. 219-227. doi:10.1006/mchj.1998.1610
- J. F. Lee, et al., “Monitoring of the Structure of Mesoporous Silica Materials Tailored Using Different Organic Templates and Their Effect on the Adsorption of Heavy Metal Ions,” Journal of Physical Chemistry C, vol. 115, No. 16, 2011, pp. 8165-8174. doi:10.1021/jp200029g
- R. Noble and P. Terry, “Principles of Chemical Separations with Environmental Applications,” Cambridge University Press, Cambridge, 2004. doi:10.1017/CBO9780511616594
- C. González-Figueroa, et. al., “Pseudoboehmita Aglomerada a partir de Sulfato de Aluminio,” Revista Enlace Químico, Vol. 2, No. 1, 2008.
- H. P. Boehm, et al., “Surface Oxides of Carbon,” Angewandte Chemie International Edition in English, vol. 3, No. 10, 1964, pp. 669-677. doi:10.1002/anie.196406691
- A. Contescu, et al., “Surface acidity of Carbons Characterized by Their Continuous pK distribution and Boehm titration,” Carbon, vol. 35, No. 1, 1997, pp. 83-94. doi:10.1016/S0008-6223(96)00125-X
- K. S. W. Sing, “Reporting Physisorption Data for Gas Solid Systems—with Special Reference to the Determination of Surface-Area and Porosity,” Pure and Applied Chemistry, vol. 54, No. 11, 1982, pp. 2201-2218. doi:10.1351/pac198254112201
- W. Fan, et al., “Hierarchical nanofabrication of Microporous Crystals with Ordered Mesoporosity,” Nature Materials, vol. 7, No. 12, 2008, pp. 984-991.
- A. A. Jara, et al., “Studies of the Surface Charge of Amorphous Aluminosilicates Using Surface Complexation Models,” Journal of Colloid and Interface Science, vol. 292, No. 1, 2005, pp. 160-170. doi:10.1016/j.jcis.2005.05.083
- C. Appel, et al., “Point of Zero Charge Determination in soils and minerals via Traditional Methods and detection of Electroacoustic Mobility,” Geoderma, vol. 113, No. 1- 2, 2003, pp. 77-93.doi:10.1016/S0016-7061(02)00316-6
- M. M. Areco, et al., “Biosorption of Cu(II), Zn(II), Cd(II) and Pb(II) by Dead Biomasses of Green Alga Ulva lactuca and the development of a Sustainable Matrix for Adsorption Implementation,” Journal of Hazardous Materials, vol. 213-214, 2012, pp. 123-132. doi:10.1016/j.jhazmat.2012.01.073
- V. J. Inglezakis and S. G. Poulopoulos, “Adsorption, Ion Exchange and Catalysis: Design of Operations and Environmental Applications,” Elsevier, Amsterdam, 2006.
NOTES
1US Environmental Protection Agency.
2Pores of widths in the range of 2 - 50 nm are called mesopores.