Journal of Modern Physics
Vol.2 No.1(2011), Article ID:3768,4 pages DOI:10.4236/jmp.2011.21008
Spectral Method for Excitation Temperature Measurement in Hollow Cathode Lamp Plasma
1Faculty of physics, Modares University, Tehran, Iran.
2Faculty of Physics, Tehran University, Tehran, Iran.
E-mail: h.nabavi@modares.ac.ir
Received August 10, 2010; revised September 17, 2010; accepted September 20, 2010
Keywords: Gadolinium, Lamps, Excitation
ABSTRACT
In this paper the excitation temperature in a Gd hollow cathode lamp is measured for the first time. This measurement has made with considering of lamp spectra. One of the important measurements in plasma before using it as an interaction region with laser, is measuring of excitation temperature. Hollow cathode lamps are one of these regions. In this paper a Gd hollow cathode lamps with Ne as buffer gas is used as a plasma region. And the excitation temperature is measured. When the lamp current was 10 mA, the excitation temperature is measured 3000 K.
1. Introduction
Hollow cathode lamps with due attention to the variety of the metals used in their cathode are very suitable region for the consideration of reactions existing in plasmas [1]. Therefore in plasma spectroscopy, hollow cathode lamps have many applications. Some of it’s applications can refer to laser spectroscopy [2], optogalvanic spectroscopy [3], regulating and calibration of laser wavelength [4].
The region inside hollow cathode lamp is a plasma, the measurement of many parameters inside it, will be very important, For example, electron temperature, ions temperature and also atomic or molecular excitation temperature inside the plasma [5]. Plasma that is in thermodynamic equilibrium can specify with a single temperature. This temperature refers to energy distribution, spectral distribution and much other macroscopic information inside plasma. One of the most important plasma parameters that are very important in the laser interaction with plasma is exciting temperature. For calculating this temperature, different methods have been suggested and done. Among them one can refer to the measurement of particles speed distribution inside plasma, the absorption spectroscopy, induced fluorescence methods and consideration the saha-igert law.
The more simple method that can apply for obtaining excitation temperature in plasma is using the optical spectrum in plasma [6], its advantages are the simplicity and to be low expenses compared with other method.
According to them, the temperature calculation in plasma is the most acts that must be done before using it. In this paper, the excitation temperature for the plasma existing in hollow cathode lamp that its cathode is Gd has been calculated via the consideration its spectrum distribution.
2. Experiment Setup
figure 1 shows experimental arrangement for obtaining lamp temperature. In the hollow cathode lamp, the
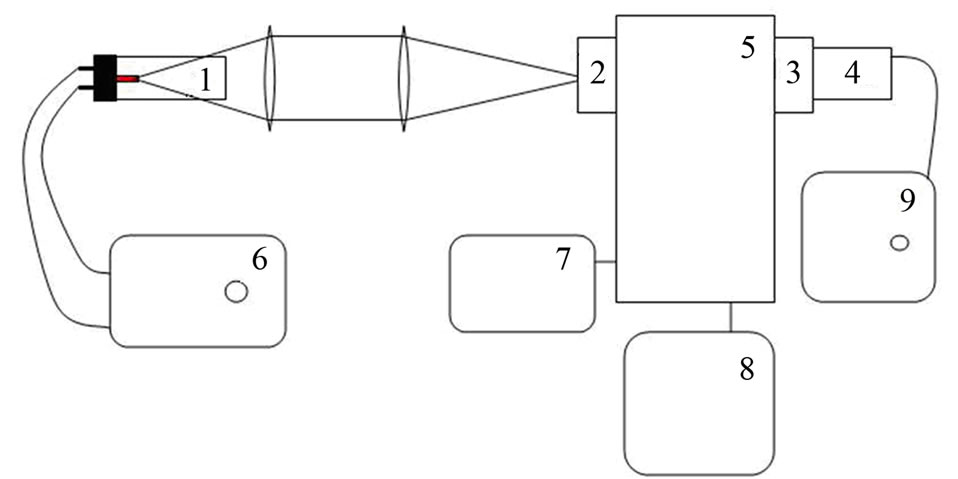
Figure 1. Experiment arrangement, 1—Cavity cathode lamp 2, 3—Light entrance and exit hatches 4—PMT, 5—Monochromator 6—Lamp feed source 7—Constancy 8—Computer 9—PMT feed source.
cathode is Gd and the buffer gas is Ne. the maximum passing lamp current is 15 mA and the efficient voltage is 250 V. The radiation light of this lamp is focused by two spherical lenses inside the entrance slit a monochromator that its focal length is 200 mm.This monochromator can measure wavelength from 300 mm until 700 mm. In the monochromator exit settles photomultiplier is model 77348. The high voltage power supply of PMT, must have 0.01% stability and accuracy because fluctuation of exit signal shouldn't be due to fluctuation of feed source voltage. The PMT exit after amplification gets into computer and the information is registered.
in (figure 1), emitted radiation of lamp by spherical lens has been focused to inside monochromator. With this method only the part of that is observed by spherical lens enters to monochromator, but since these conditions is similar for all wavelengths. After getting emitted light of lamp, this is selected by diffraction grating inside monochromator in desirable wavelength and is leaded toward the exit slit. That which is necessary to consider is grating efficiency in different wavelengths. Diffraction gratings response to different wavelengths differently (Figure 2).Therefore correction coefficient must consider in measurements of different wavelengths. Also this matter holds true in PMT lamp.
3. Results and Discussions
With sweep the grating angle as compared with the entrance light, one can obtain the lamp spectrum. In (figure 4) the sample of lamp spectrum is observed in 500- 600 nm. Each one of the observed arrows in this figure is related to different elements and emissions existing in
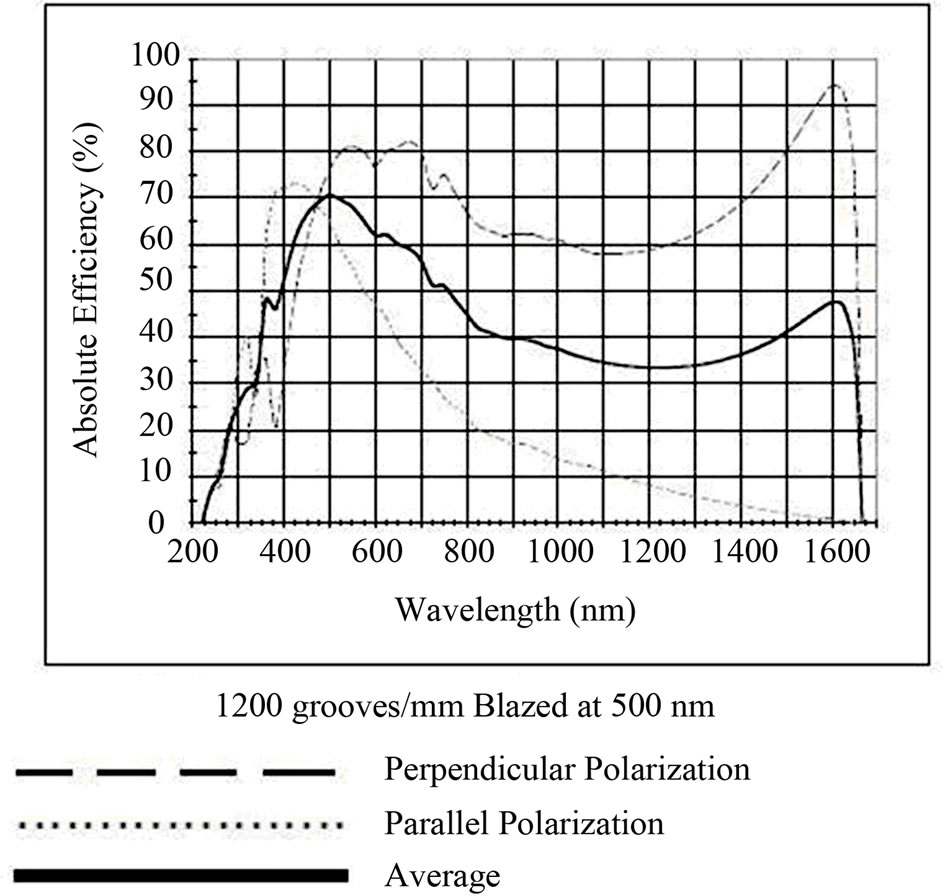
Figure 2. Grating curve.
lamp, For example, NeI (neutral Ne) or NeII (Ionized Ne), GdI (neutral Gd) and GdII (Ionized Gd). The fact that what line is related to what element and what kind it is, is distinguished by standard tables comfortably. for instant, one can find that the line 5752 Ao is for GdI and line 5834 Ao is for NeI. Some lines of GdI that we have used in our measurement is listed in table 1.
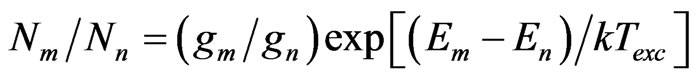
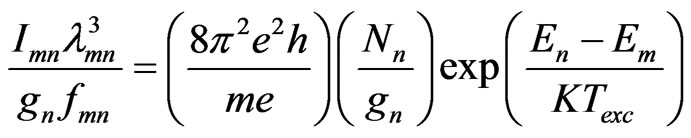
The intensity of each one of the observed lines in lamp spectrum in (1) is related to lamp and also the measurement instruments [7,8].
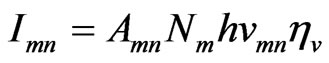 (1)
(1)
That  is the emission line intensity that is transmitted from upper level to lower level.
  is level population.
  is transition quantum frequency energy,
  is Einstein coefficient in transition
  that could obtain from existing standard tables. Just as was said, measured intensity from the PMT, for obtaining the real amount of measured in it, must be multiplied by correction coefficient related to the grating and PMT.
In (1) this coefficient is named for each wavelength .
.
 (2)
(2)
And  are calculated from shown curves in figure 2 and figure 3. In this experiment we have used a PMT model 77384 with a good responsivity and linearity in our measurement region. Finally, the exciting temperature inside lamp will be calculated from:
 (3)
(3)
That  is the levels energy. For obtaining the relation that can simplicity calculate with the use of that the exciting temperature, we use (1) to (3) :
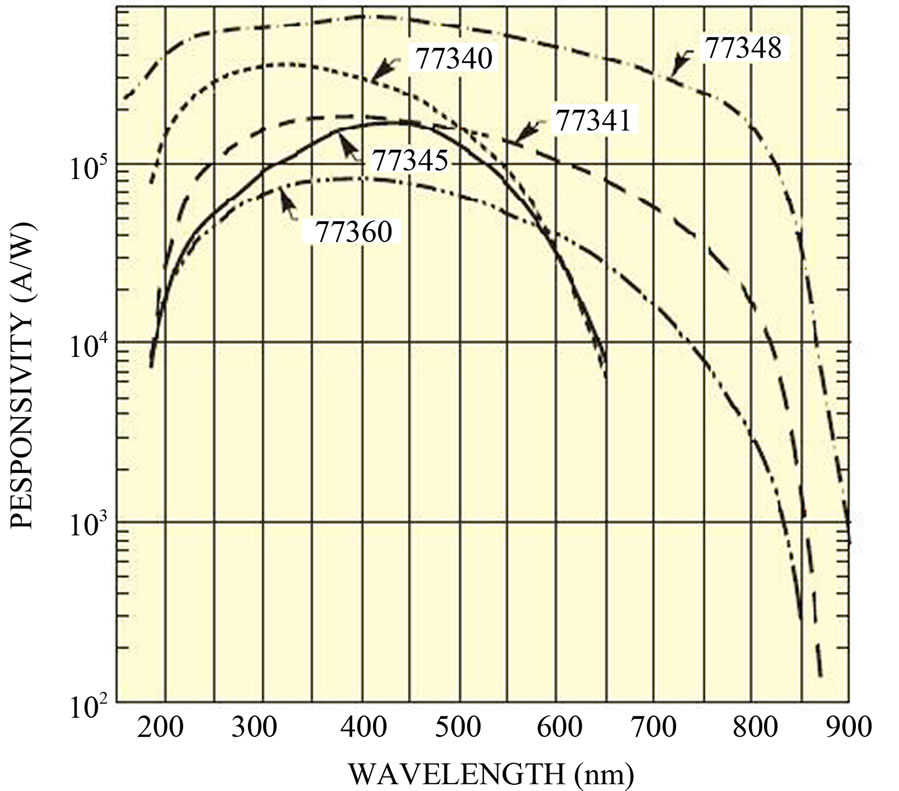
Figure 3. PMT curve.
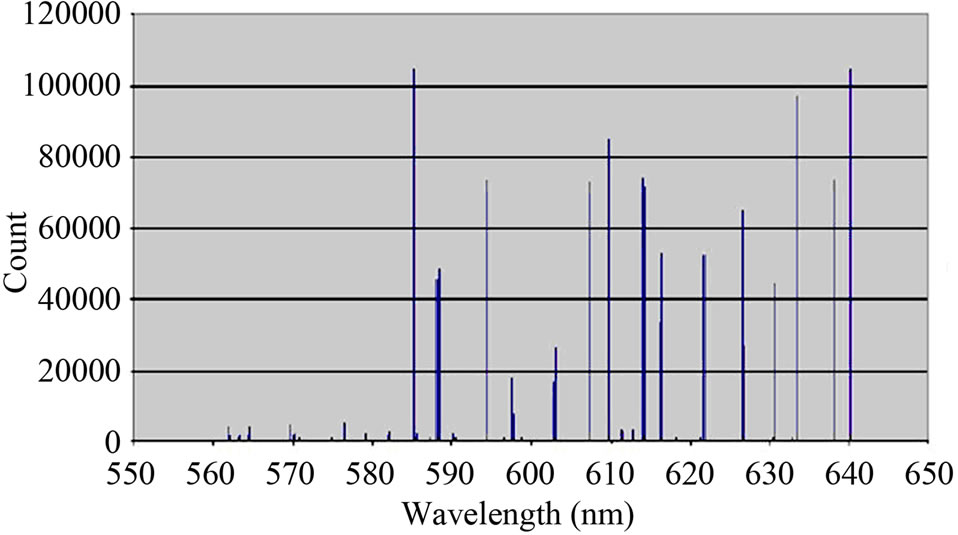
Figure 4. Lamp spectrum in area 550-650nm and current 10mA.
 (4)
(4)
 is the emission wavelength
  and the
  is the oscillator strength of the transition.
4. Conclusions
For all transitions that happen to similar lower level nthe quantity 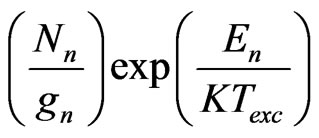 is constant, therefore the function
 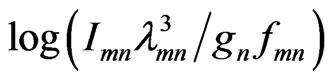 in compared with
is linear with gradient  (boltzman apparent).
  and
and  are extract from the standard tables [9],
  will be read by the obtained spectrum and the proportional intensities
  are specified by the obtained spectrum of lamp. The lines specifications that in this experiment have used for the measurement of lamp Temperature exist in (table 1). Finally, lamp exciting
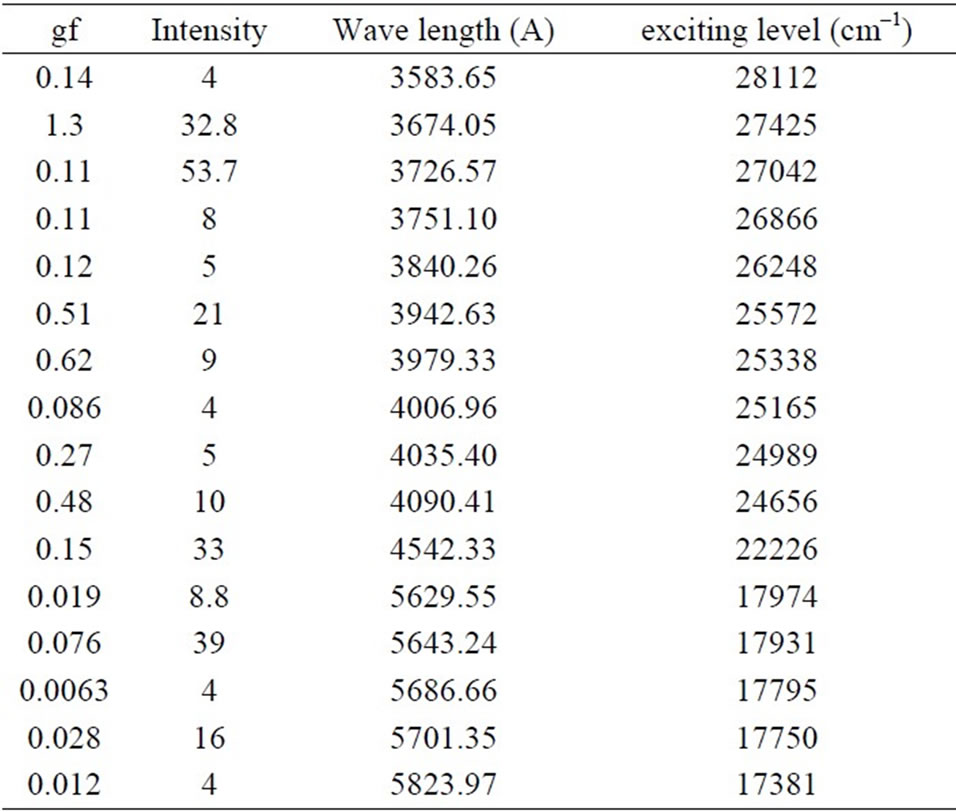
Table 1. Transition specifications to joint level 215 cm-1.
temperature is obtained 3000 K. This temperature was under conditions that the passing current of lamp was 10 mA. Since a plasma generated in a hollow cathode lamp has a low electron density, excitation temperature is different from electron temperature. Indeed the temperature measured from Boltzmann plots is the electron temperature. Only when local thermodynamic equilibrium (LTE) is achieved. Nevertheless Boltzmann plots being straight lines, partial LTE characterized by excitation temperature and involving only high levels is reached.
So much is certain that in different currents, other exciting temperatures are obtained. As suggestion for future works one can obtain the calculation of lamp temperature by using some models and dissolving rate equations [10] and [11] existing in lamp and compare it with experimental results.
Beside simplicity, This method for measuring the excitation temperature is more clear than fluorescence imaging with CCD [12], because in most laboratory doesn’t have any condition for obtaining the properties of CCD. Therefore one can measure this temperature with simple and precision instrument such as grating, PMT and Oscilloscope.
REFERENCES
- N. E. Annemie, G. Renaat and M. Joost, “Gas Discharge Eplasmas and Their Applications,” Spectrochimica Acta B, Vol. 57, 2002, pp. 609-658. doi:10.1016/S0584-8547(01)00406-2
- J. P. Young, R. W. Shaw, C. M. Barshick and J. M. Ramsey, “Determination of Actinide Isotop Eratio Susing Glow Discharge Eoptogalvanic Spectroscopy,” Journal of Alloys and Compounds, Vol. 271-273, 1998, pp. 62-65. doi:10.1016/S0925-8388(98)00025-5
- D. Zhechev and N. Parvanova, “Anomalous Optogalvanic Signal Spectriometric Applications,” Opto-Electronics Review, Vol. 11, No. 1, 2003, pp. 31-34.
- B. Smeets, “Laser Frequency Stabilization Using an FeArhollow Cathode Discharge Cell,” The Netherlands Reports, 2003.
- J. Jonkers and J. A. M. Mullen, “The Excitation Ttemperature In (He) Plasmas,” Journal of Quantitative Spectroscopy & Radiative Transfer, Vol. 61, No. 5, 1999, pp. 703-709. doi:10.1016/S0022-4073(98)00059-4
- N. M. Shaikh, B. Rashid, S. Hafeez, Y. Jamil and M. A. Baig, “Measurement of Electron Density and Temperature of a Laser-Induced Zink Plasma,” Journal of Physics D, Vol. 39, 2006, pp. 1384-1391. doi:10.1088/0022-3727/39/7/008
- V. H. Baggio-Scheid. A. C. J. Paes and J. W. Neri, “Study of Excitation Rates in a Hollow Cathode Discharge,” Brazilian Journal of Physics, Vol. 33, No. 2, 2003, pp. 336-339.
- W. Natsu, S. Ojima, T. Kobayashi and M. Komieda, “Temperature Distribution Measurment in EDM Arc Plasma Using Spectroscopy,” JSME International Journal, Vol. 47, No. 1, 2004, pp. 384-390. doi:10.1299/jsmec.47.384
- Ch. H. Corliss, “Experimental Transition Probabilities for Spectral Lines of 70 Elements,” 1962.
- N. Baguer, A. Bogaerts and R. Gijbels, “Hybrid Model for a Cylindrical Hollow Cathode Glow Discharge and Comparison with Experiments,” Spectrochimica Acta B, Vol. 57, No. 2, 2002, pp. 311-326. doi:10.1016/S0584-8547(01)00385-8
- A. Bogaerts, “Numerical Modeling of Gas Discharge Eplasmas for Various Applications,” Vacuum, Vol. 69, 2003, pp. 37-52. doi:10.1016/S0042-207X(02)00306-8
- G. Reinaudi, T. Lahaye, Z. Wang and D. Guéry-Odelin, “Strong Saturation Absorption Imaging of Dense Clouds of Ultracold Atoms,” Optics Letters, Vol. 32, No. 21, 2007, pp. 3143-3145. doi:10.1364/OL.32.003143