Advances in Bioscience and Biotechnology
Vol. 3 No. 7 (2012) , Article ID: 24700 , 7 pages DOI:10.4236/abb.2012.37108
Bacterial ArtA protein specifically binds to the internal region of IS1 in vitro
![]()
Division of Microbiology, National Institute of Health Sciences, Tokyo, Japan
Email: sachiko@nihs.go.jp
Received 12 August 2012; revised 21 September 2012; accepted 24 October 2012
Keywords: Bacteria; Transcription Stimulation; Downstream Element; DNA Binding; IS1; ArtA Protein
ABSTRACT
The internal region of bacterial translocatable IS1 acts as a cis-element to stimulate transcription from the various promoters located upstream. The product of the artA gene is genetically shown to stimulate transcription with the cis-element. Here, a codonoptimized artA gene was synthesized and cloned to express the ArtA protein. ArtA was purified as the His-tagged protein. Nitrocellulose filter binding assay showed that ArtA specifically binds to the IS1 internal region. Electrophoretic mobility shift assay also showed specific binding of ArtA to the IS1 internal region. These results imply that ArtA directly binds to the IS1 internal region and stimulates transcription.
1. INTRODUCTION
Bacterial IS1 is a mobile DNA of 768 bp and repetitive in the chromosome [1]. IS1 contains left (IRL) and right (IRR) terminal inverted repeats of approximately 35 bp, which are required for transposition [1]. In IS1, there are two reading frames, insA (bp positions 56 - 328) and B’-insB (bp positions 249 - 750). They encode transposition-related proteins and are transcribed by the promoter within the IRL region [2,3]. Bacterial RNA polymerase binds to IRL and IRR in vitro [2]. InsA protein of IS1 also specifically binds to IRL and IRR [4]. Analysis of the transcripts from IRL shows that RNA synthesis begins at one in a stretch of five adenylate residues of bp positions 40 - 44 of IS1 [2]. Interestingly, the internal region of IS1 (bp positions 76 - 208) acts as a cis-element to stimulate RNA synthesis from the promoter of IS1 and from exogenous promoters located upstream of the cis-element [5]. The downstream element to activate transcription is uncommon in bacteria [6].
The product of the bacterial artA gene is genetically shown to work with the IS1 internal region and stimulates transcription [5]. The genetic results does not show whether the ArtA protein binds directly to the IS1 internal region. The amino acid sequence of ArtA, which consists of 104 residues, has no detectable match with the known protein domain families in Pfam database (unpublished data). It is significant to examine the DNAbinding ability of ArtA in vitro. So far, I had attempted to clone artA to various expression vectors and produce ArtA in various host strains. However, the production was never observed on SDS-polyacrylamide gels. When Wu and Ippen-Ihler [7] found the artA gene in the tra region of the Escherichia coli F factor as a gene of unknown function, its expression was examined: The product seems not to be expressed in E. coli maxicells, but the expression potential of the promoter and translational start site for artA are in upstream region. artA is AT rich and has many rare codons of E. coli (unpublished data), and thus the gene product might not be detected. Recently, many genes have artificially synthesized with codons optimized for the expression host, which led to higher protein production [8].
Here, codon-optimized artA is synthesized and cloned to the plasmid vector. The ArtA protein is expressed and purified. The purified ArtA is shown to bind specifically to the IS1 internal region.
2. MATERIALS AND METHODS
2.1. Construction of ArtA Protein Expression Plasmid
Synthesis of the artA gene (GenBank accession U01159) was carried out by GenScript after codon usage bias adjustment with OptimumGeneTM. The artificial artA was in the following context (Figure 1): Pae I restriction site, SD sequence, translation enhancing element [9], sequence encoding the hexahistidine (6xHis) tag for affinity purification, factor Xa cleavage site, codon-optimized artA, and Pst I restreiction site. Nucleotide sequence of the synthetic artA will be supplied on request. The fragment was digested with Pae I and Pst I and cloned into pUC57 which had cut with Pae I and Pst I, generating pSAM701. In pSAM701, the lac promoter of the vector
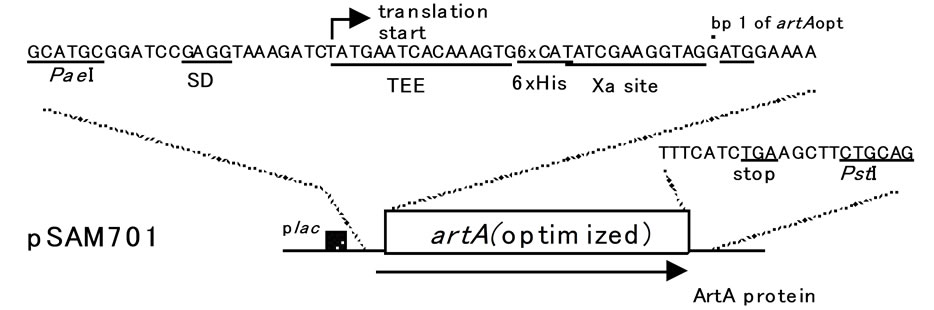
Figure 1. Structure of the plasmid used for expression of the ArtA protein. pSAM701 contains the codon-optimized artA gene. Prior to the initiation codon of artA, translation enhancing element (TEE), sequence encoding 6xHis, and factor Xa cleavage site are fused in-frame. The artA expression is driven by the lac promoter (plac) existing originally in pUC57.
is followed by the synthetic translation initiation signals and artA (Figure 1).
2.2. Expression and Purification of ArtA Protein
The pSAM701 DNA was transformed into the E. coli K12 derivative SG13009 harboring pRep4 (Qiagen) [10]. SG13009 having pRep4 and pSAM701 was grown in LB broth supplemented with ampicillin (100 μg/mL) and kanamycin (25 μg/mL) to an A600 of about 0.9 at 37˚C (about 4 to 5 hr). IPTG was then added to the culture at a final concentration of 2 mM, and incubation was continued for 2 hr. Cells were harvested and stored at −80˚C.
The condition to solubilize His-tagged ArtA was determined as follows. Frozen cells obtained from 5 mL of the cultures were thawed and suspended in 0.3 mL of the buffer of 100 mM Na-phosphate and Tris-HCl (pH 8.0) containing 6 M, 7 M, 8 M, or 9 M guanidine hydrochloride (GuHCl). The solutions were supplemented, where necessary, with 1% NP40 and/or 10 mM β-mercaptoethanol (β-ME). Cell suspensions were incubated for 1hr at room temperature and centrifuged. The supernatants were obtained, separated from GuHCl by TCA precipitation, and analyzed by Western blotting.
To purify ArtA, frozen cells obtained from 300 mL of the culture were used. The cells were thawed, suspended in 10 mL of Buffer A (9 M GuHCl, 100 mM Na-phosphate, 10 mM Tris-HCl, 1% NP40, and 10 mM β-ME, pH 8.0), and stirred for 1 hr at room temperature. After the lysate was centrifuged at 10,000 × g for 15 min, the supernatant was collected and loaded onto a 4 mL NiNTA (Qiagen) column pre-equilibrated in Buffer A.
Purification was performed at room temperature. The column was washed with Buffer A, with Buffer B (same as Buffer A but containing 8 M urea instead of 9 M GuHCl), and then with Buffer C (same as Buffer B but pH 6.3), until the A280 of the flow-through is less than 0.01. To elute the protein, 10 mL of Buffer D (same as Buffer B but pH 5.9), and subsequently, 10 mL of Buffer E (same as Buffer B but pH 4.5) were poured into the column. Chromatography was followed by A280, and the eluate of Buffer E was collected. Dialysis was performed at 4˚C. The eluate was dialyzed first against 300 mL of Buffer 1 [4 M urea, 10% (wt/vol) glycerol, 1 M KCl, 25 mM Tris-HCl, 0.1 mM EDTA, 0.5 mM dithiothreitol, 1% NP40, pH 7.5] overnight. Dialysis was continued against 300 mL of Buffer 2 [2 M urea, 30% (wt/vol) glycerol, 1 M KCl, 25 mM Tris-HCl, 0.1 mM EDTA, 0.5 mM dithiothreitol, 1% NP40, pH 7.5] for 2 hr, against 300 mL of Buffer 3(same as Buffer 2 but 1 M urea) for 2 hr, and then against two changes of 300 mL of Buffer 4 (same as Buffer 2 but no urea) for 2 hr each. The protein preparation was frozen and stored in liquid nitrogen.
2.3. Western Transfer and Immunodetection
Electrophoresis of proteins was performed using SDS- 12% polyacrylamide gels [11]. Proteins were transferred onto supported nitrocellulose membranes (Bio-Rad TransBlot Transfer Medium, pore size 0.2 μm) using a semidry electrophoretic apparatus. Immunodetection was carried out with mouse monoclonal IgG1 anti-His tag antibodies coupled to horseradish peroxidase (Anti-His HRP Conjugates supplied by Qiagen). The blots were blocked, labeled, and washed as recommended by the supplier. The bands were visualized with an Amersham ECL Plus system (GE Healthcare).
2.4. Nitrocellulose Filter Binding Assay
DNA fragments were PCR-amplified from pSAM153 (the construction will be supplied on request), pSAM199 [5], pSAM267 [5], and pQE70 (Qiagen) (Table 1, Figure 2(a)). Nucleotide sequences of the PCR products will be also supplied on request. The nitrocellulose filter binding assay was essentially the same as that used by Machida et al. [2]. DNA fragments (about 4 - 5 pmol each) were mixed and incubated with 0.6 μg of ArtA (46 pmol) for 10 min at 27˚C in 100 μL of binding buffer (100 mM KCl, 10 mM MgCl2, 0.1 mM EDTA, 0.5 mM
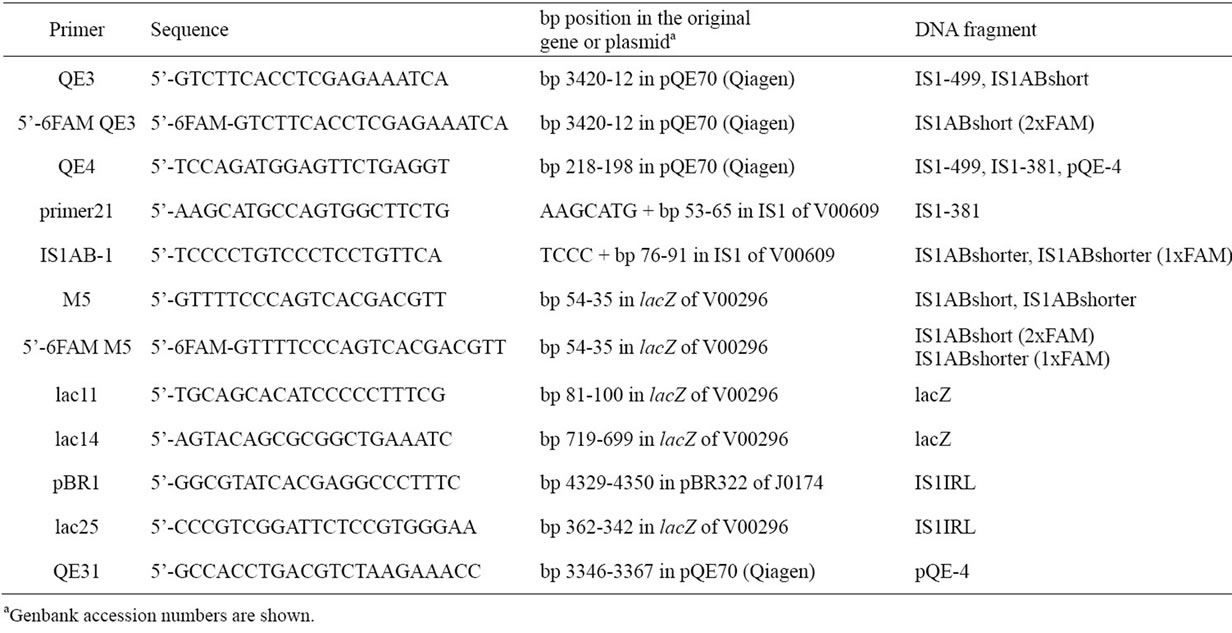
Table 1. PCR primers used for the preparation of DNA fragments.
DTT, 0.1 mg/mL bovine serum albumin, 20% glycerol, 25 mM Tris-HCl pH 7.5). Heparin (Sigma) was then added at 10 μg/mL and incubation was continued for 10 min. The samples were filtered through nitrocellulose filters (BA85, Shleicher & Schuell), which were washed three times with 1 mL of binding buffer. DNA fragments retained on the filter were eluted by soaking in 1 mL of elution buffer [0.2% (wt/vol) SDS, 25 mM Tris-HCl pH 7.5] for 30 min with shaking. The eluted DNA fragments were ethanol-precipitated and electrophoresed in polyacrylamide gels.
2.5. Electrophoretic Mobility Shift Assay (EMSA)
DNA fragments used for EMSA were PCR-amplified from pSAM267 [5] and pQE70 (Qiagen) (Table 1, Figure 2(a)). Nucleotide sequences of the PCR products will be supplied on request. Binding reactions were assembled by combining ArtA (0 or 13.8 pmol) and DNA fragments (3 pmol of each probe DNA and 10 pmol of each competitor DNA) in 20 μL of binding buffer (150 mM KCl, 10 mM MgCl2, 1 mM EDTA, 0.5 mM DTT, 0.1 mg/mL BSA, 11.5% glycerol, 25 mM Tris-HCl pH 7.5). ArtA was first incubated alone for 10 min at 27˚C in binding buffer, and then DNA fragments were added. After 10 min, heparin (Sigma) was added to the mixtures, and incubation was further continued for 10 min at 27˚C. The reaction samples were electrophoresed using 1.2% agarose gels and 1xTAE buffer. After running for 30 min at 100 V, gels were scanned by the fluorescent image analyzer FLA-3000 (Fuji Photo Film).
3. RESULTS
3.1. Expression of artA Gene
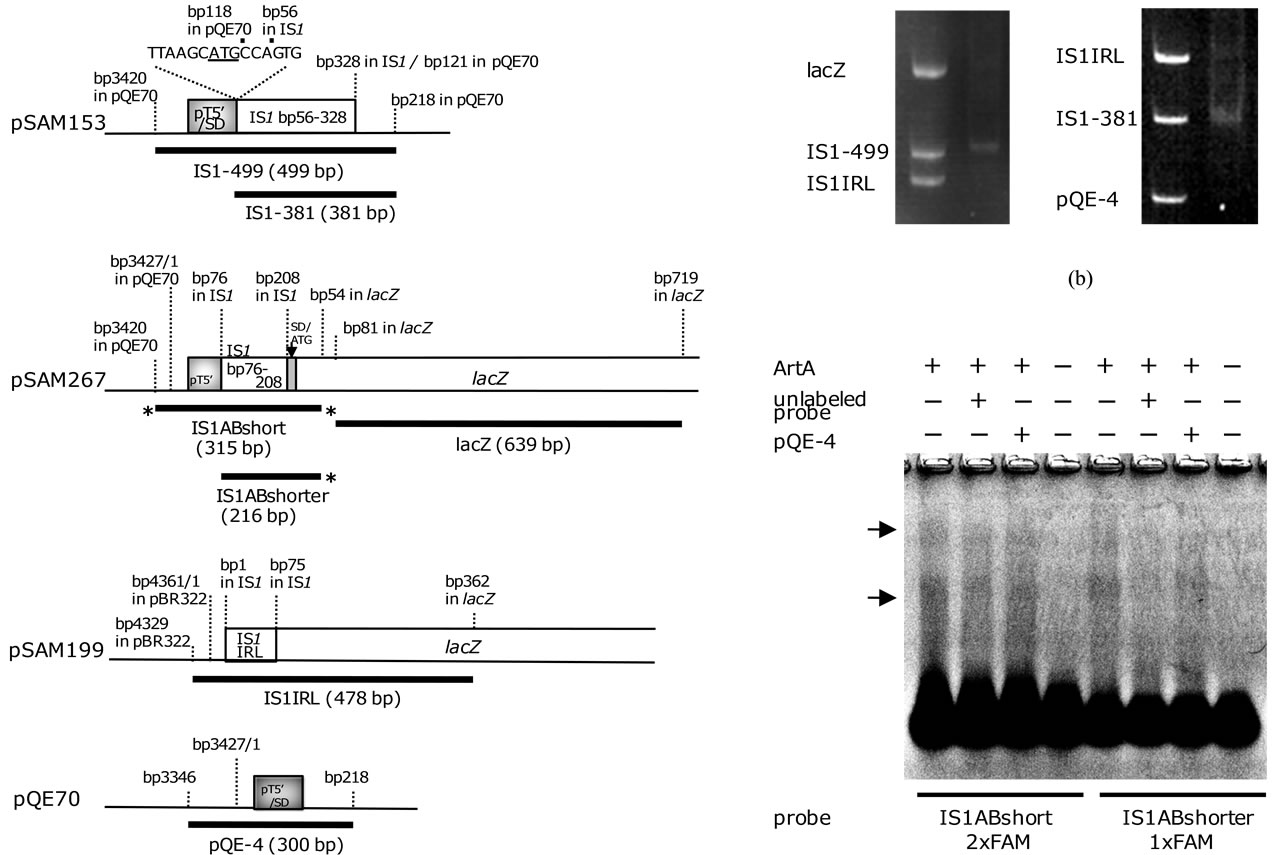
The artA gene of which codon usage was optimized for the expression in E. coli, was synthesized with additional sequences (GenScript): Codon adaptation index of the artificial artA was increased to 0.88 (originally 0.62), and GC content was increased to 45.22% (originally 34.94%); and prior to the beginning of artA, a SD sequence, a translation enhancing element, factor Xa cleavage site, and six histidine codons are linked in-frame (Figure 1). This artA was cloned into pUC57, generating pSAM701. In pSAM701, the artA expression is regulated by the lac promoter originally existing in pUC57 (Figure 1). ArtA protein product encoded in pSAM701 consists of 119 amino acids (aa): 104 aa of ArtA; and additional translation enhancing element (5 aa), 6xHis, and factor Xa cleavage site (4 aa). pSAM701 DNA was introduced into SG13009 having pRep4, and the two transformants were grown and incubated with and without 2 mM IPTG. To examine the artA expression, whole cell lysates of strains were analyzed by SDS-polyacrylamide gel electrophoresis (SDS-PAGE). In each of the IPTG-induced samples, there was a band of 13 kDa, which corresponded to the expected molecular mass of ArtA expressed from pSAM- 701 (Figure 3(a)). To confirm that the protein of 13 kDa is His-tagged ArtA, Western transfer and immunodetection with anti-His antibodies coupled to horseradish peroxidase (Anti-His HRP Conjugates) were performed. As expected, a band of 13 kDa appeared on the membrane when expression was induced (Figure 3(b)).
 (a)(b)(c)
Figure 2. Binding assays of ArtA to the DNA fragments. (a) Structures of the plasmids used for PCR amplification. The amplified regions are shown as thick lines below the structures, and the PCR products were used for assays. Asterisks indicate the positions of 6FAM; (b) Results of nitrocellulose filter binding assay. In each gel, the mixture of PCR products before filtration (left lane) and the DNA fragment retained on the membrane after filtration (right lane) are shown. Small aliquots of the PCR product mixtures just before incubation with ArtA were electrophoresed with the retained fragments for exact comparison. Two mixtures were used: lacZ, IS1-499, and IS1IRL (left gel); and IS1IRL, IS1-381, and pQE-4 (right gel). 5% polyacrylamide gels were used. (c) Result of EMSA. The probe IS1ABshort (2xFAM) was prepared by PCR amplification using 5’-6FAM labeled M5 and 5’-6FAM labeled QE3 primers from pSAM267 (Table 1). In the preparation of the probe IS1ABshorter (1xFAM), IS1AB-1 and 5’-6FAM labeled M5 primers were used (Table 1). Unlabeled IS1ABshort and IS1ABshorter probes were prepared by PCR amplification using M5 and QE3 primers and M5 and IS1AB-1 primers from pSAM267, respectively (Table 1). The pQE-4 fragment was used as a non-specific competitor. ArtA-DNA complexes were formed as described in the text. After electrophoretic separation in 1.2% agarose, the gel was scanned by the fluorescent image analyzer FLA3000. Arrows show the shifted bands.
3.2. Purification of ArtA Protein
It was examined whether ArtA is soluble in cytoplasm or insoluble. Frozen cells obtained from 50 mL of culture of SG13009 having pRep4 and pSAM701 were thawed and suspended with 10 mL of sonication buffer (50 mM Na-phosphate, 300 mM NaCl, pH 7.8). The suspension was sonicated briefly to lyse cells, and centrifuged at 10,000 × g for 20 min. The supernatant and precipitate were analyzed by Western blotting using Anti-His HRP Conjugates. While there was no reactivity in the supernatant, in the precipitate sample, a single band appeared at the expected molecular mass (13 kDa) (data not shown), concluding that ArtA is insoluble. To dissolve the insoluble ArtA, first 6 M GuHCl was used. HoweverWestern blot analysis showed that the protein was not solubilized (data not shown). Therefore, it was examined whether the protein could be solubilized in 7 M, 8 M, or 9 M GuHCl. Effects of the addition of 1% NP40 and/or 10 mM β-ME on solubilization were also examined. Samples were analyzed by Western blotting. The presence of 7 M and 8 M GuHCl resulted in no solubilization of the protein, even if NP40 and β-ME were added (data not shown). In the presence of 9 M GuHCl and 1% NP40, much amount of solubilized ArtA was detected (data not shown). Thus, in purification insoluble ArtA was solubilized with 9 M GuHCl containing 1% NP40. β-ME was also added to the solution, to reduce possible disulfide links between ArtA and the other proteins.
 (a) (b) (c)
Figure 3. Analyses of the proteins expressed in SG13009 cells having pRep4 and pSAM701. Electrophoresis of proteins was carried out using SDS-12% polyacrylamide gels [11]. (a) Cells from two transformants were incubated with or without IPTG, and the whole cell lysates were electrophoresed. An arrow indicates the position of ArtA. (b) A Western blot of the whole cells incubated with or without IPTG. 6xHis Protein Ladder (Qiagen) was used as a positive control for transfer and detection, and for size determination. (c) Electrophoresis of the protein sample obtained after nickel chelate affinity chromatography and dialysis.
ArtA, which possesses a His-tag near the N-terminal end (Figure 1), was purified using nickel chelate affinity chromatography, as described in detail in Materials and methods. Eluate of Buffer D of pH 5.9 did not absorb light of 280 nm. When eluted with Buffer E of pH 4.5, there was absorbance of protein. The eluted protein was collected and refolded in a dialysis tube by decreasing the concentration of urea stepwisely. The renatured protein sample was electrophoresed in a SDS-polyacrylamide gel, and the purity of ArtA was examined. The preparation contained the protein of 13 kDa, which corresponds to the molecular mass of ArtA, and several minor proteins (Figure 3(c)). The renatured protein sample was analyzed by Western blotting using Anti-His HRP Conjugates. As expected, a single band appeared at 13 kDa (data not shown). The ArtA sample was electrophoresed with lysozyme proteins, the concentrations of which are known (data not shown). The intensities of the bands were compared, and the concentration of ArtA in the sample was estimated as 60 ng/μL. 180 μg (13.8 nmol) of ArtA was obtained from 300 mL of culture.
3.3. Results of Nitrocellulose Filter Binding Assay
Two mixtures of PCR products were prepared: fragments of lacZ (639 bp), IS1-499 (499 bp), and IS1IRL (478 bp); and fragments of IS1IRL, IS1-381 (381 bp), and pQE-4 (300 bp) (Figure 2(a)). Nitrocellulose filter binding assay of purified ArtA with each of these mixtures was performed: The mixture was incubated with the protein, the sample was filtered, and the DNA fragment(s) which bound by the protein and retained on the filter was recovered. Figure 2(b) shows the PCR products in the mixtures before filtration, and the DNA fragments retained on the filter after filtration. When the mixture of lacZ, IS1-499, and IS1IRL was used, IS1-499 fragment was retained on the filter (Figure 2(b), left gel), demonstrating that ArtA binds to the fragment which contains the IS1 internal region. When the mixture of IS1IRL, IS1-381, and pQE-4 was used, IS1-381 fragment was retained on the filter (Figure 2(b), right gel), also showing that ArtA binds to the fragment which contains the IS1 internal region. These results suggest that ArtA specifically binds to the IS1 internal region.
3.4. EMSA Also Showed Specific Binding of ArtA to the IS1 Internal Region
To confirm that ArtA binds specifically to the IS1 internal region (bp 76-208), EMSA was carried out. For use as probes, IS1ABshort and IS1ABshorter DNAs were PCR-amplified from pSAM267 using 5’-6FAM QE3 and 5’-6FAM M5 primers, and IS1AB-1 and 5’-6FAM M5 primers, respectively (Table 1, Figure 2(a)). To detect the complex of ArtA and DNA fragment, polyacrylamide gels were used first in electrophoresis. However, mobility shifts of the probe DNAs were not observed: there were only the bands of probe DNAs at the proper sizes (data not shown). Changes of the KCl concentration showed no effect. Noteworthily, stepwise increased amounts of ArtA resulted in stepwise less intense bands of probe DNAs at the proper sizes, and alternatively, more intense bands appeared at the top of the gel (bottoms of the wells)
(data not shown). The intense bands at the top of the gel seemed to be large aggregates of ArtA and DNA, which probably could not enter the pores of the gel. To disaggregate the possible protein-DNA complexes, increased amounts of NP40 (up to 3%) were used, or addition of arginine to the reaction mixtures was performed. However, mobility shift was not observed. Therefore, I used agarose gel electrophoresis. Since agarose forms a matrix with larger pores than those in polyacrylamide gel, even large ArtA-DNA complexes were expected to migrate in agarose gel. In fact, when the reaction mixtures were electrophoresed in a 1.2% agarose gel, mobility shifts of the probe DNAs were observed (Figure 2(c)): The presence of ArtA caused smearing of the probe DNAs upwards, and in the smeared regions there were two intense bands. Formation of the intense bands was inhibited by adding the unlabeled fragments of probe DNAs to the reaction mixtures (Figure 2(c)). On the other hand, formation of the intense bands was not inhibited when the QE-4 fragment, a non-specific competitor, was added (Figure 2(c)). These results show that ArtA specifically bound to the IS1 internal region and formed a complex with the DNA.
4. DISCUSSION
Here, the ArtA protein was purified, and demonstrated to bind specifically to the IS1 internal region. This result means ArtA participates directly in transcription stimulated by the IS1 internal region.
It seems that ArtA is very toxic. Before ArtA was purified from SG13009 cells containing pRep4 and pSAM- 701, I had tried to clone the artificial artA to the expression vectors like pQE series plasmids. However, the plasmid carrying artA was not obtained. Next, expression of ArtA from pSAM701 was examined in various host strains, and only SG13009 containing pRep4 and pSAM701 produced ArtA detectable in SDS-PAGE. SG13009 gives levels of expression that are toxic to the cells for most proteins (Qiagen). ArtA formed firm inclusion bodies in cells to be needed 9 M GuHCl for solibilization. When ArtA was purified using Ni-NTA resin, the protein was eluted not with buffer D but with buffer E. Monomers usually elute in Buffer D, while multimers and aggregates generally elute in Buffer E (Qiagen). Thus, the eluted protein seemed to form multimers or aggregates. After refolding, the renatured molecules were probably still multimers. In EMSA, the probe DNAs which were incubated with ArtA remained at the top of the polyacrylamide gel (see Results). Although nitrocellulose filter binding assay and EMSA showed that ArtA specifically binds to the IS1 internal region, the protein appears to have the intrinsic ability to bind to DNA nonspecifically. When nitrocellulose filter binding assay was performed without heparin, ArtA bound to all of the DNA fragments used (less specific binding to the IS1 internal region, compared with the case in the presence of heparin) (data not shown).
Many bacterial elements for transcription activation, are present upstream from the promoter [6], and thus it is interesting how the IS1 internal region stimulates transcription. It is significant to have found that ArtA binds specifically to the downstream element. The IS1 internal region is reported to contain the sequence which is similar to the internal promoter for the eukaryotic RNA polymerase III (RNAP III) [12]. RNAP III transcribes eukaryotic genes for small RNAs like tRNAs and short interspersed repetitive elements (SINEs) [13]. The promoter sequences are highly conserved in eukaryotes [14], and interestingly bacterial tRNA genes also have the sequences [15]. The RNAP III promoter sequence of Alu, which is a human SINE, stimulates RNA synthesis in E. coli like the IS1 internal region [12]. The primary structure of bacterial ArtA appears to be partially similar to the promoter binding subunit of the transcription factor TFIIIC which works with RNAP III [12]. It is intriguing whether ArtA binds specifically also to the RNAP III promoter sequence in vitro.
![]()
![]()
REFERENCES
- Mahillon, J. and Chandler, M. (1998) Insertion sequences. Microbiology and Molecular Biology Reviews, 2, 725- 774.
- Machida, C., Machida, Y. and Ohtsubo, E. (1984) Both inverted repeat sequences located at the ends of IS1 provide promoter functions. Journal of Molecular Biology, 177, 247-267. doi:10.1016/0022-2836(84)90455-8
- Matsutani, S. (1994) Genetic evidence for IS1 transposition regulated by InsA and the InsA-B’-InsB species, which is generated by translation from two alternative internal initiation sites and frameshifting. Journal of Molecular Biology, 240, 52-65. doi:10.1006/jmbi.1994.1417
- Zerbib, D., Jakowec, M., Prentki, P., Galas, D.J. and Chandler, M. (1987) Expression of proteins essential for IS1 transposition: Specific binding of InsA to the ends of IS1. EMBO Journal, 6, 3163-3169.
- Matsutani, S. (2005) The internal sequence of IS1 stimulates RNA synthesis from IS1 own and exogenous promoters. Journal of Biological Systems, 13, 313-329. doi:10.1142/S0218339005001513
- Mendoza-Vargas, A., Olvera, L., Olvera, M., Grande, R., Vega-Alvarado, L., Taboada, B., Jimenez-Jacinto, V., Salgado, H., Juárez, K., Contreras-Moreira, B., Huerta, A.M., Collado-Vides, J. and Morett, E. (2009) Genome-wide identification of transcription start sites, promoters and transcription factor binding sites in E. coli. PLoS One, 4, Article ID: e7526. doi:10.1371/journal.pone.0007526
- Wu, J.H. and Ippen-Ihler, K. (1989) Nucleotide sequence of traQ and adjacent loci in the Escherichia coli K-12 F-plasmid transfer operon. Journal of Bacteriology, 171, 213-221.
- Gustafsson, C., Govindarajan, S. and Minshull, J. (2004) Codon bias and heterologous protein expression. Trends in Biotechnology, 22, 346-353. doi:10.1016/j.tibtech.2004.04.006
- Etchegaray, J.P. and Inouye, M. (1999) Translational enhancement by an element downstream of the initiation codon in Escherichia coli. Journal of Biological Chemistry, 274, 10079-10085. doi:10.1074/jbc.274.15.10079
- Gottesman, S., Halpern, E. and Trisler, P. (1981) Role of sulA and sulB in filamentation by lon mutants of Escherichia coli K-12. Journal of Bacteriology, 148, 265-273.
- Hussain, M., Ichihara, S. and Mizushima, S. (1980) Accumulation of glyceride-containing precursor of the outer membrane lipoprotein in the cytoplasmic membrane of Escherichia coli treated with globomycin. Journal of Biological Chemistry, 255, 3707-3712.
- Matsutani, S. (2007) Possible presence and role of the promoter sequence for eukaryotic RNA polymerase III in bacteria. Genetica, 131, 127-134. doi:10.1007/s10709-006-9122-5
- Geiduschek, E.P. and Kassavetis, G.A. (2001) The RNA polymerase III transcription apparatus. Journal of Molecular Biology, 310, 1-26. doi:10.1006/jmbi.2001.4732
- Galli, G., Hofstetter, H. and Birnstiel, M.L. (1981) Two conserved sequence blocks within eukaryotic tRNA genes are major promoter elements. Nature, 294, 626-631.
- Folk, W.R., Hofstetter, H. and Birnstiel, M.L. (1982) Some bacterial tRNA genes are transcribed by eukaryotic RNA polymerase III. Nucleic Acids Research, 10, 7153-7162. doi:10.1093/nar/10.22.7153