Advances in Bioscience and Biotechnology
Vol.3 No.4(2012), Article ID:21854,8 pages DOI:10.4236/abb.2012.34049
Optimization of the bioconversion of glycerol to ethanol using Escherichia coli by implementing a bi-level programming framework for proposing gene transcription control strategies based on genetic algorithms
![]()
1Grupo de Diseño de Productos y Procesos (GDPP), Department of Chemical Engineering, Universidad de los Andes, Bogotá, Colombia
2Multiscale and Multiphysics Modeling Lab, Department of Chemical Engineering, Virginia Polytechnic Institute and State University, Blacksburg, Virginia
Email: andgonza@uniandes.edu.co
Received 25 May 2012; revised 28 June 2012; accepted 7 July 2012
Keywords: Bi-Level Optimization; Escherichia coli; Metabolic Flux Analysis; Genetic Algorithm
ABSTRACT
In silico approaches for metabolites optimization have been derived from the flood of sequenced and annotated genomes. However, there exist still numerous degrees of freedom in terms of optimization algorithm approaches that can be exploited in order to enhance yield of processes which are based on biological reactions. Here, we propose an evolutionary approach aiming to suggest different mutant for augmenting ethanol yield using glycerol as substrate in Escherichia coli. We found that this algorithm, even though is far from providing the global optimum, is able to uncover genes that a global optimizer would be incapable of. By over-expressing accB, eno, dapE, and accA mutants in ethanol production was augmented up to 2 fold compared to its counterpart E. coli BW25113.
1. INTRODUCTION
It is a fact that systems biology is allowing the brainstorming for systematic approaches regarding the implementation of methods to optimize the synthesis of metabolites [1]. Cells have been employed as miniaturized chemical plants that produce various chemicals towards our benefits. Nevertheless, bio-based processes are generally inefficient due to the limited metabolic capacity of the cell towards the production of a desired product because the objective of microbial metabolism is different from ours [2].
Molecular biology and metabolic engineering have emerged to provide the tools to reorient the objective of the cell. On one hand, metabolic engineering looks for gene candidates susceptible of cloning. On the other hand, genomics, metabolomics, and proteomics are currently easing the implementation of mathematical models aiming to predict reaction rates. These predictions allow to rationally choosing genes candidates for cloning or deleting. Metabolic fluxes represent the metabolic pathways and help to integrate these factors through a mathematical framework [2].
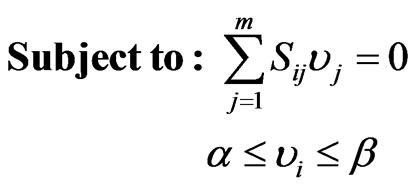
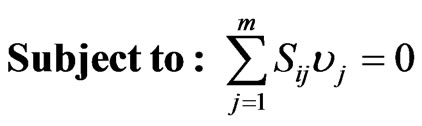
Flux balance analysis (FBA) is a technique based on mass balances around intracellular metabolites under the pseudo-steady state assumption. Constraints-based flux analysis is a general term for optimization-based simulation techniques [2], all mostly based on linear programming due to the lineal nature of the problem. Basically, the optimization problem is based on the reactions stoichiometric, inequality restrictions regarding particular metabolic flux, and a cellular objective. In general the optimization problem can be formulated as follows:
 (1)
(1)
 (2)
(2)
FBA models typically invoke the optimization of a particular cellular objective such as ATP production, biomass formation, and minimization of metabolic adjustment; subject to network stoichiometry aiming a flux distribution [3]. Specifically, Eq.2 represents the mass balance constraints in a metabolic network where  is the
  stoichimetric matrix (
 corresponds to the number of metabolites and
  stands for the number of fluxes); and the constraints imposed on the magnitude of individual metabolic fluxes in order to take into account its reversibility or irreversibility [4]. Many efforts have been published related to quantifying each flux in the model as it hypothesizes what is the purpose of the cell when growing in a specific environment. In that matter, Knorr et al. [5] proposed a bayesian-based selection model to select metabolic objective functions departing from several hypotheses. Finally, their fitness was tested by comparing the flux obtained with previously published microarrays results [6].
In order to identify multiple gene deletions Burgard et al. [7] based on the duality theory, transformed the bilevel formulation into a single level MILP. These approaches felt in limitations because they are only capable of proposing deletions based on binary variables. Molecular biology makes available means to control the expression of specific genes through cloning so genes overexpression is now possible. Pharkya and Maranas [8] transcribed this possibility into an algorithm that propose which gene’s transcription should be controlled (up or down-regulation) to maximize productivity [8].
We believe that all these methods are mainly concerned about finding the global minimum. However, model predictions and experimental fluxes disagree. Algorithms based on evolutionary programming present several advantages that could be boosted when maximizing metabolites using FBA. For example, genetic algorithms offer a considerable amount of individuals which are not necessarily related to the global but the first level predicts an augment in metabolite synthesis. In that regard, genetic algorithm was utilized to find gene deletions in Sacharomyces cerevisae [9] which was found to be robust and low intensive compared to the dual problem approximation. In order to complement the former study, we evaluated the performance of an optimization framework that proposes gene modulation instead of deletions in Escherichia coli (E. coli) glycerol fermentations to obtain ethanol. Finally, several non-global optimum individuals were experimentally evaluated to demonstrate the misleading fact of finding the global.
2. MATERIALS AND METHODS
2.1. First Level Platform Implementation
First level platform utilized is based on the stoichiometry model reported by Reed et al. [6]. In order to solve the LP problem (Eq.1) optimization tool COBRA developed in Matlab® [10] was utilized implementing a simplex algorithm with cellular growth of the microorganism as cellular objective function (Eq.3) as follows:
 (3)
(3)
 (4)
(4)
where  and
and  are upper and lower bounds reported by Reed et al. [6].
2.2. Second Level Implementation
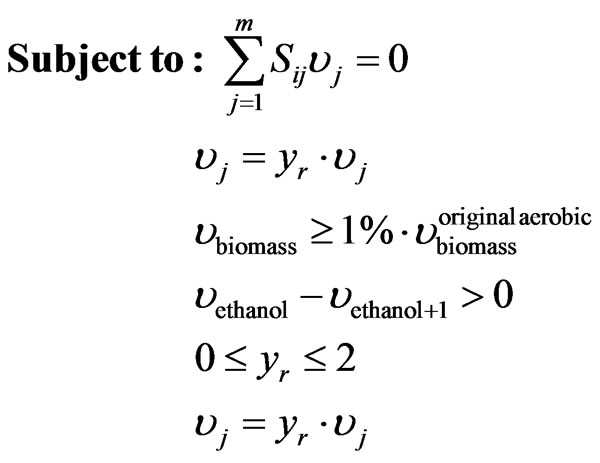
The optimization of the production of a specific biochemical mostly disagrees with the intention of the cell as its main interest constitutes to develop mechanisms to maximize the amount of biomass. This fact requires the use of a bi-level platform that consider both biomass synthesis and in our case ethanol production. The formulation of the optimization problem can be posed as:
 (5)
(5)
 (6)
(6)
where  is the stoichiometric coefficient of metabolite
  in reaction
 ,
,  represents the flux of reaction
 ,
,  represents the over-expression, knockout or regulation of a flux. The last two restrictions in the inner cycle of the optimization platform refer to the minimum growth of biomass which corresponds to the 1% of the microorganism’s growth under aerobic conditions and the acceptance or rejection of the mutation for the next generation.
For the solution of the former problem a genetic algorithm (GA) was developed. This method is a specific case of evolutionary algorithms. First, GA randomly generates an initial population. Then, a serial of selections of new generations are made based on the first population established by employing two types of children: elite and mutated and crossovered. Individuals are chosen based on comparing the ethanol flux value for the actual individual with the value obtained in a previous iteration. If the value of the actual individual is greater, then the mutation is accepted. Hence, the optimization platform capable of giving a gamma of mutated strains with an optimal cellular growth and chemical production proceeds as follows (Figure 1):
1) Selection of the initial point: wild type metabolic model is solved and these fluxes are initially selected to propose the next generation.
2) Generation of a population of 500,000 individuals, which are organized raw vectors with the vector flux dimensionality (1075 × 1). Each position contains a
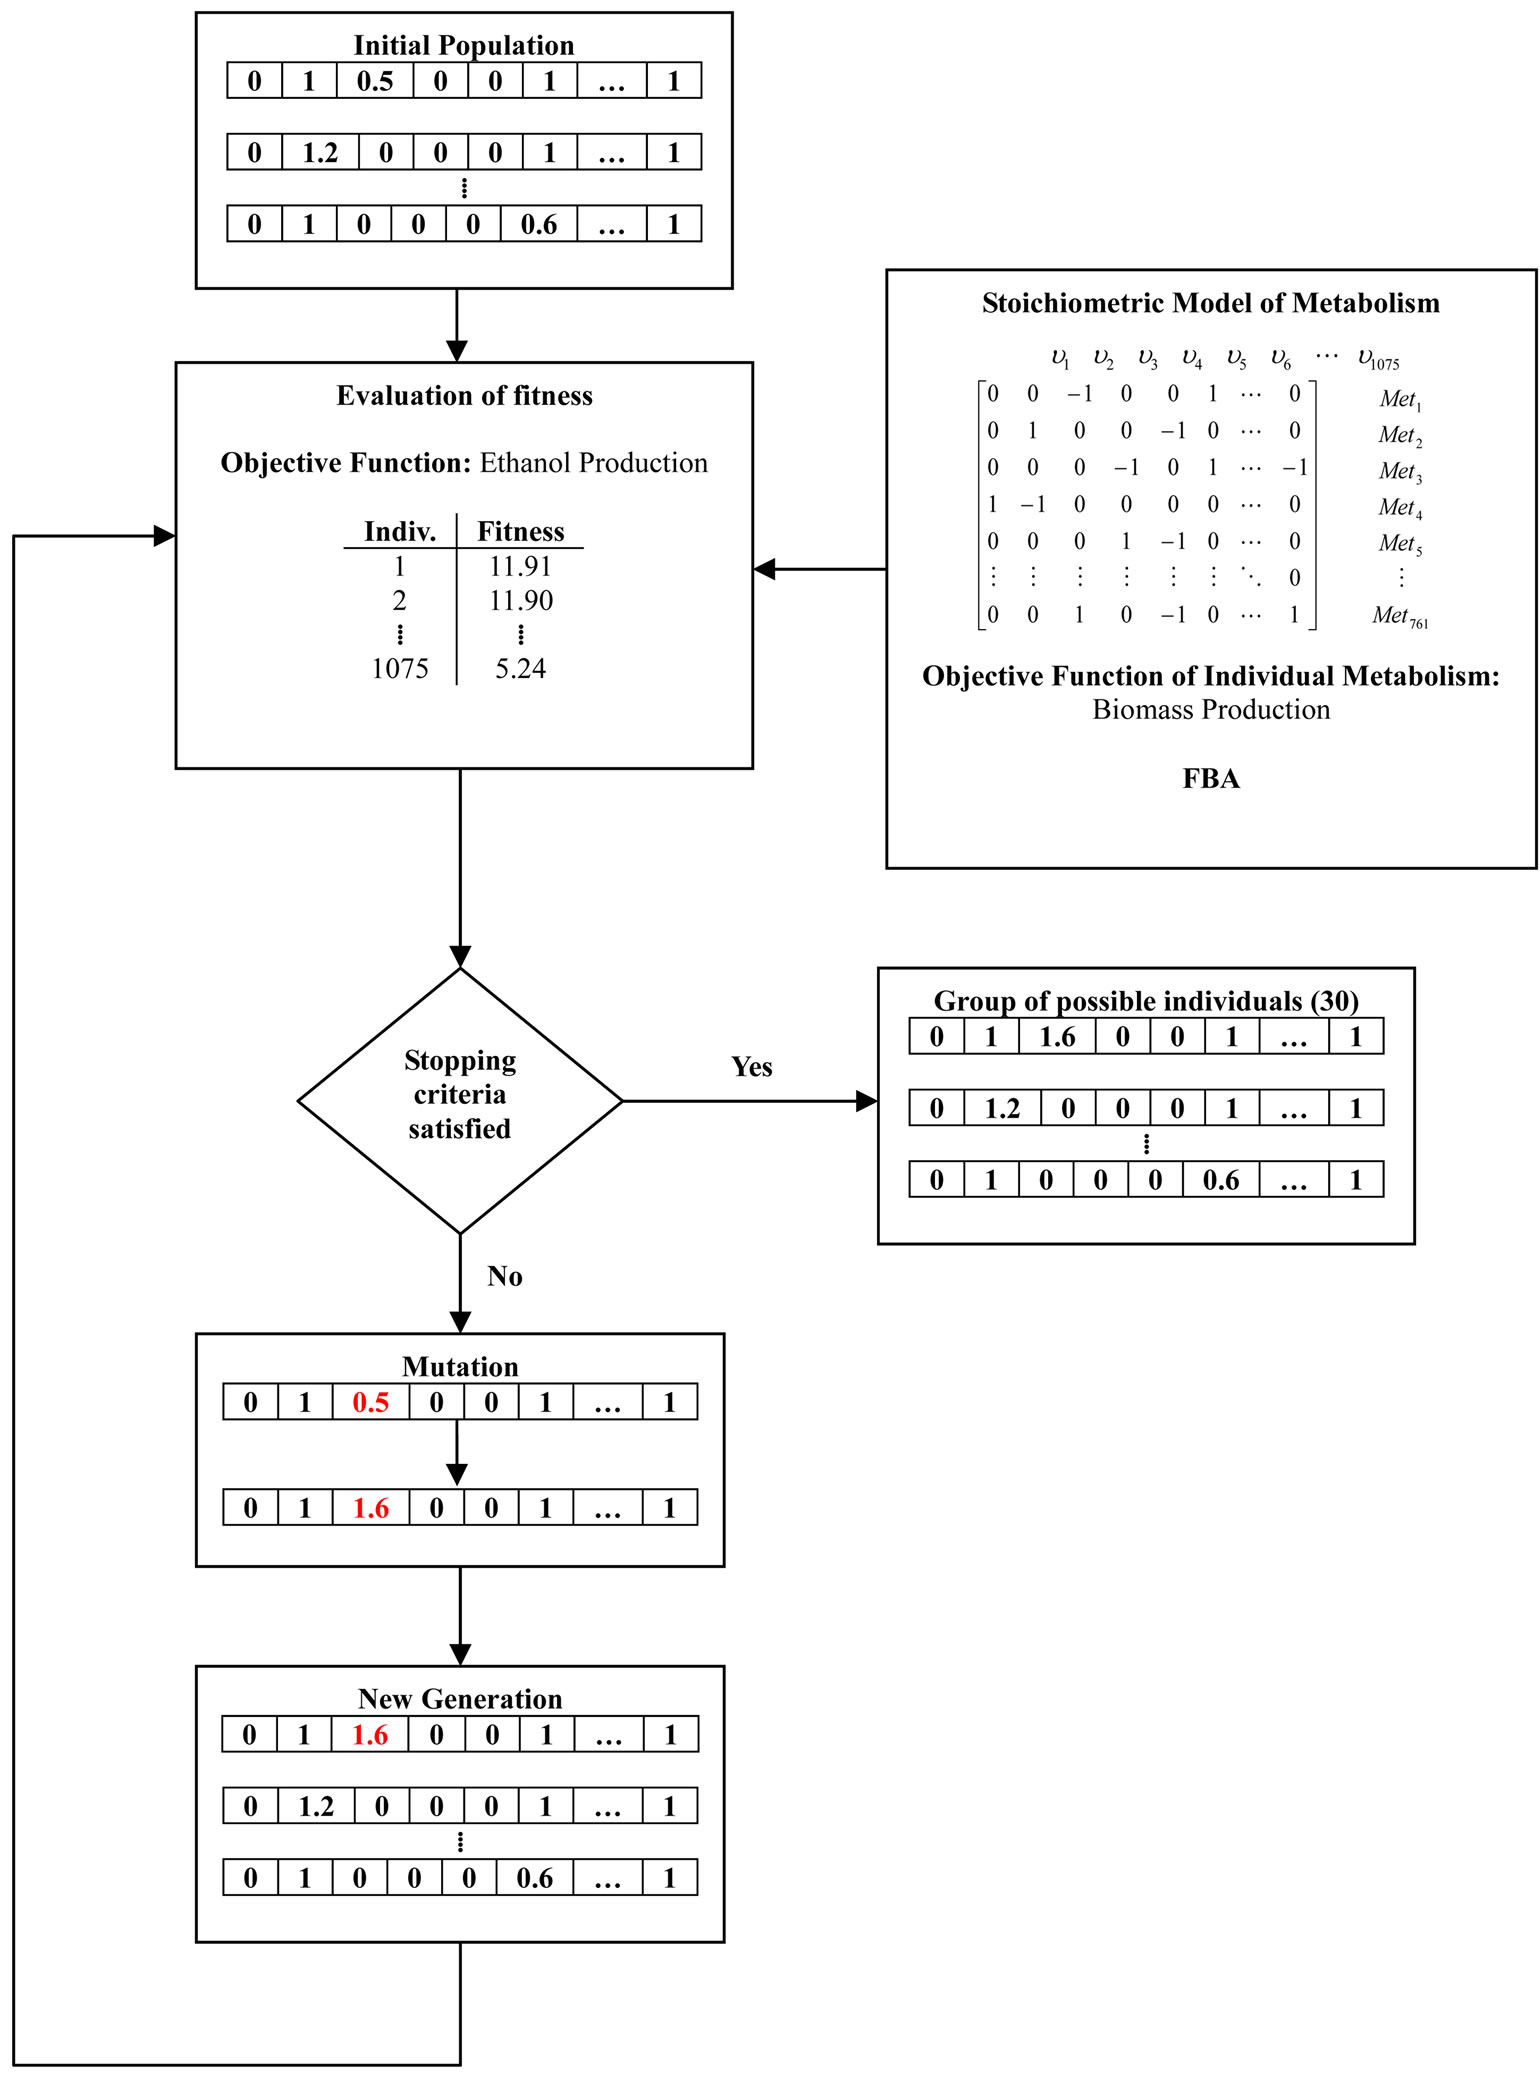
Figure 1. Flow diagram of the genetic algorithm to determine gene candidates and regulation for maximizing the production of ethanol from glycerol based on in silico modeling in Escherichia coli.
number in the [0, 2] interval chosen with a uniform random generator number. A product between this vector and the vector flux is calculated to finally generate the individual. Cero accounts for deletion, [0, 1) accounts for repression and [1, 2] for over-expression.
3) Each flux vector is treated as a single MFA optimization problem.
4) Ethanol flux results are ordered for each individual and the top 250,000 are selected 5) New generation is generated based on mutations and crossover operations and go to step 3.
6) Stop when the number of iterations previously is reached.
This algorithm was implemented in Matlab® in a Dell OptiPlex 780 Desktop with a Intel® Core™ 2 Duo E7600 @ 3.06 GHz 3.07 GHz processor. The time running total time was approximately 3 hours after 115 overall iterations.
2.3. Experimental Validation with Glycerol E. coli Fermentations
Taking into account the increasing interest from the biofuel industry towards ethanol production, the manufacture of this chemical using E. coli’s metabolic pathway growing in a glycerol medium was the selected as a case of study (see formulation optimization problem Eqs.5 and 6). After running 115 overall iterations with a neglected crossover rate and variable mutation rate as it depended on the population size taking in to account what Jennison and Sheehan found (1995) we obtained 30 individuals (Table 1).
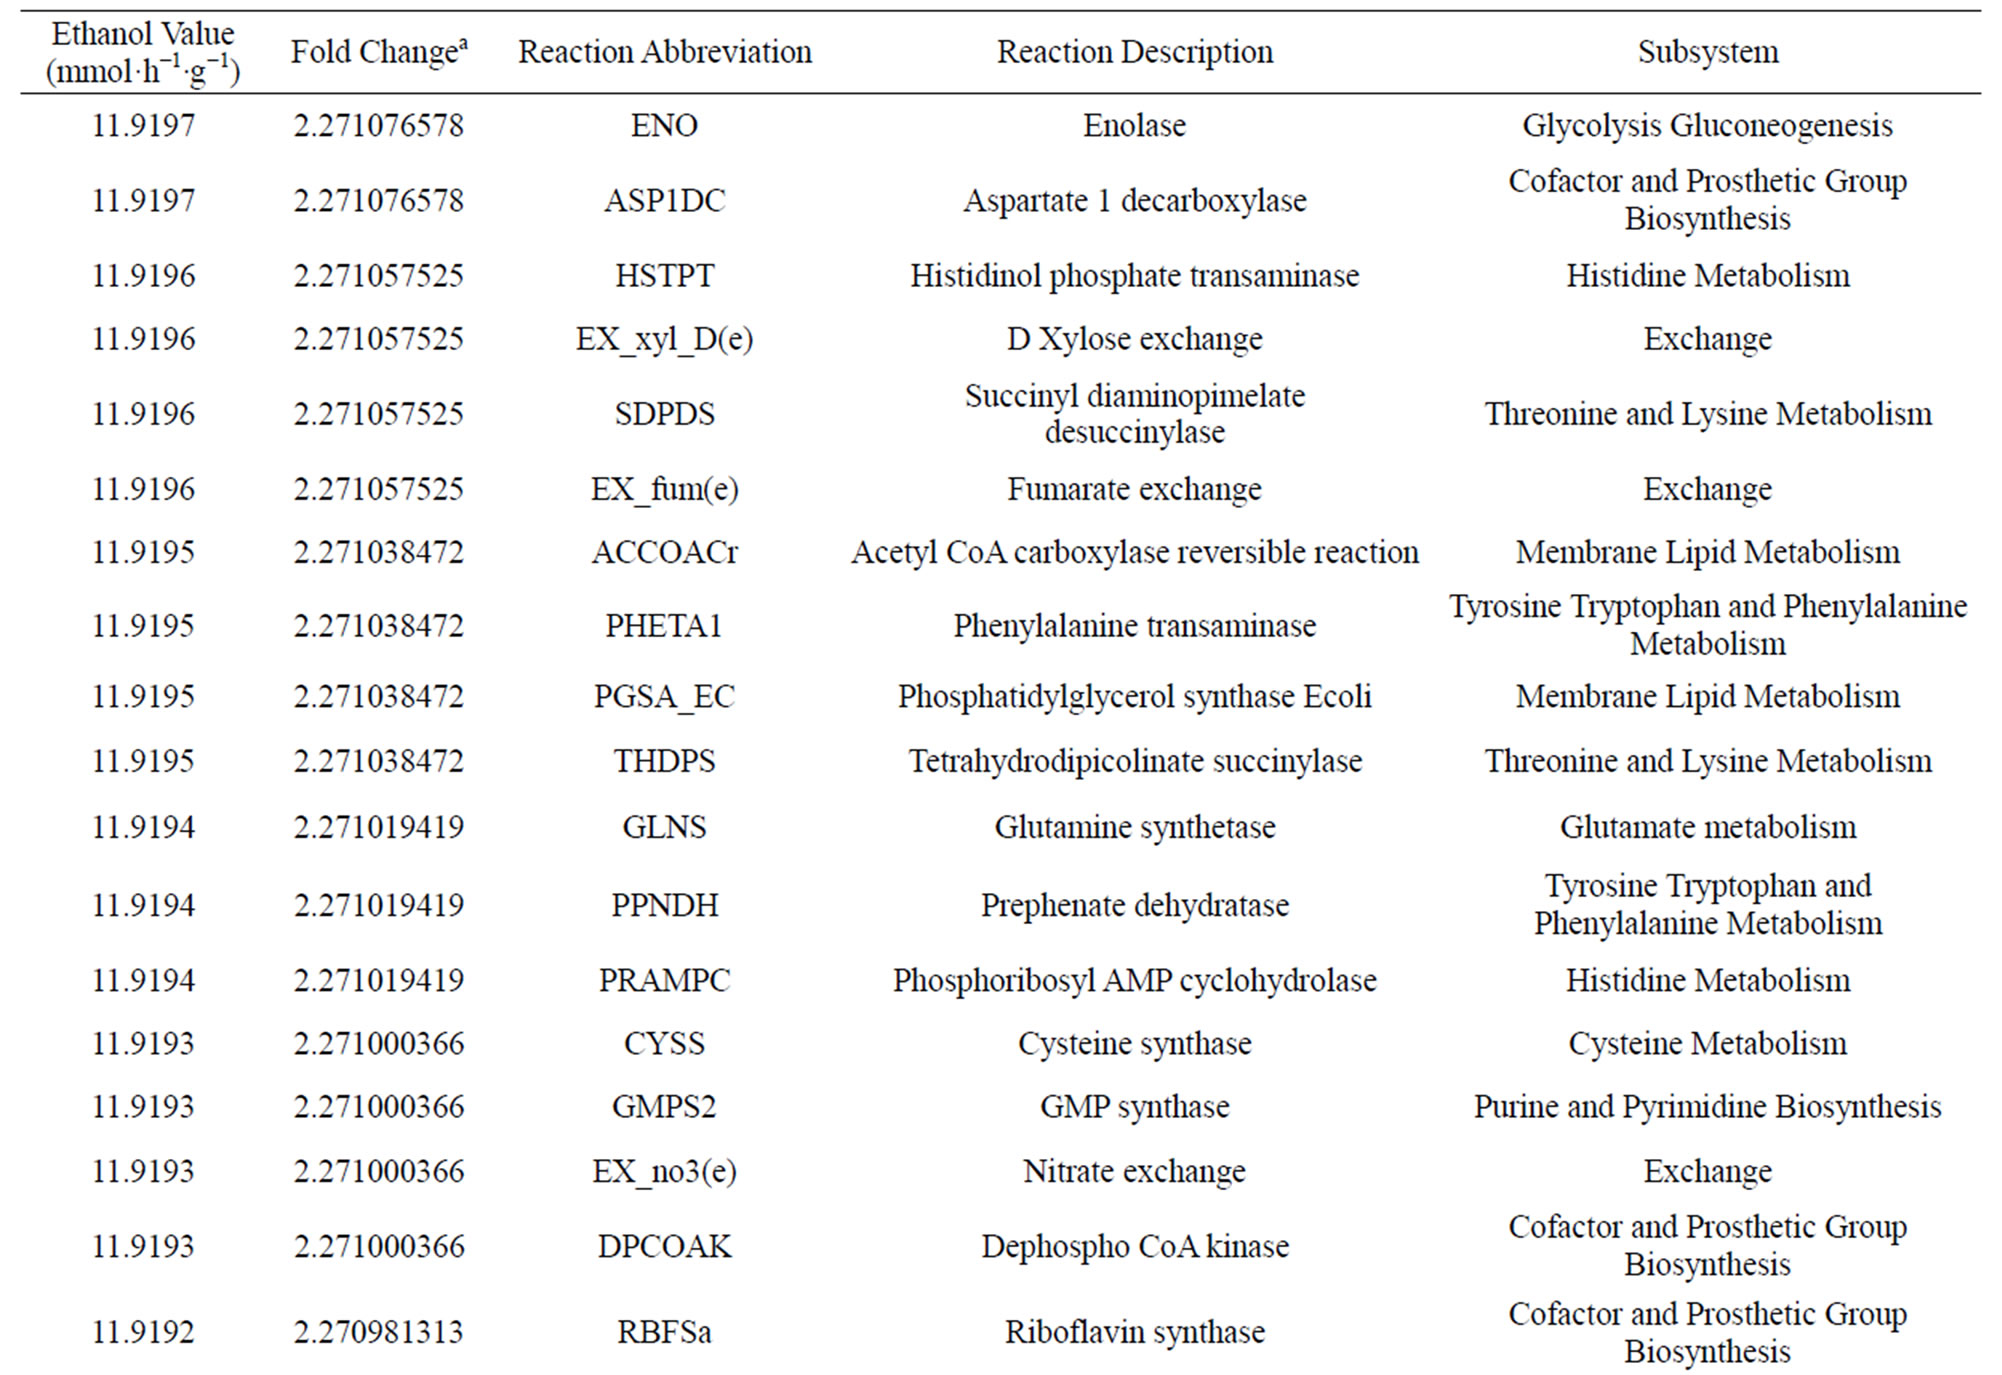
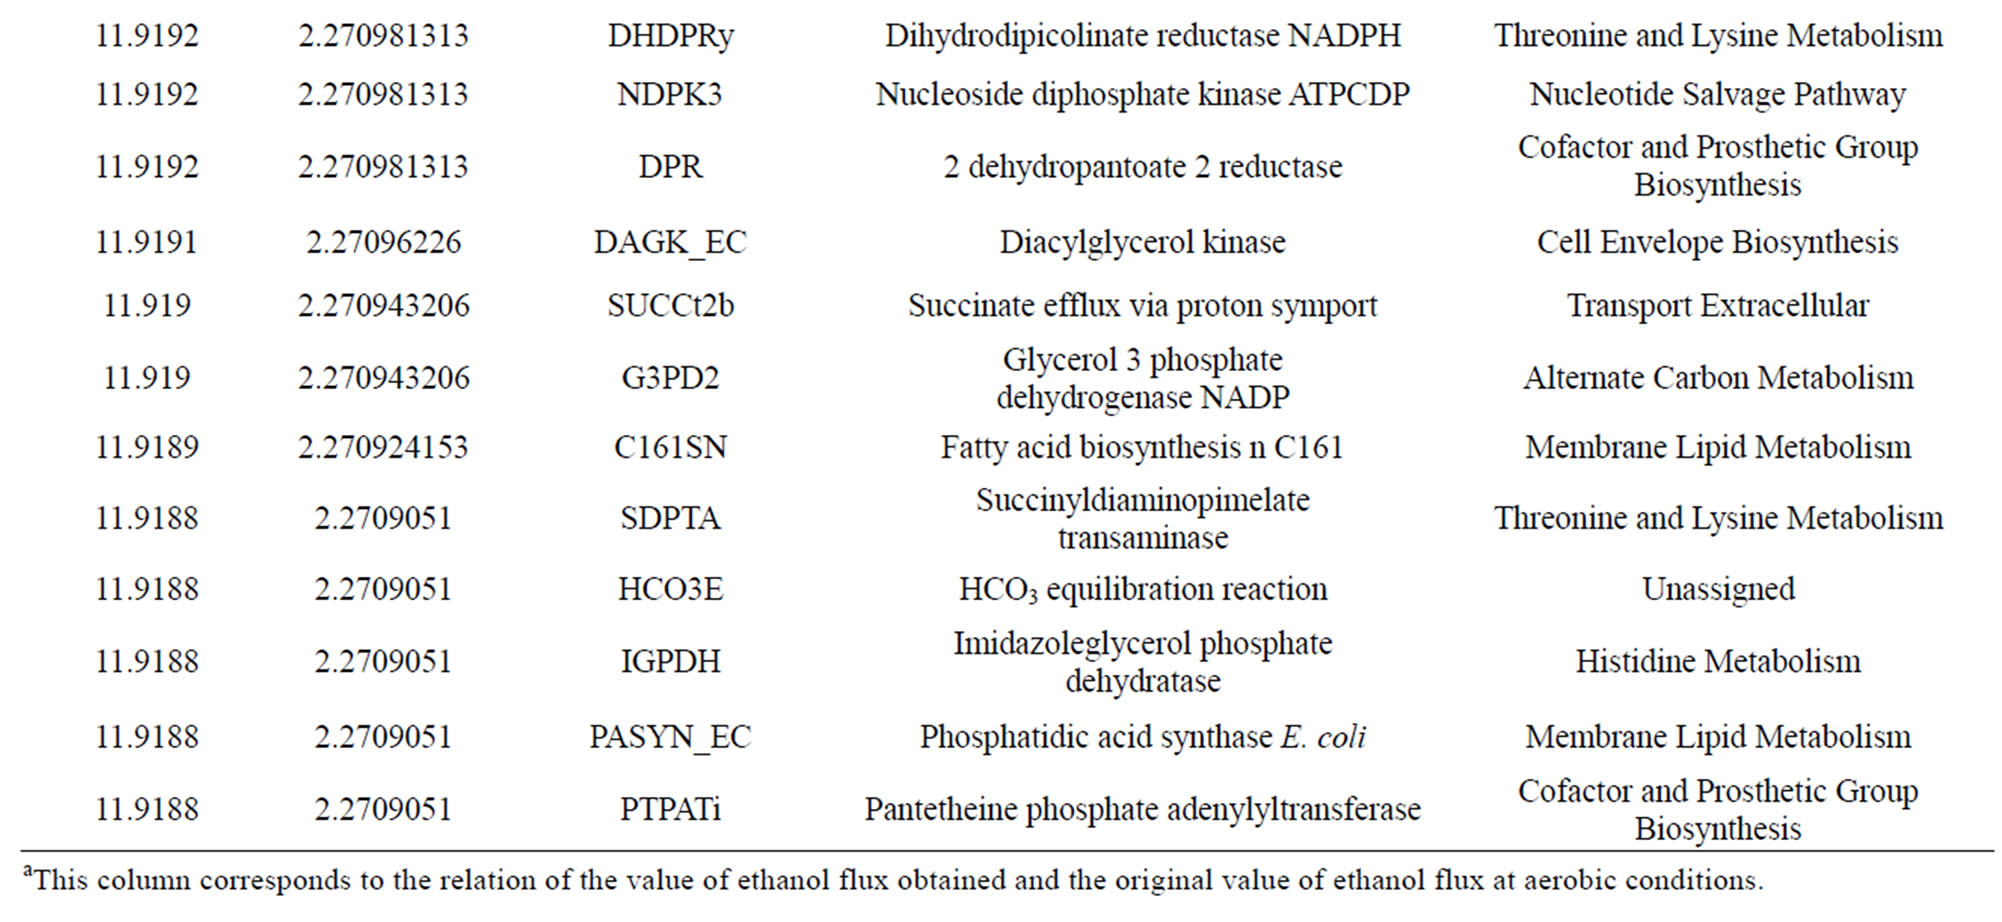
Table 1. Results from the bi-level optimization platform.
2.4. E. coli Fermentations Setup
2.4.1. Microorganism and Media
E. coli strains were obtained from ASKA clones library [11] which encompasses all E. coli W3110 OFR in the plasmid pCA24N (Table 2 and Figure 2) to evaluate the effect of the over-expression of specific genes. The strains were kept in 32.5% glycerol stocks at −80˚C. E. coli cells were initially streaked on Luria-Bertani (LB) agar plates [12] containing 50 μg/mL chloramphenicol (for those containing pCA24N-based plasmids), and incubated at 37˚C. Wild-type E. coli K-12 BW25113 was obtained from the Yale University CGSC Stock Center.
2.4.2. Fermentations
Strains (stored as glycerol stocks at −80˚C) were streaked onto LIU medium [13] (8 g/L Yeast Extract, 3 g/L KH2PO4, 3 g/L K2HPO4, 1 g/L (NH4)2SO4, 0.41 g/L CaCl2, 0.3 g/L MnSO4, 4 g/L Glucose, 8 g/L MgSO4, and 50 μg/mL chloramphenicol, where appropriate) plates and incubated overnight at 37˚C. A single colony was used to inoculate 250 mL Erlenmeyer flask filled with 25 mL LIU medium. The flasks were incubated at 37˚C, 250 rpm overnight. Then, in order to obtain ethanol, fermentations were performed in a 250 mL Erlenmeyer flask containing 10 mL of modified LIU medium (8 g/L Yeast Extract, 1 g/L (NH4)2SO4, 0.41 g/L CaCl2, 0.3 g/L MnSO4, 8 g/L MgSO4, 20 g/L Glycerol, 2 g/L Lactose, and 50 μg/mL Chloramphenicol, where appropriate) at 37˚C, 200 rpm for 2 days in an Orbital MRC® Shaker. Anaerobic conditions were maintained by flushing the headspace with ultrahigh purity nitrogen at 0.01 LPM. Four repetitions were made for each gene. Lactose was utilized as an inducer for scaling-up matters considering the cost of the typical inducer (Isopropyl β-D-1-thiogalactopyranosid).
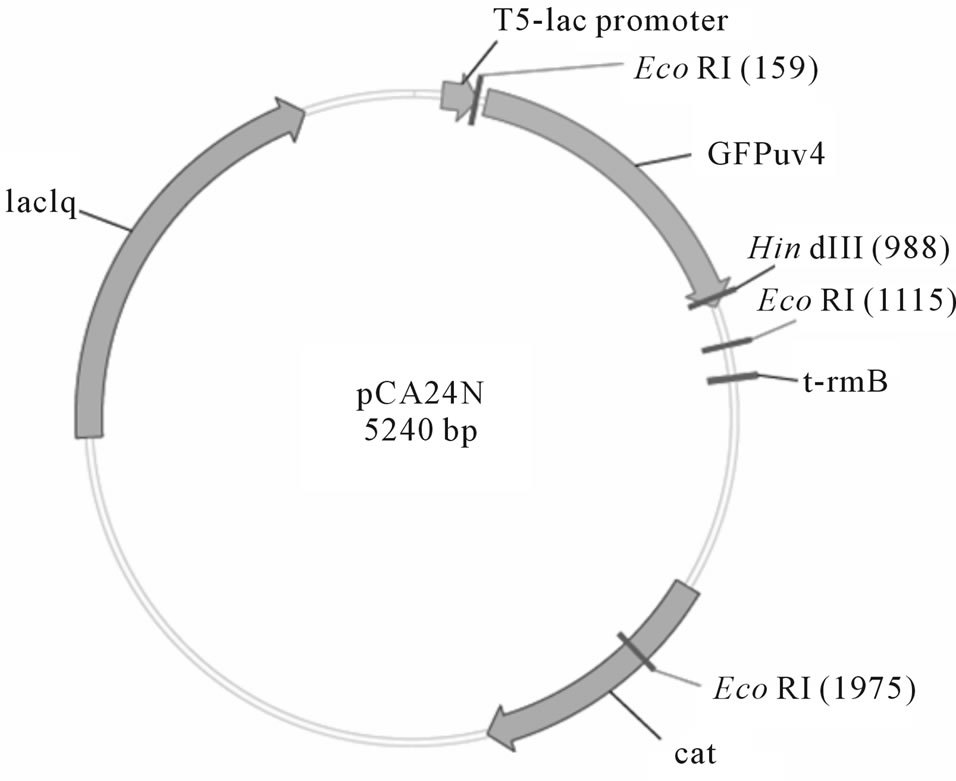
Figure 2. Cloning vector map of pCA24N.
2.5. Biomass
A genesis 10 UV Tremoelectron Corporation® spectrophotometer was used to determine Optical Density in cultures at 550 nm and used as an estimate of cell concentration (1 OD = 0.34 gDW/L). Growth rate was calculated assuming a cero or first order kinetics based on experimental results.
2.6. Ethanol
Near infrared spectroscopy (NIR) was utilized to quantify the ethanol during the fermentation (FOSS® NIR System 6500). To perform the calibration, E. coli fermentations were performed in 250 ml Erlenmeyer flasks during four days, the samples were centrifuged for 4 hours at 4000 rpm at 4˚C. The supernatant was heated for 60 minutes at 45˚C to remove ethanol in the samples and ethanol was added at different concentrations. One independent calibration was plotted. The calibration curve showed a linear correlation with the following characterristics: slope of –1209.4952, intercept 0.2419 and a r2 value of 0.8464.
2.7. Glycerol
An Analogue Zhifong® Refractometer was utilized to quantify the glycerol during the fermentation. To perform the calibration, fermentations were developed in 250 mL Erlenmeyer flasks during four days, the samples were centrifuged for 4 hours at 4000 rpm at 4˚C. Glycerol was added to the supernatant at different concentrations. One independent calibration was plotted. The calibration curve showed a polynomial correlation with the following characteristics: a0 of 175746, a1 of –264298, a2 of 99366 and an r2 value of 0.8464
3. RESULTS AND DISCUSSION
3.1. Genetic Algorithm Results
500,000 individuals were generated to finally obtain 30 individuals (Table 1). Interestingly, these mutants are not directly related to ethanol synthesis, so GA reaches to uncover non-obvius genes to optimize ethanol synthesis. First, we solved the wild LP problem to establish an initial point. The original value for ethanol production in E. coli at anaerobic conditions corresponds to 524 mmol·h−1·g−1. Then, after running the GA over 115 overall iterations, we found genes whose regulation falls in [0.0557, 0.0591] flux ethanol interval. Interestingly, GA predicts overexpression for all genes found, possibly due to restrictions imposed on the optimization problem regarding growth velocity.
3.2. Equations
We tested all 30 genes proposed to observe yields after
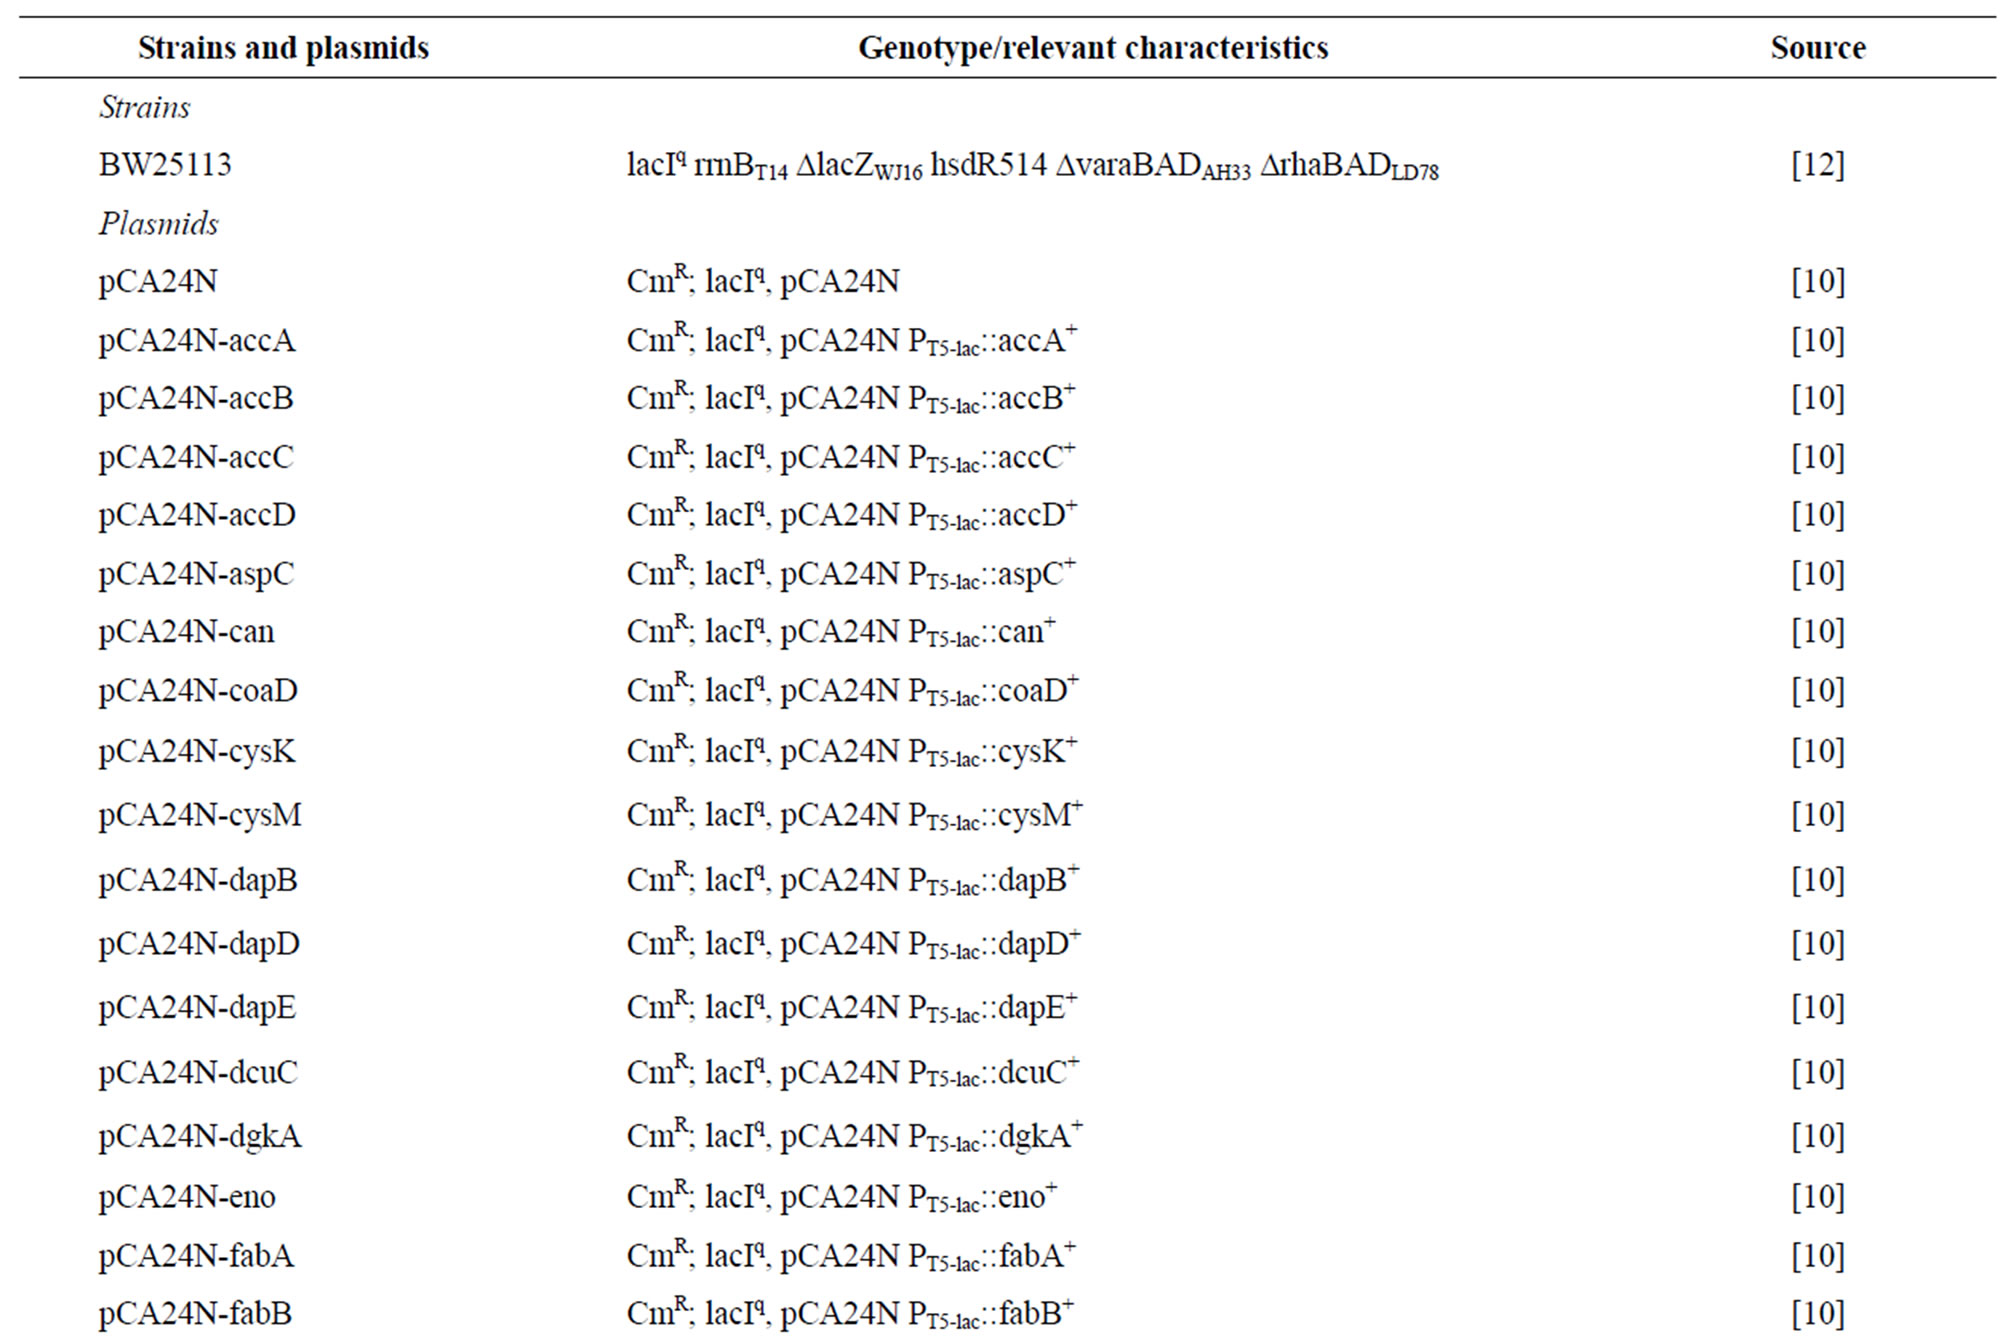
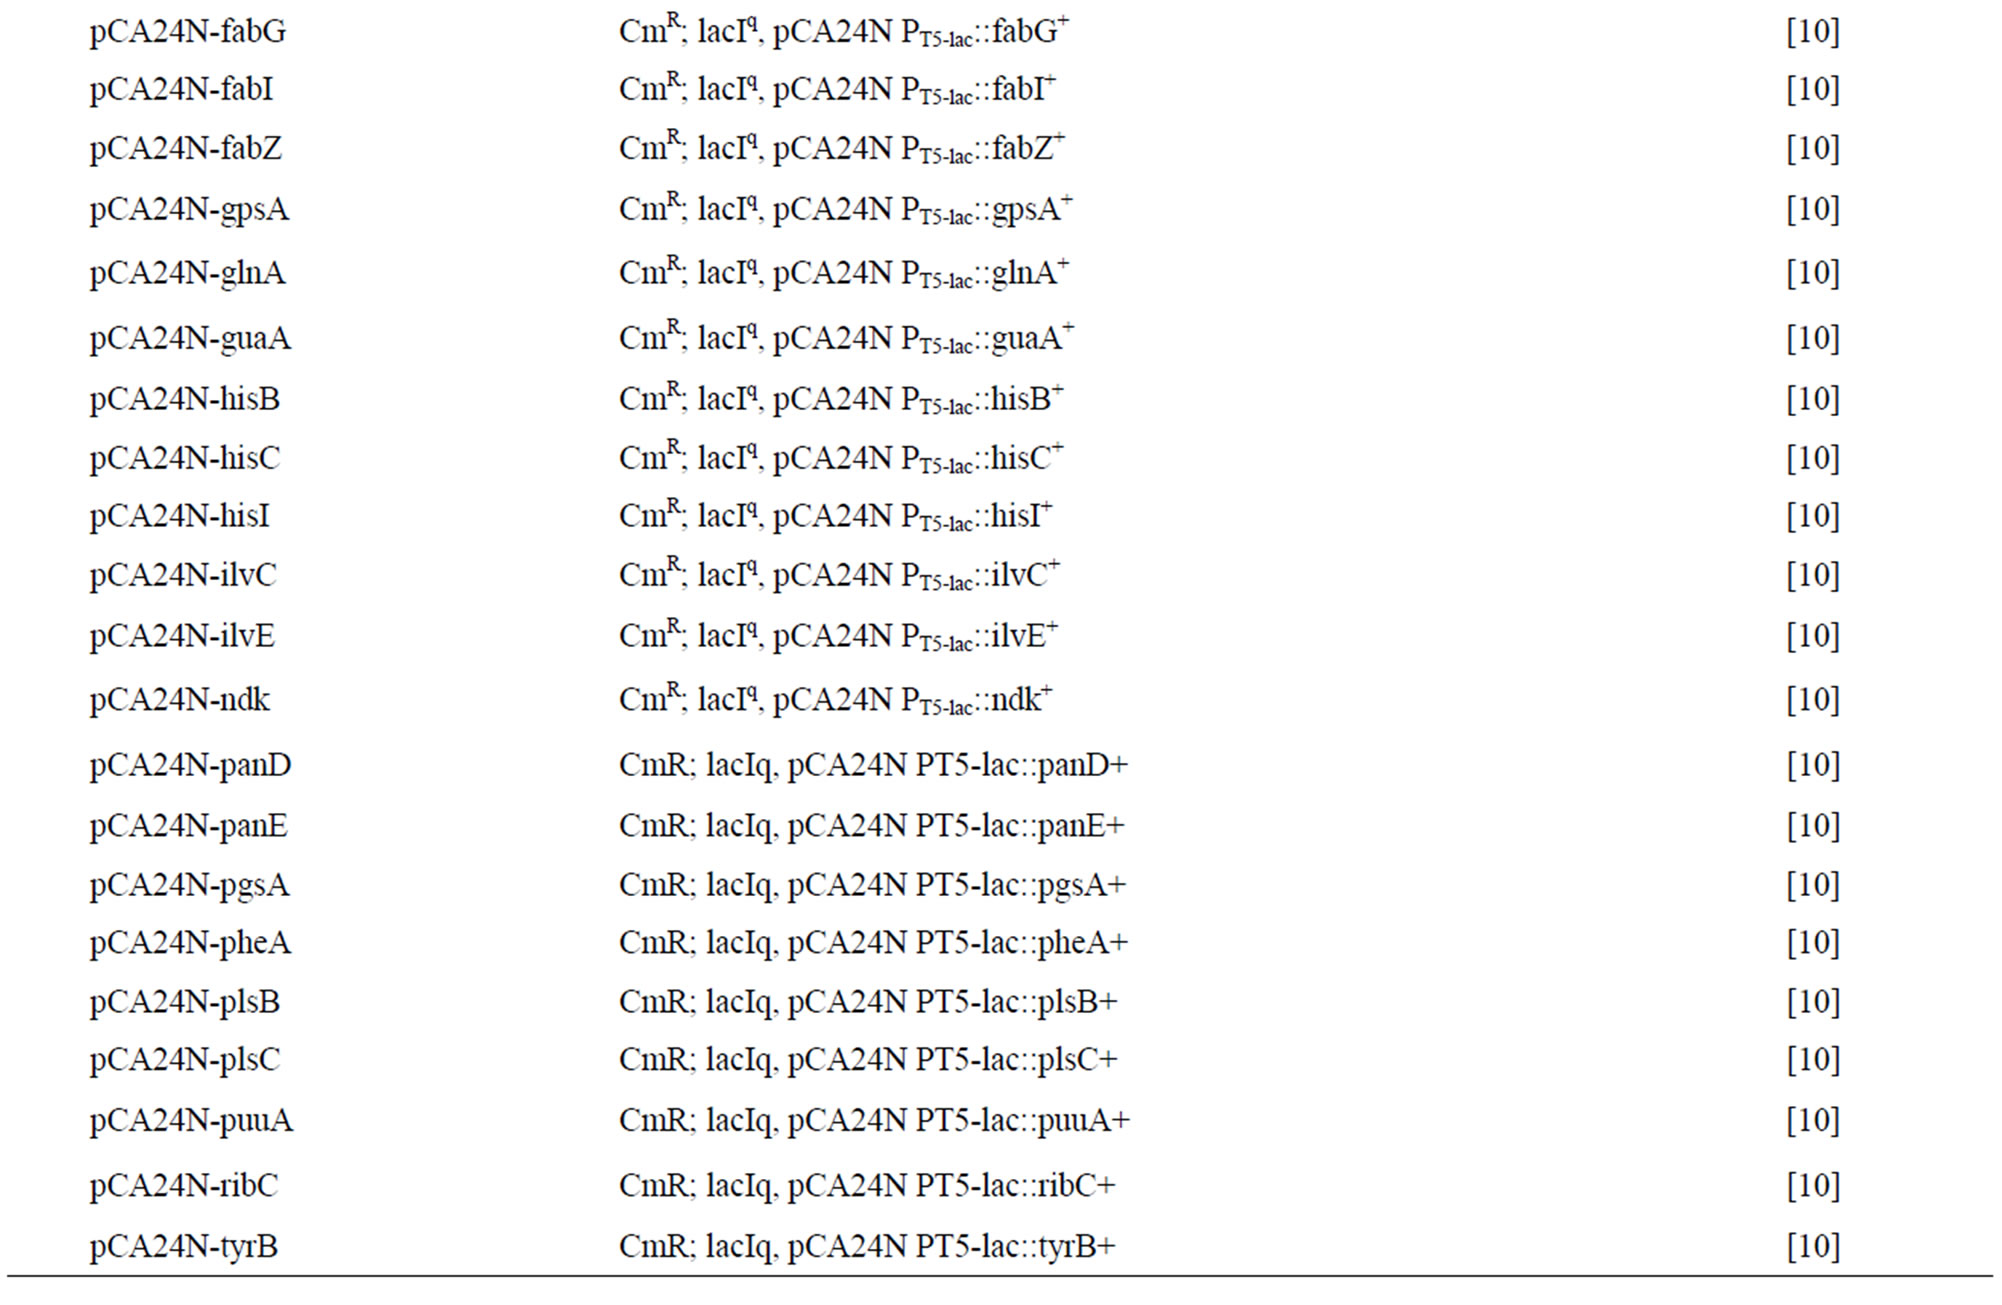
Table 2. Escherichia coli bacterial strains and plasmids used in this study. CmR is chloramphenicol resistance.
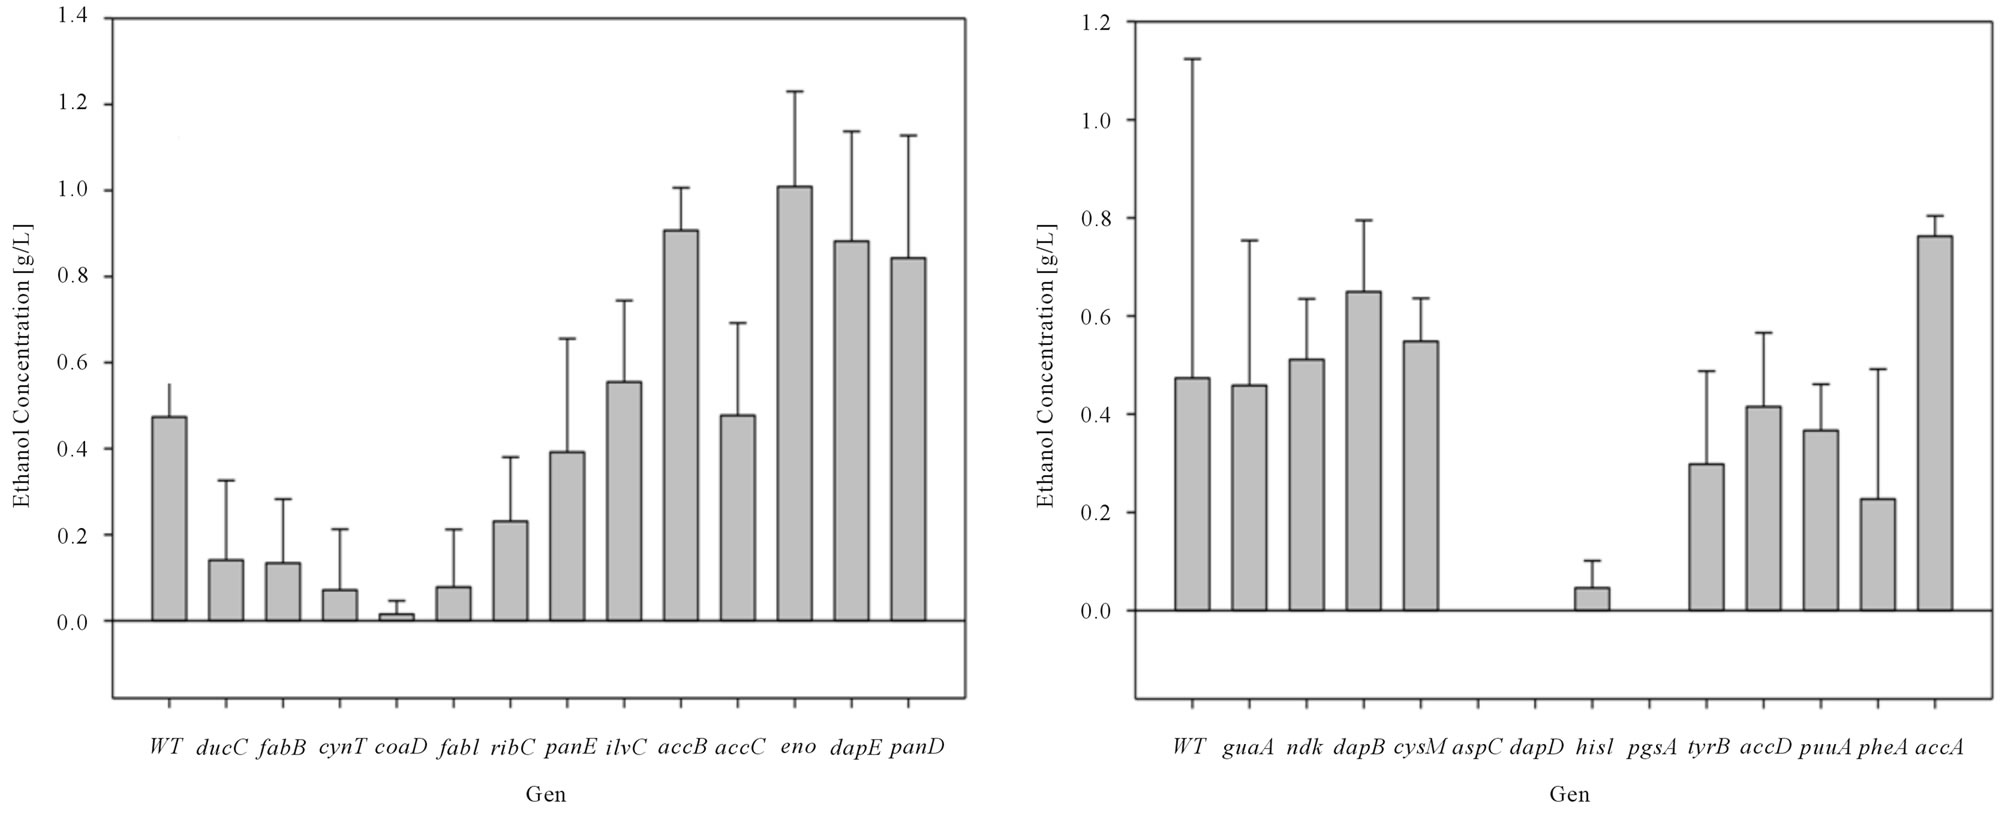
inducing the expression of the genes finding (Figure 3(a)-(c)). Bacterial growth rate showed general zero order kinetics for all cases (results not shown) falling within [0.05 0.07 h−1] range. Specifically, over-expressed dcuC, aspC, gpsA, glnA, ilvE and hisB mutants displayed a higher growth rate, this effect is deepened to lactose concentration.
The results obtained for ethanol production presented a positive effect when inducing expression on ethanol yield. For example accB, eno, dapE, and accA induction
 (a)
(a)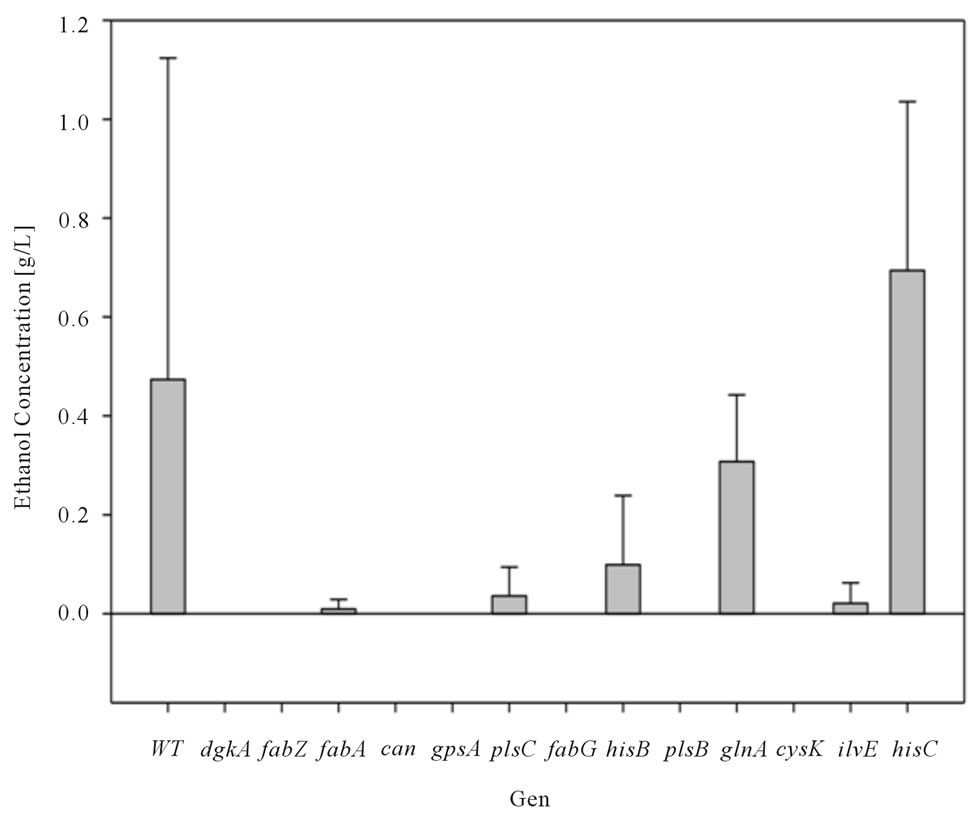 (b)
(b)
Figure 3. (a) Ethanol Concentration for E. coli BW25113 (Wild Type: WT), E. coli W3110/pCA24N-dgkA+, E. coli W3110/ pCA24N-fabZ+, E. coli W3110/pCA24N-fabA+, E. coli W3110/pCA24N-can+, E. coli W3110/pCA24N-gpsA+, E. coli W3110/ pCA24N-plsC+, E. coli W3110/pCA24N-fabG+, E. coli W3110/pCA24N-hisB+, E. coli W3110/pCA24N-plsB+, E. coli W3110/ pCA24N-glnA+, E. coli W3110/pCA24N-cysK+, E. coli W3110/pCA24N-ilvE+ and E. coli W3110/pCA24N-hisC+ fermentations at constant lactose dose (2 g/L) (b) Ethanol Concentration for E. coli BW25113 (Wild Type: WT), E. coli W3110/pCA24N-guaA+, E. coli W3110/pCA24N-ndk+, E. coli W3110/pCA24N-dapB+, E. coli W3110/pCA24N-cysM+, E. coli W3110/pCA24N-aspC+, E. coli W3110/pCA24N-dapD+, E. coli W3110/pCA24N-hisI+, E. coli W3110/pCA24N-pgsA+, E. coli W3110/pCA24N-tyrB+, E. coli W3110/pCA24N-accD+, E. coli W3110/pCA24N-puuA+, E. coli W3110/pCA24N-pheA+ and E. coli W3110/pCA24N-accA+ fermentations at constant lactose dose (2 g/L) (c) Ethanol Concentration for E. coli BW25113 (Wild Type: WT), E. coli W3110/pCA24NdcuC+, E. coli W3110/pCA24N-fabB+, E. coli W3110/pCA24N-cynT+, E. coli W3110/pCA24N-coaD+, E. coli W3110/pCA24NfabI+, E. coli W3110/pCA24N-ribC+, E. coli W3110/pCA24N-panE+, E. coli W3110/pCA24N-ilvC+, E. coli W3110/pCA24N-accB+, E. coli W3110/pCA24N-accC+, E. coli W3110/pCA24N-eno+, E. coli W3110/pCA24N-dapE+ and E. coli W3110/pCA24N-panD+ fermentations at constant lactose dose (2 g/L). Mean and standard deviation was calculated from four repetitions at each condition. Standard deviation obtained was in the range of 1.6032 and 0.0995.
caused a minimum of 1.5 fold increase compared to its counterpart E. coli BW25113.
We did not find a direct cause that could explain the ethanol yield increment through overexpressing those genes as they are involved in non-direct metabolic pathways: accB and accA in fatty acid biosynthesis, eno in glycolysis and dapE in lysine biosynthesis. The complexity of the connectivity of the metabolic network in a microorganism does not allow to elucidate trough a first view all the candidates susceptible of modifying its expression so we believe that our approach constitute an interesting way elucidate stratagems for increasing ethanol synthesis by uncovering the underpinnings of the network.
4. CONCLUSION
Mostly all the previous work related to the optimization of the production of ethanol using metabolic engineering are mainly concerned about the global maximum. In spite of this, the model predictions and experimental results disagree. Considering that algorithms based on evolutionary programming could offer a considerable amount of individuals which are not necessarily related to the global maximum, we developed a bi-level platform able to maximize both biomass and ethanol production. Although in silico approaches are still incapable of predicting the exact experimental results due to the fact that not all variables can be considered, our main objective was to look for an answer different from single solutions. Interestingly, we found out that our platform in fact uncovered genes that were not directly related to ethanol synthesis such as accB, eno, dapE, and accA.
5. ACKNOWLEDGEMENTS
We appreciate the support of the National BioResource Project (NIG, Japan): E.coli Strain for kindly providing us with the Keio Collection using for our experimental section. Also this work is funded by Vicerrectoria de investigaciones at Universidad de los Andes.
We also appreciate the support of Colciencias through the Program Jovenes Investigadores e Innovadores “Virginia Gutiérrez de Pineda”.
REFERENCES
- Glick, B.J. and Pasternak, J.J. (2003) The molecular biotechnology revolution. In: Molecular biotechnology: Principles and applications of recombinant DNA. ASM Press, Washington DC, 3-13.
- Kim, H.U., Kim, T.Y. and Lee, S.Y. (2008) Metabolic flux analysis and metabolic engineering of microorganisms. Molecular Biosystems, 4, 113-120. doi:10.1039/b712395g
- Burgard, A.P., Pharkya, P. and Maranas, C.D. (2003) OptKnock: A bilevel programming framework for identifying gene knockout strategies for microbial strain optimization. Biotechnology and Bioengineering, 85, 1-11.
- Edwards, J.S. and Palsson, B.O. (2000) Metabolic flux balance analysis and the in silico analysis of Escherichia coli k-12 gene deletions. BMC Bioinformatics, 1, 1-10. doi:10.1186/1471-2105-1-1
- Knorr, A.L., Jain, R. and Srivastava, R. (2007) Bayesian based selection of metabolic objective functions. Bioinformatics, 3, 351-357. doi:10.1093/bioinformatics/btl619
- Reed, J.L., Vo, T.D., Schilling, C.H. and Palsson, B.O. (2003) An expanded genome-scale model of Escherichia coli K-12 (iJR904 GSM/GPR). Genome Biology, 4, 1-12. doi:10.1186/gb-2003-4-9-r54
- Pharkya, P. and Maranas, C.D. (2005) An optimization framework for identifying reaction activation/inhibition or elimination candidates for overproduction in microbial systems. Metabolic Engineering, 8, 1-13. doi:10.1016/j.ymben.2005.08.003
- Brooke, A., Kendrick, D., Meeraus, D. and Raman, R. (2001) GAMS: A user’s guide. GAMS Development Corporation, Washington DC.
- Patil, K.R., Rocha, I., Försoter, J. and Nielsen J. (2005) Evolutionary programming as a platform for in silico metabolic engineering. BMC Bioinformatics, 6, 1-12. doi:10.1186/1471-2105-6-1
- Becker, S.A., Feist, A.M., Mo, M.L., Hannum, G., Palsson, B.Ø. and Herrgard, M.J. (2007) Quantitative predicttion of cellular metabolism with constraint-based models: The COBRA toolbox. Nature Protocols, 2, 727-738. doi:10.1038/nprot.2007.99
- Kitagawa, M., Ara, T., Arifuzzaman, M., Ioka-Nakamichi, T., Inamoto, E., Toyonaga, H. and Mori, H. (2005) Complete set of ORF clones of Escherichia coli ASKA library (a complete set of E. coli K-12 ORF archive): Unique resources for biological research. DNA Research, 12, 291- 299. doi:10.1093/dnares/dsi012
- Sambrook, J., Fritsch, E.F. and Maniatis, T. (1989) Molecular cloning, a laboratory manual. Cold Spring Harbor Laboratory Press, Cold Spring Harbor.
- Vallejo, F., González, A., Posada, A., Restrepo, A. and Orduz, S. (1999) Production of Bacillus thuringiensis subsp. medellin by batch and fed-batch culture. Biotechnology Techniques, 13, 279-281. doi:10.1023/A:1008974819161