Advances in Bioscience and Biotechnology
Vol.1 No.2(2010), Article ID:2090,9 pages DOI:10.4236/abb.2010.12017
Age changes in the anthropometric and body composition characteristics of the Bishnupriya Manipuris of Cachar district, Assam
![]()
Biological Anthropology Unit, Indian Statistical Institute, Kolkata, India.
Email: bmohan07@gmail.com; rsubrata@isical.ac.in
Received 8 March 2010; revised 12 March 2010; accepted 23 March 2010.
Keywords: Anthropometry; BMI; Fat; Age-changes
ABSTRACT
Generally all morphological physical features of human body change throughout ones life span, the rates of change are not constant and there are certain ages when anthropometric characteristics reach its peak. The maturity of the anthropometric characteristics varies among populations/communities and sexes due to genetic make-up, environment and other concomitants. Present study examined the nature and extent of age related changes in anthropometric and body composition characteristics among the adult Bishnupriya Manipuris of Cachar district, Assam. Some anthropometric data and body composition characteristics analysed and compared between/among 5- age cohorts to see age changes. Study results show significant age changes in some anthropometric characteristics and some body composition characteristics. However, age specific changes could not been determined due to small sample size.
1. INTRODUCTION
Changes in body structure and morphology in humans occurs over its lifetime. At every stage of life, there are physical changes in the human body. Although every person experiences growth and development uniquely, the patterns are similar for all humans but the rates vary (due to nutrition, exercise, environment etc). Generally, from age 20 to 35 years, most of the physical body dimension is in peak form. Changes that occur during early stages of life and through adolescence are known as growth and development, which is characterized by fast progress. On the other hand, changes that occur during adulthood are known as age changes, which is relatively slower than earlier phase [1].
It was thought that once the human body reached its adult size, all the body measurements remain constant for many years to come but there is no clear static point in actual age or particular time of human being, when the morphological body features do not change [2]. Developmental processes or changes in body morphology continue to occur after puberty. Genetic and environmental factors play a significant role in the whole process of change in the anthropometric characteristics during adulthood among individuals [3]. Susanne [4] pointed out that the process of formation and destruction are present in all stages of life, beginning from the conception to death and the ratio between these processes are different and it is difficult to assign a period or age of complete maturation and the beginning of aging process. Anthropometric characteristics provide a better understanding of the growth process by describing changes in the body size and morphology through ages. However, all the anthropometric characteristics do not reach its peak at the same time, at the same rate or at the same extent with other. The variation may be evident between anthropometric characteristics, between populations, or between sexes.
Though, nutritional status are supposed to have a great role in making all types of changes but the variation in the anthropometric and body composition characteristics in the adulthood are primarily due to osteological changes, changes in the fat and muscle tissue. Because of the cross-sectional nature of most of the anthropological studies on adults, it is difficult to separate the changes occur due to secular changes or from continuing growth or due to aging [4,5]. Anthropometric measurements on individual seem to attain their peak at different ages. In general, height reaches the peak early in the life (i.e. around 20 years of age), weight attains its peak after 30 years, circumferences and some functional characteristics reaches at and around the same time, width measurements reaches its peak later ages of life [6].
In view of the importance of age changes in the anthropometric characteristics of healthy adults, which help to understand the process of change and ultimately improve the knowledge. A large number of studies on age related changes have been conducted on different ethnic groups in India and abroad but majority of the studies have focused attention on the elderly population [7-13]. Very few studies have concentrated on age changes in anthropometric characteristics during adulthood [5,6,14-16].
In light of the above-mentioned studies, the present study examined the nature and extent of age related changes in anthropometric characteristics among the adult Bishnupriya Manipuris of Cachar district, Assam.
2. MATERIALS AND METHODS
A multi-disciplinary bio-medical research project was undertaken among the Bishnupriya Manipuris, who has been settled at Pakaipar, about 30 kilometers away from Silchar (capital town), Cachar district of Assam. Bishnupriya Manipuris of this area have been originally migrated from Manipur around 100 years before. Bishnupriya Manipuris are different from the Meiteis (dominant group of Manipur) in terms of language [17] and some physical features, although both the groups are hinduised and followers of lord Vishnu.
No statistical sampling of the households/individuals have been made, complete enumeration of the settlement have been done for demographic information. For anthropometric data, individual, who voluntarily agreed to participate in the study, have been incorporated in the sample (100 males and 146 females). Age of the individuals have been collected after verifying written record, those individuals who do not have birth record, their age was estimated by reference to important local events but those data have not been used in the present analyses. Initially, anthropometric data have been collected from 279 individuals but at the time of analysis data of 33 individuals have been excluded due to unavailability of proper birth record. Total 246 individuals have been classified into 5 groups of 10 years age cohort, i.e., <25, 25-34, 35-44, 45-54 and> 54. It would be ideal to make classification with each age but due to small number of samples it was not possible.
Data types include Socio-demographic characteristics of the individuals studied like age, sex, education, occupation and per capita monthly expenditure as well as their anthropometric measurements. Socio-demographic data collected through household census schedule from 122 households. Anthropometric data have been collected from adult (above 18 years) individuals of both sexes, following standard techniques [18]. Anthropometric data includes height, weight, sitting height, upper arm circumference, calf circumference, biacromial diameter, biiliac diameter, bicondylar diameter of humerus, bicondylar diameter of femur, skinfold thickness like biceps, triceps, subscapular, suprailiac, medial calf.
Some calculated values like Body mass index (BMI), Body fat percentage, Fat mass and Fat free mass have also been presented. Fat percentages have been obtained by Beurer Body Fat Monitor, which works on the principles of Bioelectrical Impedance to measure a persons’ actual body fat content. By utilizing BIA (bioelectrical impedance analysis) principles, a relatively accurate picture can be obtained of the body’s fat content. The methods Bioelectrical Impedance is considered to be one of the standard techniques as stated in many literatures [19,20]. Body mass index (BMI), Fat mass (FM) and Fat free mass (FFM) data have been calculated by using the following formula:
BMI = Weight (kg)/Height (m2)
FM (kg) (Fat mass) = (Body Fat percent/100) × Weight (kg)
FFM (kg) (Fat free mass) = Weight (kg) – Fat mass (kg)
Analysis of data: Descriptive statistics of anthropometric variables have been calculated and one-way analysis of variance (ANOVA) calculated to test the hypothesis that all the mean values of age cohorts are equal for each variable. Whenever significant ANOVA (F value) results of any variable detected, the mean values were crosschecked with Scheffe test to find out where the exact difference exists between groups. Scheffe’s test is designed to allow all possible linear combinations of group means to be tested, not just pairwise comparisons but the test is more conservative than other tests, meaning that a larger difference between means is required for significance. The chance of rejecting a true hypothesis is, say 5% on each test, and when several tests are made, the chance of rejecting at least one true-hypothesis becomes considerably larger than 5%. Scheffe’s multiple-comparison method overcomes this problem. In fact, using Scheffe’s method, and making all possible comparisons, the probability of obtaining one or more false conclusions when all the population means are actually equal is exactly 5%. The coefficient of variation (CV) has also been calculated and has been expressed as percent. The coefficient of variation (CV) is a normalized measure of dispersion of a probability distribution, also known as “relative variability”, equals the standard deviation divided by the mean. Sometime CV is expressed as percentage. The coefficient of variation describes the magnitude sample values and the variation within them and it is a useful statistic for comparing the degree of variation from one data series to another, even if the means are drastically different from each other. The coefficient of variation is useful because the standard deviation of data must always be understood in the context of the mean of the data. The coefficient of variation is a dimensionless number. The CV of a single variable aims to describe the dispersion of the variable, which does not depend on the variable’s measurement unit. The higher the value of CV is, the greater the dispersion of the variable. All the analyses have been done using SPSS 11.0 version computer package.
3. RESULTS
3.1. Socio-Economic Condition of the Study Population
Socio-demographic profile of the Bishnupriya Manipuris shows out of 246 individuals, 146 (59.30%) is female. Higher number of males (63.00%) and females (51.37%) has education up to secondary level, followed by higher secondary level (22.00% males & 18.49% females), graduation level & above (8.00% males and 6.85% females) and primary level (4.00% males & 12.33% females). Considering the occupations of the study group, large number of males are owner cultivator (25%) followed by business (22%), pension holder (21%) and service (10%), while most of the females are engaged in household work (75.34%). Economic status of the group has been determined by per-capita expenditure, shows that most of the individuals of both sexes belong to Rs.500/- to Rs.1000/- (53.00% males and 60.27% females), followed by above Rs.1000/- (33.00% males and 25.34% females) expenditure category and rest of the individual belong to below Rs.500/- (14.00% males and 14.38% females) expenditure category. Aging effect for the above mentioned variable was not possible due to present sample size but will make an impression on the subject of study.
Table 1 shows descriptive statistics pertaining to anthropometric characteristics and body composition of 5-age cohorts of male Bishnupriya Manipuris. Younger group (< 25 years) show higher mean values in stature, medial calf skinfold and fat free mass, 2nd group (25-34 years) show higher mean values in sitting height and suprailiac skinfold thickness, 3rd group (35-44 years) show higher mean values in body weight, upper arm and calf circumference, biacromial diameter and subscapular skinfold thickness, 4th group (45-54 years) show higher mean values in biiliac diameter, biepicondylar diameter of humerous as well as BMI, eldest group (> 54 years) show higher mean values in and biepicondylar diameter femur and fat. ANOVA result shows significant mean differences between/among 5 age groups in the anthropometric traits like sitting height, biepicondylar diameter of humerus and all the body composition characteristics except body mass index.
Table 2 shows Scheffe test results for group comparison, between/among 5-age cohorts. The variables considered in the test, which show significant ANOVA values in table 1. Scheffe test is more robust than t-test and it rules out type I error. First 2 variables (Sitting Height and Humerus diameter) do not show significant values between/among groups. Body fat percent is significantly high in the eldest group and significantly low in the younger group, therefore, it shows significant values. Fat mass and fat free mass also show more or less similar result with slight variation.
Descriptive statistics pertaining to anthropometric characteristics and body composition of the female Bishnupriya Manipuris has been presented in table 3. Younger group (< 25 years) show higher mean values in body weight, sitting height, calf circumference, medial calf skinfold and fat free mass, 2nd group (25-34 years) show higher mean values only in subscapular skinfold thickness, 3rd group (35-44 years) show higher mean values in only, upper arm circumference and 4th group (45-54 years) show higher mean values in stature, biceps and triceps skinfold thickness and BMI, eldest group (> 54 years) show higher mean values in biacromial and biiliac diameter, biepicondylar diameter of humerous, biepicondylar diameter femur, suprailiac skinfold thickness, fat% and fat free mass. ANOVA result shows significant mean differences between/among 5 age groups in the anthropometric traits like sitting height, biepicondylar diameter of humerus, medial calf skinfold thickness and all the body composition characteristics except body mass index.
Table 4 shows Scheffe test results for group comparison, between/among 5-age cohorts. The variables considered in the test, which show significant ANOVA values in table 3. First 2 variables (Sitting height and medial calf skinfold) show significant difference between younger and eldest (1st vs. 5th) group. Biepiconder diameter of humerus fail to show significant difference between/among groups. Body fat percent is significantly high in the eldest group and significantly low in the younger group, therefore, it shows significant values. Fat mass and fat free mass also show more or less similar result with slight variation.
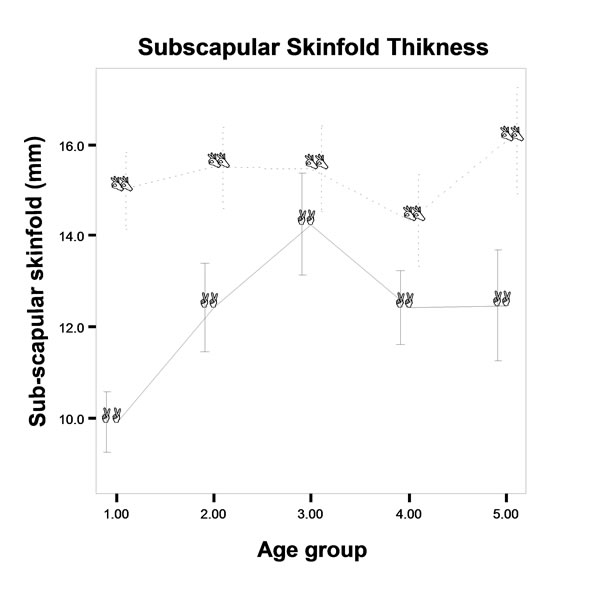
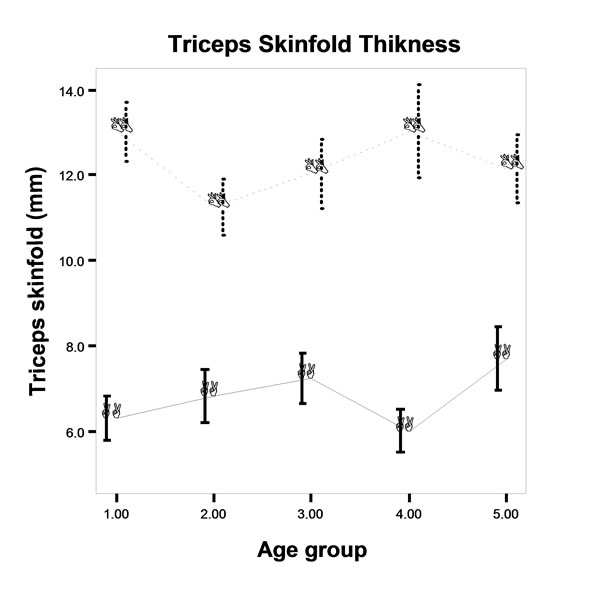
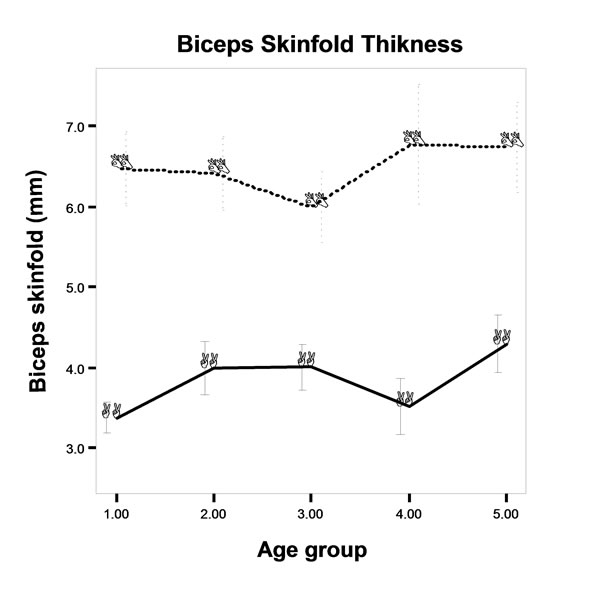
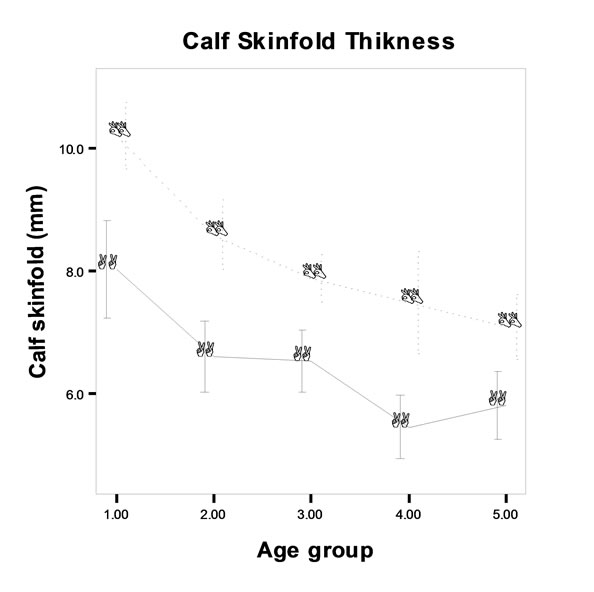
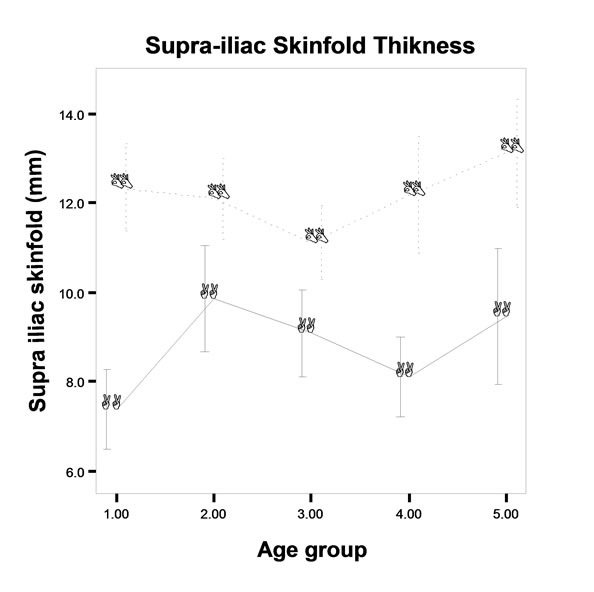
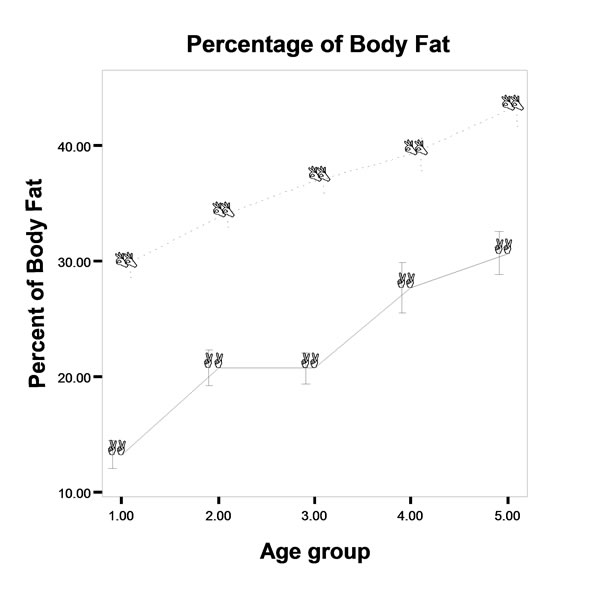
Age changes in the anthropometric and body composition characteristics have been presented (mean + SE) in Figure 1 and Figure 2" target="_self"> Figure 2 for both male and female Bishnupriya Manipuris.
Table 5 shows the Coefficient of variation in percentages. Variation of skinfold measurement is greater than all other measurements and again the variation is much greater in females than males, whereas fat percent and fat mass of females show smaller variation than males.
4. DISCUSSION
Individuals reach physical maturity through growth and development at certain age, but the age of maturity of all the body components is not similar between individuals or populations. It is inevitable that after middle age the changes in physical characteristics are marked and show declining trend. Present study examines age related changes in anthropometric and body composition
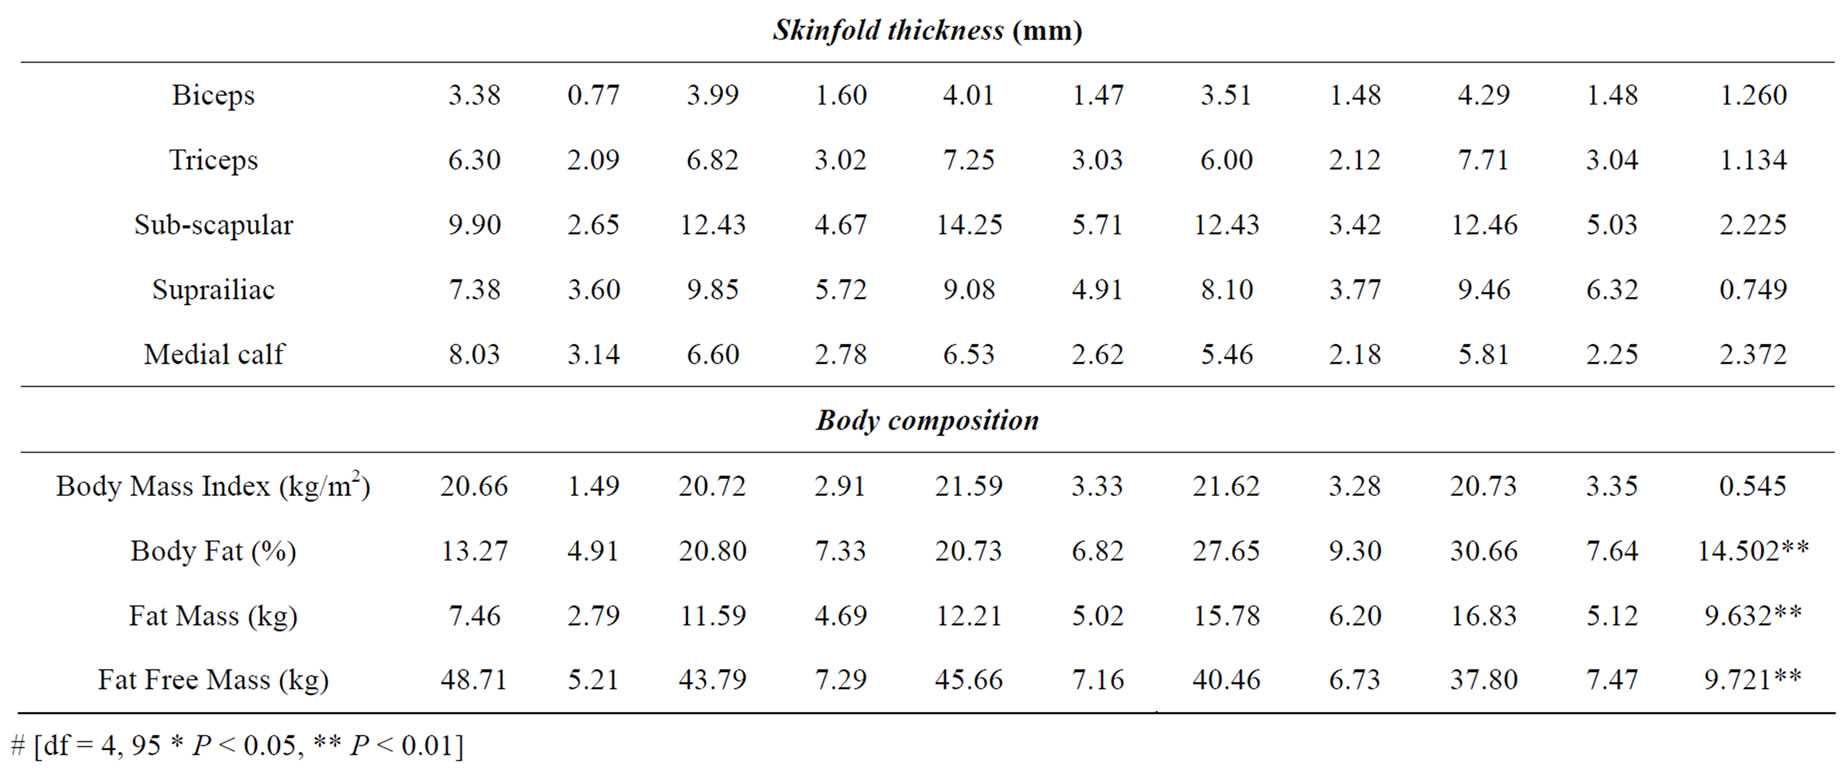
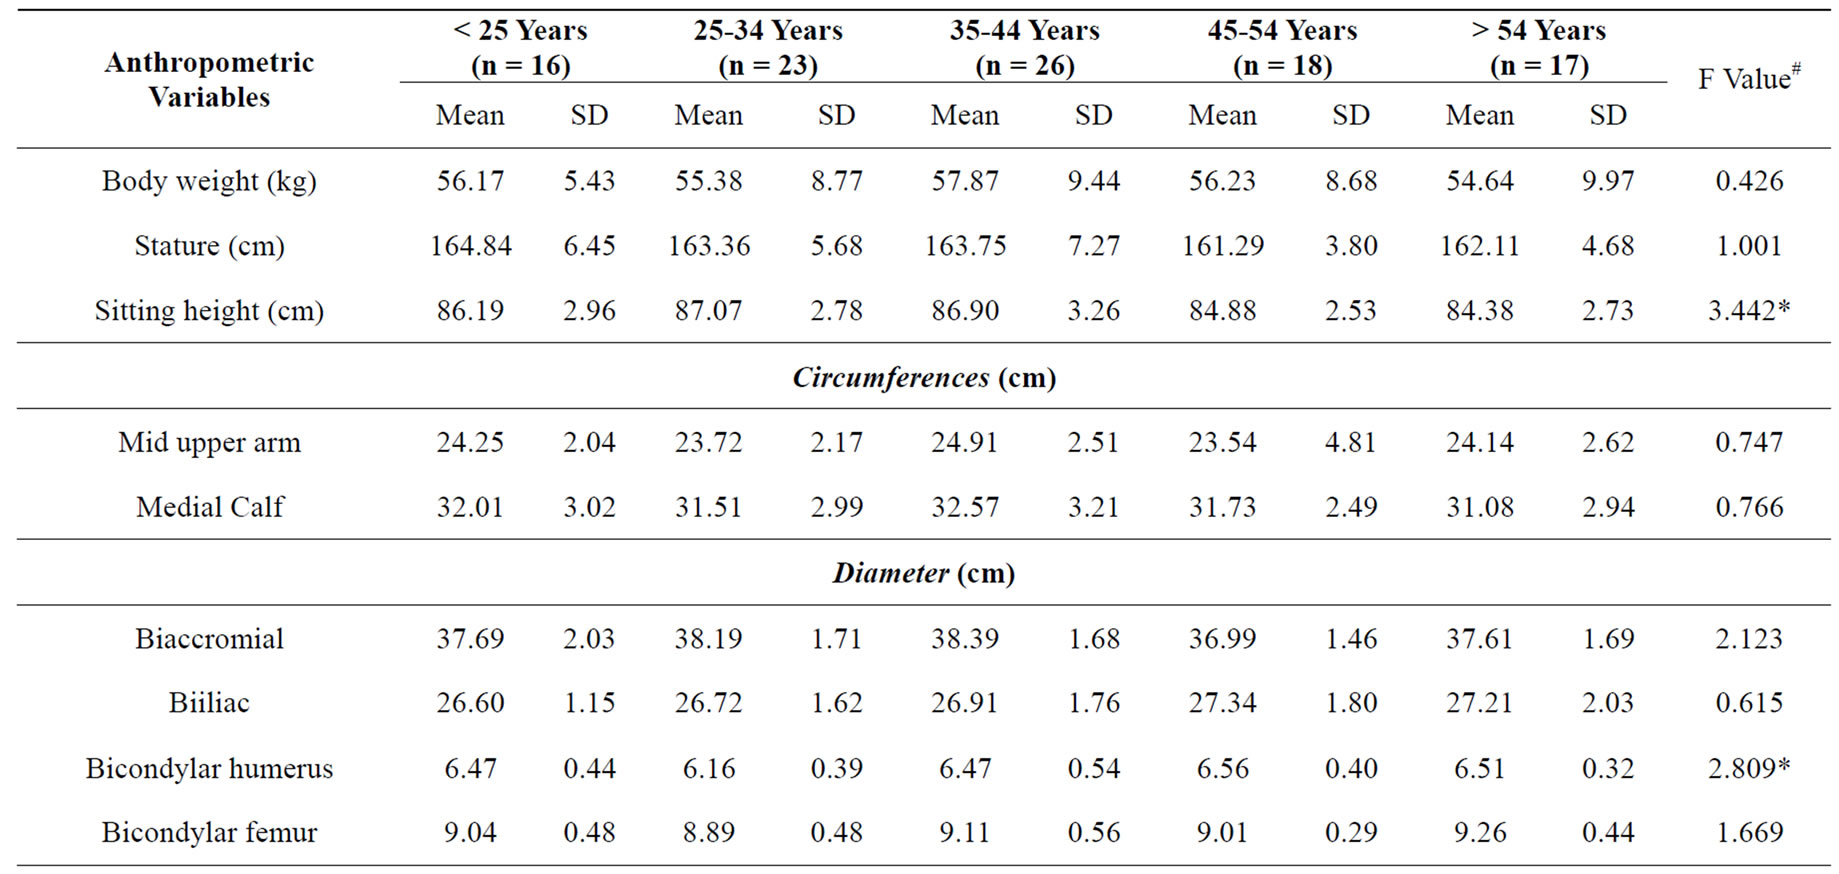
Table 1. Descriptive statistics pertaining to anthropometric and body composition characteristics of 5-age cohorts of male Bishnupriya Manipuris (F value refers to ANOVA results).
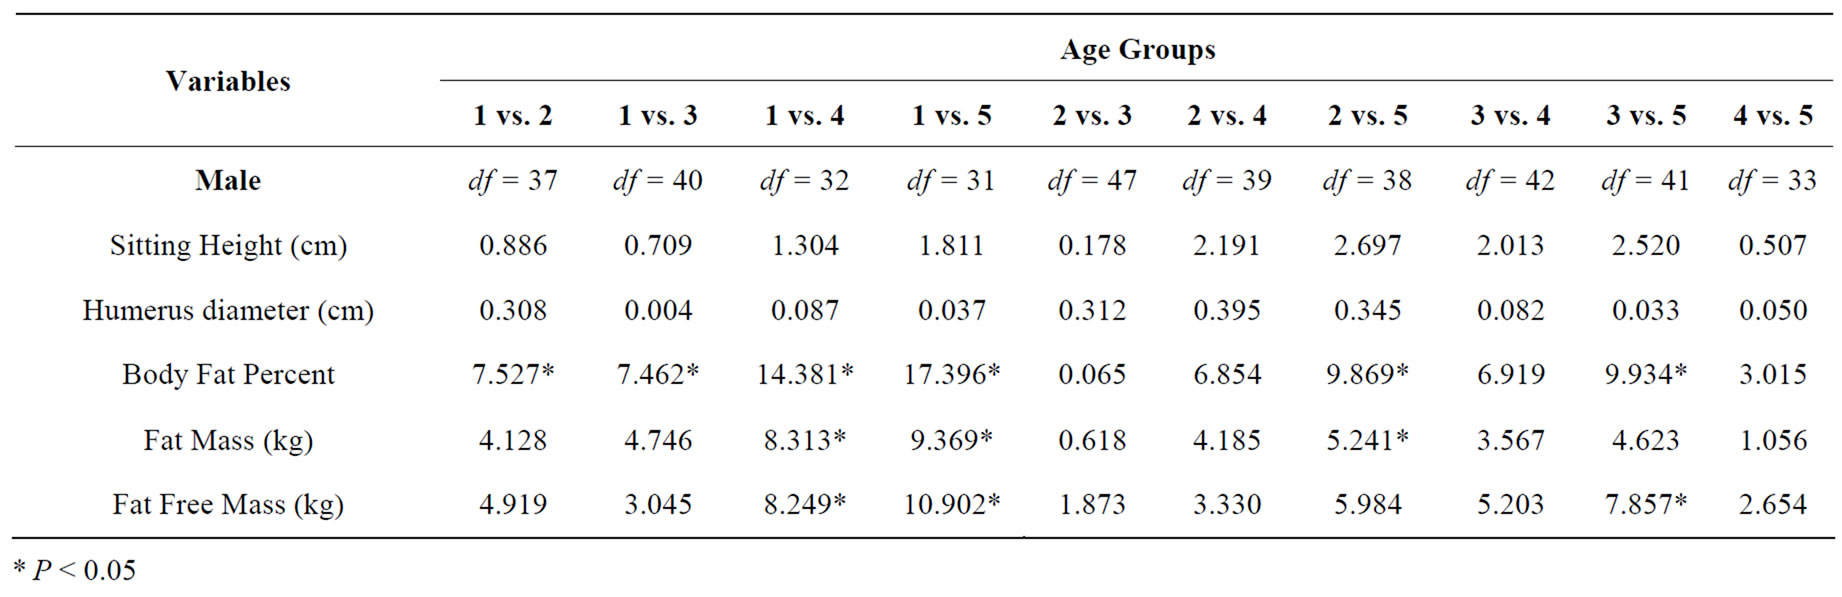
Table 2. Scheffe test between/among age groups of selected anthropometric characteristics of male, which show significant values in ANOVA (table 1).
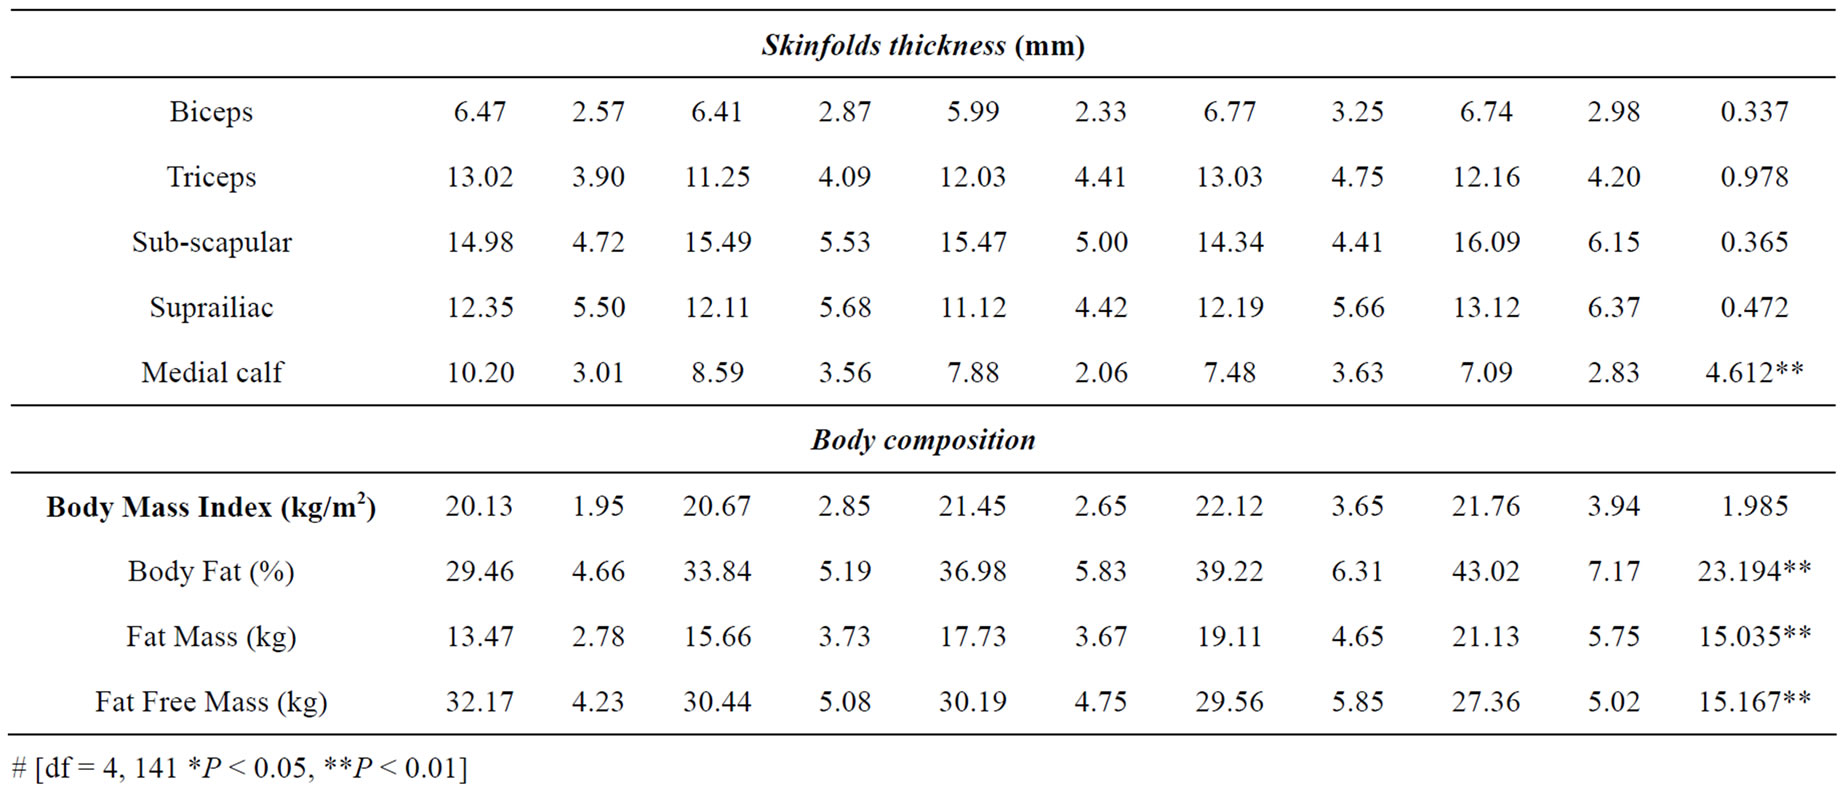

Table 3. Descriptive statistics pertaining to anthropometric and body composition characteristics of 5-age cohorts of female Bishnupriya Manipuris (F value refers to ANOVA results).
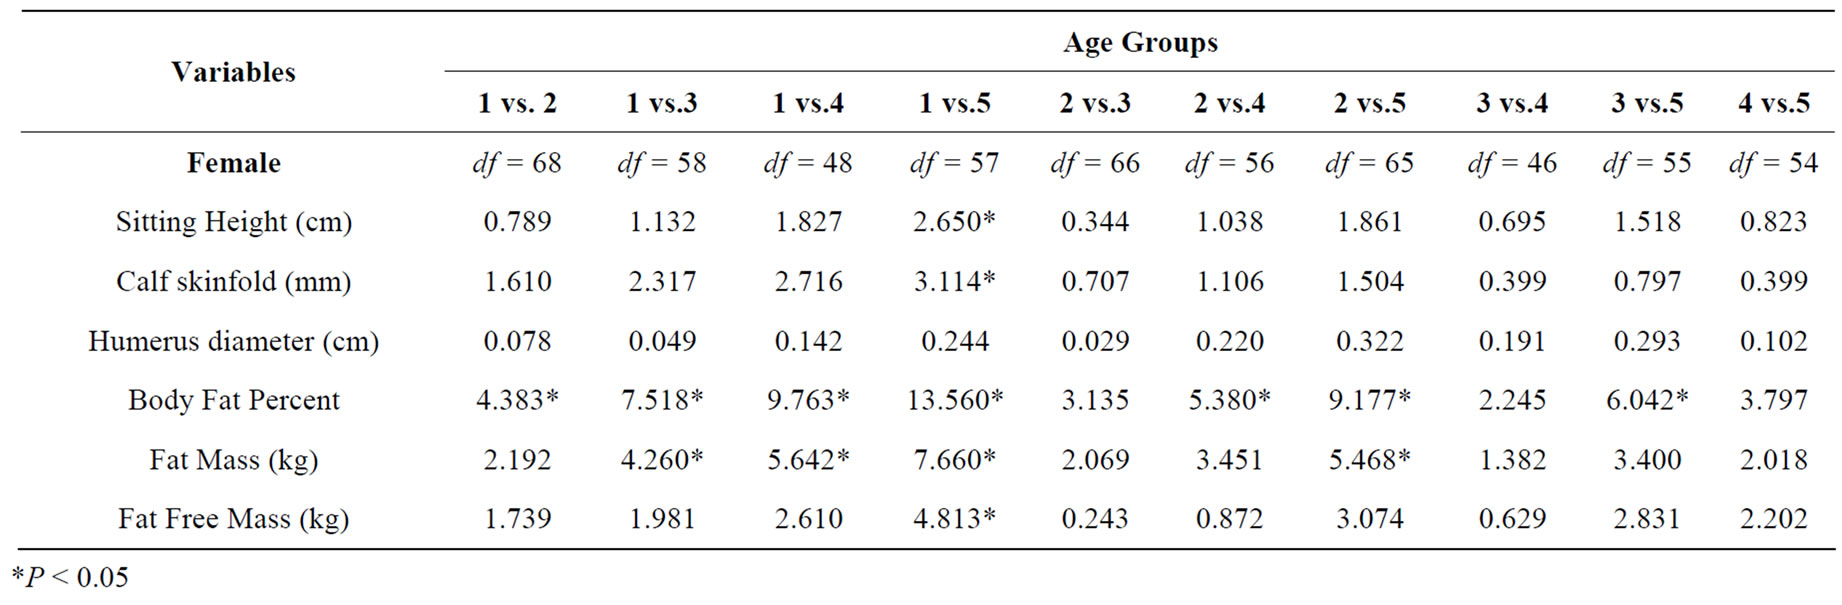
Table 4. Scheffe test between/among age groups of selected anthropometric characteristics of female, which show significant values in ANOVA (ref. table 3).

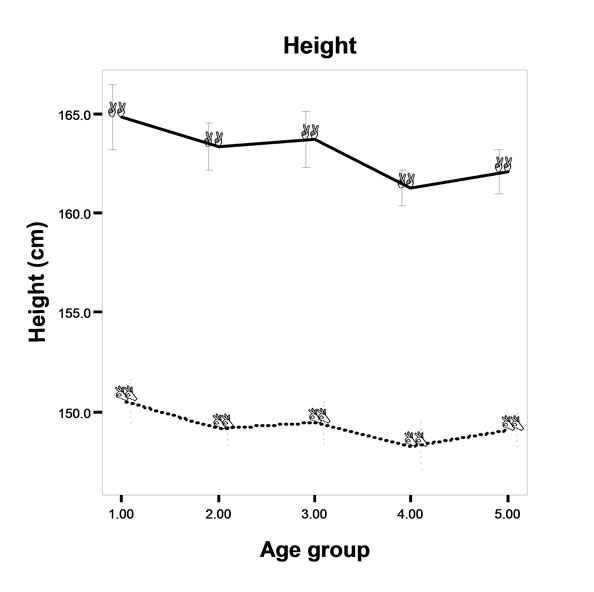


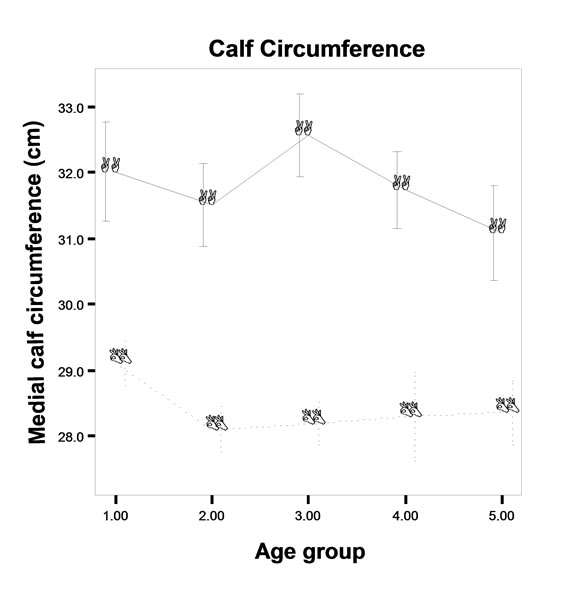


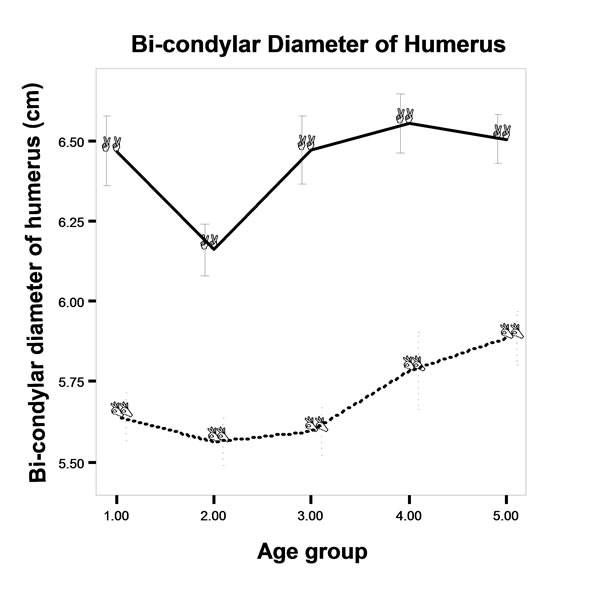
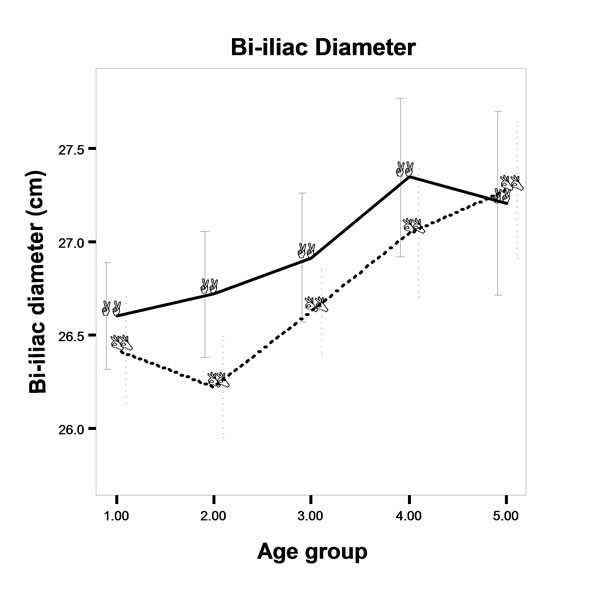
Legends: ----o---- Male ∆ Female Age Group: 1 = <25 years, 2 = 25-34 years, 3 = 35-44 years, 4 = 45-54 years and 5 = > 54 years
Figure 1. Age changes in the anthropometric characteristics in 10-yearly age cohort.
characteristics of the Bishnupriya Manipuris of Cachar district, Assam. The study population belongs to similar socio-economic background and shares a common physical environment. Study protocols were similar for all the individuals studied.
Present study shows significant difference in the anthropometric traits like, sitting height, humerus diameter, medial calf skinfold thickness; and in all body composition variables except body mass index between/among 10-yearly age cohorts in both sexes. Present study shows maximum mean height in the age group of < 25 years and thereafter it is slightly decreasing with increase of age irrespective of sex. Similarly, sitting height of both sexes demonstrate a significant decreasing trend with increasing age and this trend is very clear in females, which is corroborative with few empirical studies [21,22]. Most other anthropometric characteristics reached its peak at 35-44 yrs. age cohort (e.g. Body

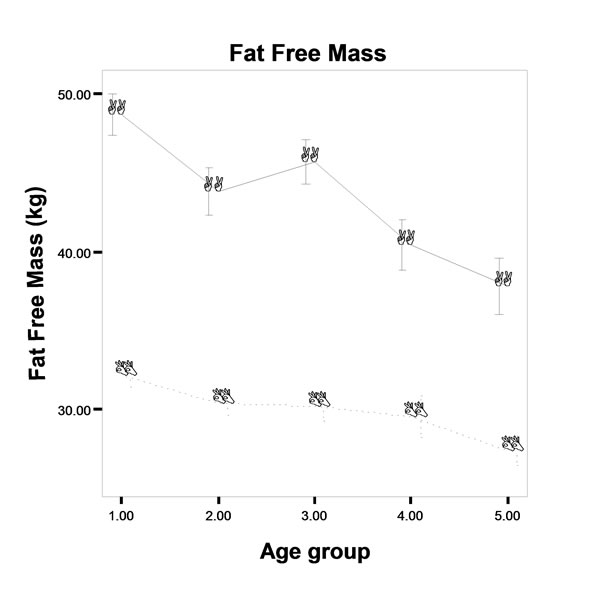
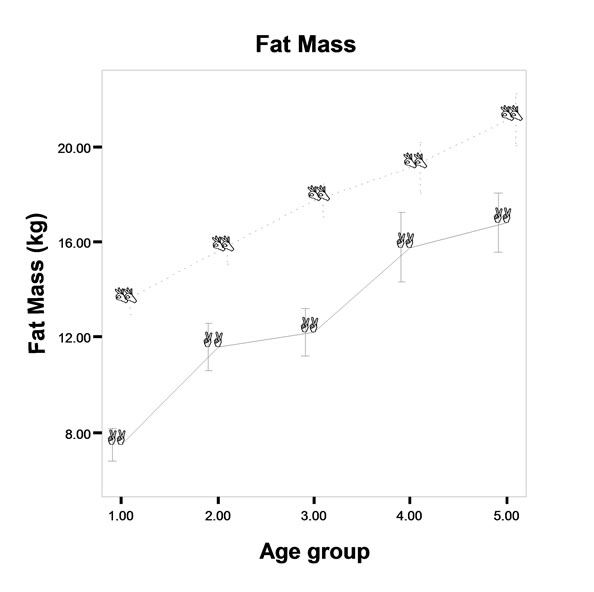
Legends: ----o---- Male ∆ Female Age Group: 1 = < 25 years, 2 = 25-34 years, 3 = 35-44 years, 4 = 45-54 years and 5 = > 54 years
Figure 2. Age changes in the body composition characteristics among 10-yearly age cohort.
weight, Sitting height, Upper arm circumference, calf girth and so on) and few other characteristics reached its peak at 45-54 yrs. age cohort (e.g. Biiliac diameter, bicondylar diameter of humerus), which is corroborative with the study of Oraon agricultural labourer of Jalpaiguri [5]. After peakedness, anthropometric characteristics show a decreasing trend with the increment of age may be due to the shrinkage of inter-vertebral space and increasing curvature of spine. Prokopec [6] (1987) observed that weight increase upto 40 years and then decline, which is corroborates with the present study in male but female show decreasing trend in weight in the age group of >54 years, which is corroborative with the study of Dangour [21] (2003) and Norris et al. [23] (1963).
Medial calf skinfold thickness significantly depicts a declining trend from first age group, i.e., < 25 years, which is corroborates with the study of Roy and Pal
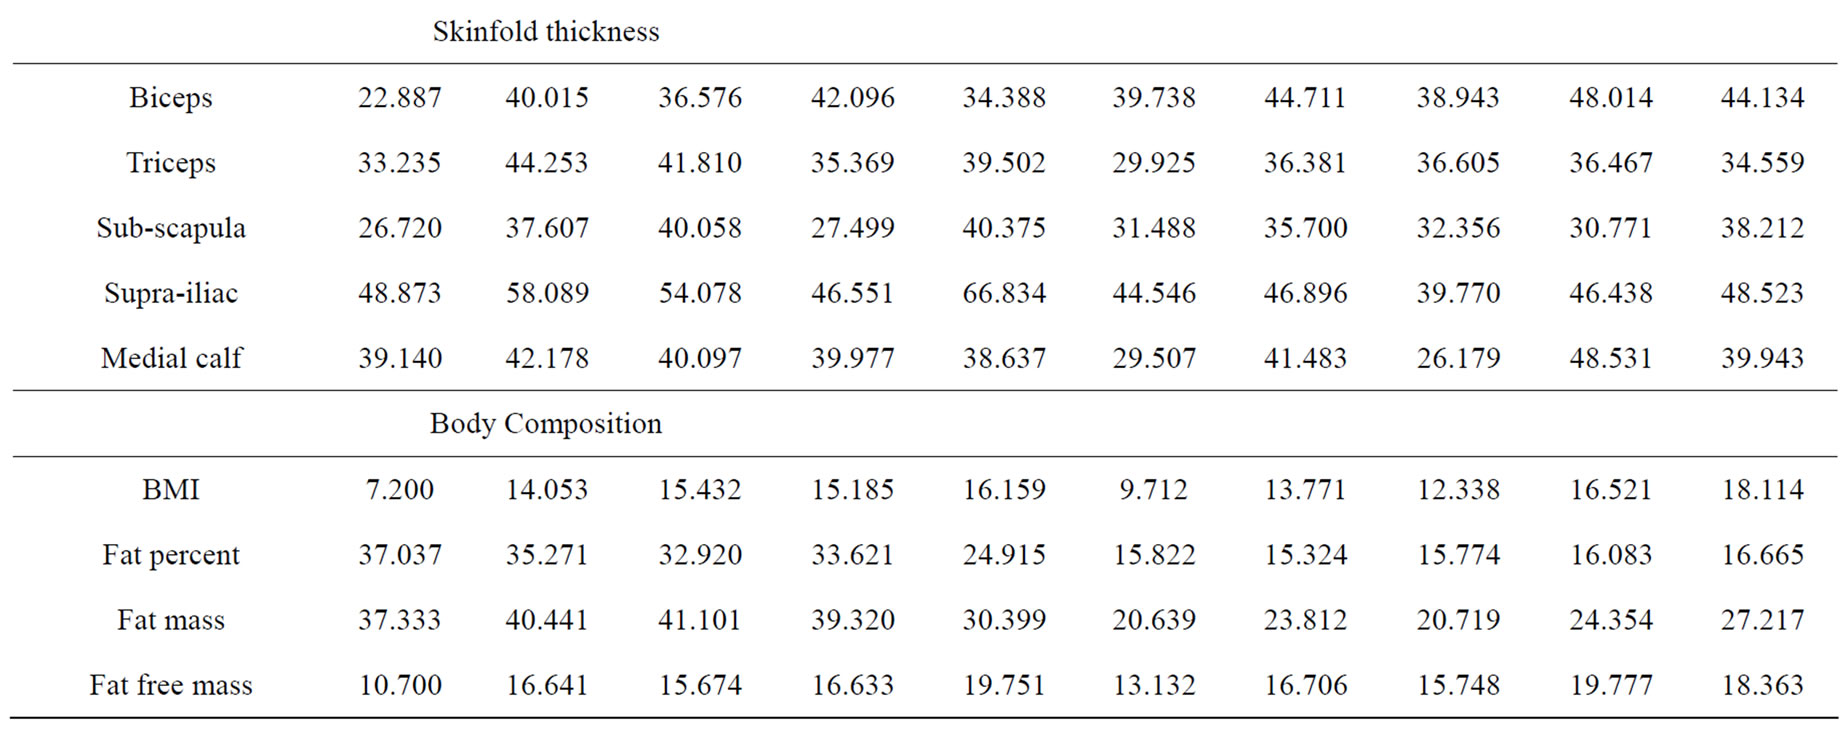
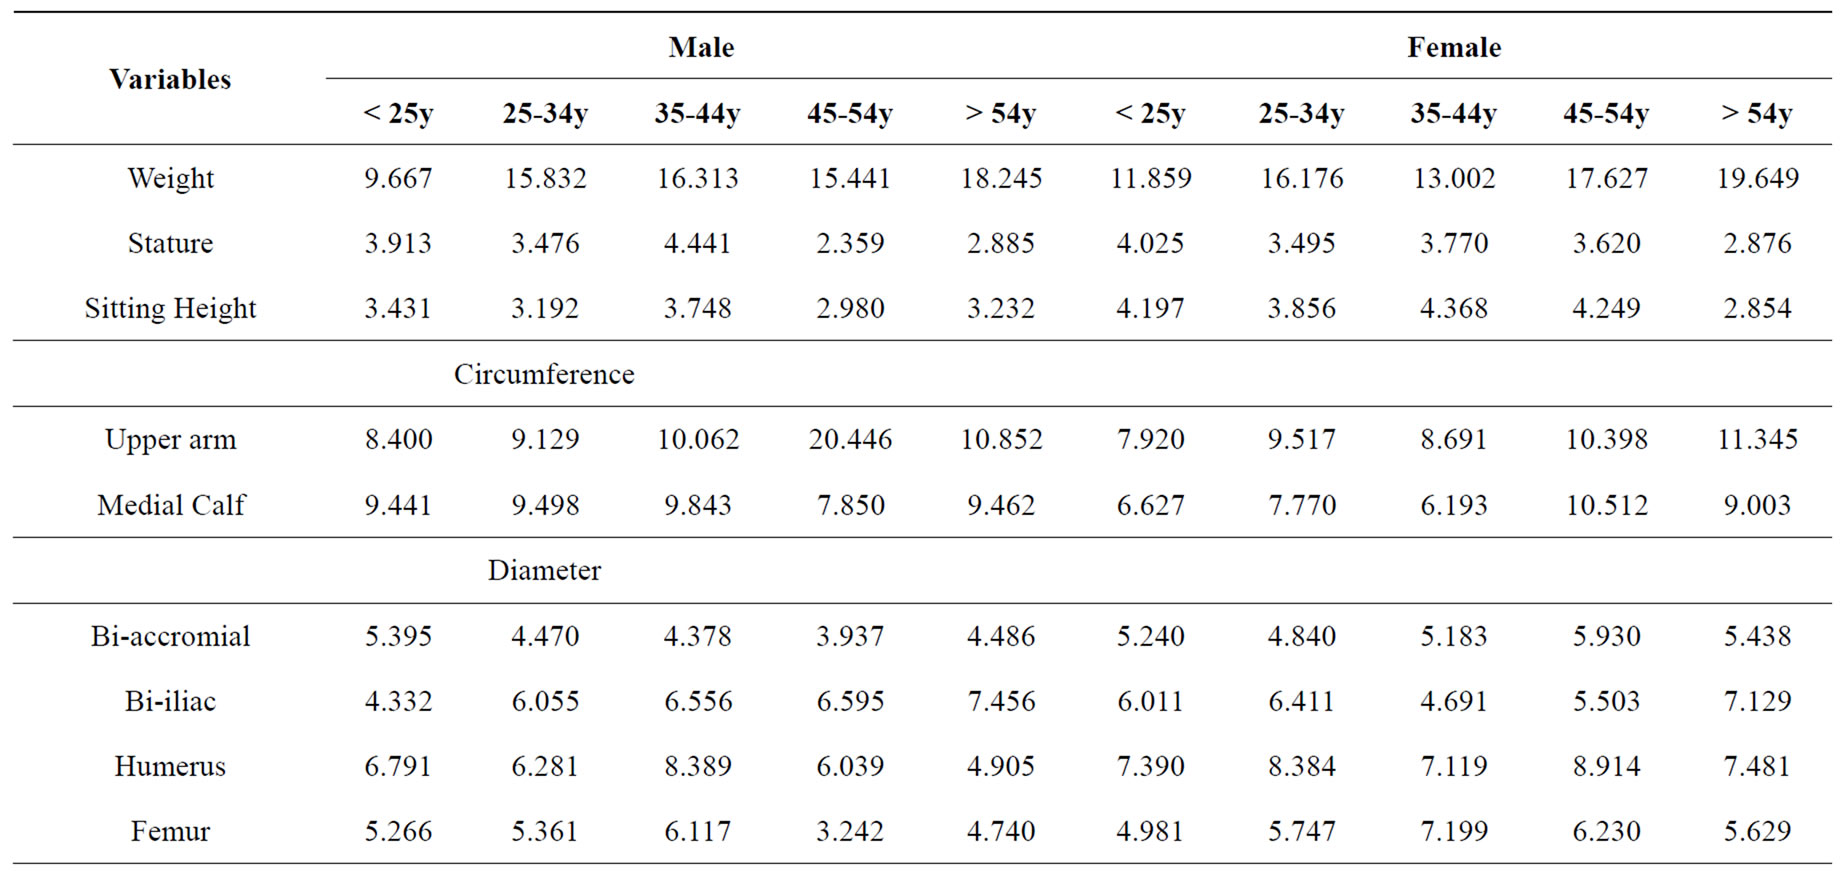
Table 5. Coefficient of variation (CV) in anthropometric and body composition characteristics of different age cohorts of the study population (expressed in percentage).
[5] (2003). Other skinfold thickness measurements do not show any such trend, however, biceps and triceps skinfold show its peak at 45-54 yrs. age cohort.
Body mass index is generally considered to be as a measurement of fatness [24,25], while it also gives information about fat free mass. The same adult BMI value corresponds to a more fatty body composition in the elder individual, because fat mass increases and fat free mass decreases in this particular period of life [26]. BMI (Body Mass Index) of the present population show peaked ness at 45-54 yrs. age cohort, similar trend has been revealed from other studies [21,27] conducted in developing countries like India. Whereas fat percent as well as fat mass show its peak at the last age group, while fat free mass shows significant reverse trend with age, which is not corroborative with other studies [13, 16]. This trend may be due to the degeneration of muscle and accumulation of fat mass during the older age of this particular population.
Finally, although the present study shows some significant changes and trend with increment of age in anthropometric and body composition traits of both sexes but some of the variables fail to demonstrate specific trend with increment of age. It would have been better to make age specific changes (considering each age) instead of making 10-yealy age cohorts, which could specifically able to demonstrate exact nature of change (exact age when the development for each trait ceased and when declining trend starts), however, it was not possible for the small sample size of the present study. It is important to understand the actual age changes in anthropometric and body composition characteristics of any group in terms of greater academic interest as well as biological and social point of view. As a note of caution, future studies on age changes in any population should be careful in taking the sample sizes as much as possible in order to make a clear understanding of the age specific changes.
5. ACKNOWLEDGEMENTS
The authors are deeply indebted to the study participants for their kind cooperation. We would like to thank Indian Statistical Institute, Kolkata for providing the financial support for conducting the study.
REFERENCES
- Plato, C.C. (1987) The effect of aging on Bioanthropo-logical variables: Changes in bone, mineral density with increasing age. Collegium Anthropologicum, 11(1), 59-71.
- Åstrand, P.O. and Rodahl, K. (1977) A text book of work physiology: Physiological bases of exercise. 2nd Edition, McGraw-Hill Book Company, New York.
- Launer, L.J. and Harris, T. (1996) Weight, height, body mass index distribution in geographically and ethnically diverse samples of older person. Age and Ageing, 25(4), 300-306.
- Susanne, C. (1979) Aging, continuous changes of adulthood. In Human Physical Growth and Maturation: Methodologies and Factors, Johnston, F.E., Roche, A.F. and Susanne, C., Eds., Plenum Press, New York, 203-218.
- Roy, S.K. and Pal, B. (2003) Anthropometric and physiological traits: Age changes among the Oraon agricultural labourer of the Jalpaiguri district, Northern West Bengal, India. Anthropology Anz, 61(4), 445-460.
- Prokopec, M. (1987) Changing patterns of growth, development and aging in the population of Czechoslovakia. Collegium Anthropologicum, 11(1), 91-115.
- Burr, M.L. and Phillips, K.M. (1984) Anthropometric norms in the elderly. British Journal of Nutrition, 51(1), 165-169.
- Chumlea, W.C., Rhyne, R.L., Garry, P.J. and Hunt, W.C. (1989) Changes in anthropometric indices of body composition with age in a healthy elderly population. American Journal of Human Biology, 1(4), 457-462.
- Chandler, P.J. and Bock, R.D. (1991) Age changes in adult stature: Trend estimation from mixed longitudinal data. AnnaHum Biology, 18(5), 433-440.
- Manandhar, M.C., Ankelsaria, P.S. and Ismail, S. (1997) Weight, skinfolds and circumference characteristics of poor elderly people in Mumbai, India. Asia Pacific Journal of Clinical Nutrition, 6(3), 191-199.
- Chiu, H.C., Chang, H.Y., Mau, L.W., Lee, T.K. and Liu, H.W. (2000) Height, weight, and body mass index of elderly persons in Taiwan. Journal of Jeron Biology Sciences and Medicine Sciences, 55(11), M684-M690.
- Bose, K. and Das Chaudhuri, A.B. (2003) Age variations in adiposity and body fat composition among older Bangalee Hindu women of Calcutta, India. Anthropology Anz, 61(3), 311-321.
- Ghosh, A. (2004) Age and sex variation in measures of body composition among the elderly Bangalee Hindu of Calcutta, India. Collegium Anthropologicum, 28(2), 553- 561.
- Sidhu, L.S., Sodhi, H.S. and Bhatnagar, D.P. (1975) Anthropometric changes from adulthood to old age. Indian Journal of Physical Anthropology, 1(2), 119-123.
- Singal, P. and Sidhu, L.S. (1983). Age changes in skinfolds, body fat and lean body mass in Jat-Sikh and Bania females during 20 to 80 years. Anthropology Anz, 41(3), 179-189.
- Bose, K., Bisai, S. and Chakraborty, F. (2006) Age variation in anthropometric and body composition characteristics and underweight among male Bathudis: A tribal population of Keonjhar District, Orissa, India. Collegium Anthropolozicum, 30(4), 771-775.
- Sinha, K.P. (1981) The Bishnupriya manipuri language. Calcutta.
- Weiner, J.S. and Lourie, J.A., Eds., (1981) Practical human biology. Academic Press, London.
- Kushner, R.F., Kunigk, A., Alspaugh, M., Andronis, P.T., Leitch, C.A. and Schoeller, D.A. (1990) Validation of bioelectrical-impedance analysis as a measurement of change in body composition in obesity. Asia Pacific Journal of Clinical Nutrition, 52(2), 219-223.
- Chumlea, W.C. and Baumgartner, R.N. (1989) Status of anthropometry and body composition data in elderly subjects. Asia Pacific Journal of Clinical Nutrition, 50 (Suppl 5), 1158-1166.
- Dangour, A.D. (2003) Cross-sectional changes in anthropometric variables among wapishana and patamona amerindian adults, Human Biology, 75(2), 227-240.
- Roche, A.F., Siervogel, R.M., Chumlea, W.C. and Webb, P. (1981). Grading body fatness from limited anthropometric data. American Journal of Clinical Nutrition, 34(12), 2831-2838.
- Norris, A.H., Lundy, T. and Shock, N.W. (1963) Trend in selected indices of body composition in men between ages of 30 and 80 years. Annals of the New York Academy of Sciences, 110(2), 623-640.
- Deurenberg, P., Weststrate, J.A. and Seidell, J.C. (1991) Body mass index as a measure of body fatness: Age and sex-specific prediction formula. British Journal of Nutrition, 65(2), 105-114.
- Daniels, S.R., Khoury, P.R. and Morrison, J.A. (1997) The utility of body mass index as a measure of body fatness in children and adolescents: Differences by race and gender. Pediatrics, 99(6), 804-807.
- Steen, B. (1988) Body composition and aging. Nutrition Review, 46(2), 45-51.
- Strickland, S.S. and Ulijaszek, S.J. (1993) Body mass index, aging and differential reported morbidity in rural Sarawak. European Journal of Clinical Nutrition, 47(1), 9-19.