Psychology
Vol.09 No.06(2018), Article ID:85702,26 pages
10.4236/psych.2018.96083
The Flow Short Scale (FSS) Dimensionality and What MIMIC Shows on Heterogeneity and Invariance
Theodoros A. Kyriazos, Anastassios Stalikas, Konstantina Prassa, Michael Galanakis, Katerina Flora, Varvara Chatzilia
Department of Psychology, Panteion University, Athens, Greece

Copyright © 2018 by authors and Scientific Research Publishing Inc.
This work is licensed under the Creative Commons Attribution International License (CC BY 4.0).
http://creativecommons.org/licenses/by/4.0/


Received: May 23, 2018; Accepted: June 25, 2018; Published: June 29, 2018
ABSTRACT
The purpose of this research was to examine the psychometric properties of the Flow Short Scale by Rheinberg, Vollmeyer, and Engeser in 160 Greek adults. State flow (as opposed to dispositional flow) was measured while participants were involved in a leisure time activity. First, construct validity was evaluated with factor analysis techniques like ICM-CFA, ESEM, Bifactor CFA and Bifactor ESEM. A total of 15 alternative models were evaluated. Two solutions showed optimal fit. First, it was the two-factor structure replicating the original structure but with different item allocation on each factor, probably due to cultural differences. Second, it was a shorter version of FSS with 6 items in the two original factors instead of 10. A MIMIC model indicated a significant direct effect of age on FSS factors thus, population heterogeneity. A significant direct effect on an indicator was also found, hence measurement noninvariance. Reliability (α and ω) was acceptable, but not AVE. Flow had a significant positive, moderately strong relation with emotionality and life satisfaction. In sum, the suggested factor structures for FSS were found to be reliable and valid to use in Greek cultural context.
Keywords:
Flow, FSS, ICM-CFA, ESEM, Bifactor CFA, Bifactor ESEM, MIMIC, Greece

1. Introduction
The concept of the flow (or optimal experience; Delle Fave, 2013 ) was firstly described by Woodworth ( Woodworth, 1918 , cited in Rheinberg, 2008) who observed the effortless absorption of both adults and children in certain activities. Since then, many researchers have tried to figure out and explain why people are highly motivated by and committed to certain activities without obvious external rewards (e.g., Hebb, 1955; White, 1959; Berlyne, 1960; DeCharms, 1968; McReynolds, 1971; Getzels & Csikszentmihalyi, 1976; Deci & Ryan, 1980 ). Flow is described as a “psychic compass orienting psychological selection and supporting the developmental trajectory each individual autonomously builds and follows throughout life” (Massimini & Delle Fave, 2000; Delle Fave, 2013: p. 61) , and it was included in the Authentic Happiness Model by Seligman (2002).
Csikszentmihalyi (1975/2000) was the first to conduct a systematic empirical research to investigate the subjective phenomenology of intrinsically motivated or autotelic activities. The term autotelic (auto = self & telos = goal) refers to activities that have a purpose in and of themselves and are considered as rewarding apart from any potential external reward resulting from them (Csikszentmihalyi, 2014) . Later, the term was also used to describe an autotelic personality (Boniwell, 2012) . Csikszentmihalyi (1975/2000) identified flow by interviewing chess players, rock climbers, dancers, composers, athletes and other individuals who have as a goal the pursue of enjoyment and by asking them to report their experiences and source of pleasure. The same procedure was followed for professionals, specifically surgeons, whose extrinsic rewards such as money, fame, and prestige could justify their efforts and involvement (Csikszentmihalyi, 2014) .
Jackson and Marsh (1996) and Jackson and Csikszentmihalyi (1999) defined flow state as a multidimensional experience with nine components: focused concentration on the present activity, sense of control over one’s actions, merging of action and awareness, autotelic experience, loss of self-consciousness, loss of time awareness or time acceleration, clear goals, clear feedback, and dynamic balance between challenge and skill. What is also noteworthy in flow is the lack of emotions during the actual process. Flow-ers seem to be almost beyond experiencing emotions, probably due to the absence of self-awareness (Boniwell, 2012) . However, after the occurrence of flow, an increase in positive emotions is experienced (Seligman, 2002) .
The weakness of the operational flow model to measure all nine components and avoid theoretically inconsistent results finally led to its reformulation by Csikszentmihalyi and Csikszentmihalyi (1988) . The revised model, commonly referred to as the four channel model or the quadrant model of flow, suggests that flow can be achieved only under circumstances where both challenge and level of skills are greater than the weekly average (Csikszentmihalyi & LeFevre 1989) . This obviously more complex model divides experience in four central states―flow, anxiety, boredom, and apathy―represented as quadrants of a challenge by skills Cartesian system. According to this model, if both challenge and skills in carrying out an activity are above weekly average, then flow is achieved. Apathy state, suggests that both challenge and skills are low, thus it is the only additional state but also the least positive and desirable one (Moneta, 2012) . Other proposed models and/or measurement methods for flow followed after this revision: 1) The experience fluctuation model (Massimini & Carli 1988; Massimini et al., 1987); 2) The absolute difference regression model (Moneta & Csikszentmihalyi 1999); 3) The Componential Approach (Moneta, 2012) .
Entering flow presupposes the existence of a balance between the perception of one’s skills and the perception of the activity’s difficulty level ( Berlyne, 1960 ; Hunt, 1965 ; Csikszentmihalyi, 1975; Rheinberg, 2008 ). According to Csikszentmihalyi (1975/2002), in case that challenges exceed skills the individual firstly becomes vigilant and then anxious, while, on the other hand, when skills exceed challenges the individual experiences relaxation and then boredom. Changes in subjective state offer feedback and therefore feeling anxious or bored impels individuals to either adjust the level of skills to the challenge or the opposite, so as to get rid of these unwanted feelings and reenter flow state. Hybrid empirical flow models distinguish antecedents and aspects of flow. In these models, concentration to flow, goals, feedback, and balance are flow antecedents while control, merging, autotelic experience, self-consciousness and time are the core characteristics of the flow experience (Finch& West 1997; Moneta, 2012 ).
Following abundant studies, the experience of flow has been proved to be present and common across several settings, types of activity, and lines of culture, class, gender and age (Csikszentmihalyi & Robinson, 1990; Jackson, 1995; Csikszentmihalyi, 1996; Jackson, 1996; Perry, 1999; Quinn, 2005; Debus et al., 2014) , while it has also received a neurophysiological underpinning (Goldberg et al., 2006) . In addition, the relationship between flow and performance has been supported by various studies (e.g., Nakamura & Csikszentmihalyi, 2005 ), while others have not proved such a strong correlation (Csikszentmihalyi & Csikszentmihalyi, 1988; Nakamura, 1988; Jackson et al., 2001; Puca & Schmalt, 1999) , leading to the conclusion that although flow is associated to higher performance, it does not necessarily cause it (Engeser & Rheinberg, 2008) .
Generally speaking, the flow model does not come without shortcomings as several problems have been pointed out (Engeser & Rheinberg, 2008) . First of all, the fact that there must be equilibrium between challenge and skills to achieve flow does not automatically mean that flow is always present when this balance exists, while individuals may also differ in the degree to which challenge and skills are related (Pfister, 2002) . An additional problematic issue concerns the use of the term “challenge” instead of “difficulty”, something that has been found to make no empirical difference despite that challenge by default compounds perceived difficulty and skill (Keller & Bless, 2008; Pfister, 2002) . Finally, one more criticism that has been expressed regarding flow models concerns the significance of individuals’ personality as it has been argued that some people are more likely to experience flow than others, depending on their achievement motive (Csikszentmihalyi, 1975, 1990; Moneta & Csikszentmihalyi, 1996) .
Moreover, flow research basically initiated examining activities in achievement situations. Recently, Schiepe-Tiska & Engeser (2012) expanding the traditional flow theory on achievement situations by introducing the distinction of implicit and explicit motives to explain how individuals can experience flow not only in achievement situations but also in non-achievement situations. They proposed that flow occurs from the interaction of motive-specific incentives in challenging contexts plus skill balance, and a person’s motives. Those motives are forming the background leading to situations which can produce flow even in non-challenging contexts and activities. In this study, the activity generating flow was a leisure-time activity.
The first measurement for assessing flow was the Flow Questionnaire (FQ, Csikszentmihalyi, 1975; Delle Fave & Massimini, 1988). FQ is considered to be a good measurement for assessing the prevalence of flow but it presents several limitations for estimating the effects of challenges and skills on subjective experience and also it fails to gauge the intensity of flow in certain occasions (Moneta, 2012) . To overcome these drawbacks, several other tools for measuring flow have been developed (e.g., Jackson & Eklund, 2002; Keller & Bless, 2008; Schuler, 2010; Novak & Hoffman, 1997; Jackson & Eklund, 2002 ).
The flow construct is also greatly dependent on the measurement method, not only the measurement instrument. The Experience Sampling Method (ESM; Csikszentmihalyi, Larson, & Prescott, 1977 ) although it was not explicitly intended to study flow, but the context of daily activities in general, it truly boosted the flow research in everyday life. In this method, the respondent fills out repeated self-reports during the real-time unfolding of events, to minimize measurement bias (Moneta, 2012) .
This paper focuses on a relatively new scale adopting the componential approach (Moneta, 2012) , the Flow Short Scale (FSS; Rheinberg, Vollmeyer, & Engeser, 2003 ). The FSS allows all nine components of flow to be measured and therefore it is appropriate for both completed activities and ESM-based assessments on activities that are in progress. In this study flow will be measured in an ongoing activity, adopting a measurement method implemented by Rheinberg & Engeser (2008). Rheinberg, Vollmeyer, & Engeser (2003) , Rheinberg & Engeser (2008) and Engeser (2012) proposed two dimensions for the ten flow items of FSS: (1) fluency of performance (items 2, 4, 5, 7, 8, 9) and (2) absorption by activity (items 1, 3, 6, 10).
Unfortunately, published empirical works on FSS factor structure are scarce. Specifically, to the best of our knowledge only few studies are available, mostly in non-English languages, using only the Exploratory Factor Analysis method. Generally, the lack of psychometrically robust flow measures was also noted by Moneta (2012) .
An issue regarding the factor structure of the FSS was the conflicting information about the length of the scale in the scarce existing literature. Rheinberg & Engeser (2008) used the scale with 13 items. Ten of them were measuring the flow construct and additional items were measuring components of flow tapping on demand, skills, and the perceived fit of demands and skills (items 11 - 13). However, these three additional items were included to help measure factors about the activity performed and not the flow construct per se (c.f. Keller & Landhaußer, 2012 ). Crucially, Schiepe-Tiska & Engeser (2017) indicate that FSS scale consists of ten items and the additional items are designed separately to assess perceived demand/skills fit. Additionally, as Moneta (2012) comments, generally, in all flow scales the items tapping on the contextual parameters of flow measurement have weak psychometric stability and their dimensionality is empirically untested (Moneta, 2012) .
Furthermore, a shorter version of FSS (FSS-6 short) arose by the present study having 6 items instead of 10 in the initial scale separated in two factors (Absorption by activity and Fluency of performance; Engeser & Rheinberg, 2008 ; Engeser, 2012 ) with 3 items each. FSS-6 short is a post hoc, empirically derived version, but it is also supported by flow theory. Specifically, Rheinberg (2008) & Engeser and Schiepe-Tiska (2012) suggest that flow consists of the following core elements: 1) A balance between the perception of one’s skills and the perception of difficulty of the activity (task demand). 2) The activity has coherence and provides clear feedback. 3) The activity has an internal logic. 4) A high degree of concentration on the activity. 5) A change in one’s experience of time. 6) The self and the activity are not separated and there is a loss of self-consciousness. The above components are a combination of distinct (experiential) states, co-occuring during engagement in a skill-related activity (Engeser & Schiepe-Tiska, 2012) .
Finally, this study has the following objectives: (a) to establish the construct validity of FSS with Confirmatory Factor Analysis techniques;(b) to evaluate population heterogeneity and measurement invariance of FSS using CFA with covariates modeling (MIMIC); (c) to estimate internal reliability, construct reliability (Hoque et al., 2017) and convergent validity of the FSS; (d) to evaluate concurrent validity of FSS with emotionality and life satisfaction. Standardization of FSS is not possible because state flow (as opposed to dispositional flow, Jackson & Eklund, 2002, 2004 ) is highly dependent on the measurement method and performed activity, thus displaying potential sources of bias (Moneta, 2012) . Csikszentmihalyi & Larson (1984), in an attempt to overcome this problem, used individual standardizationin their ESM studies.
2. Method
2.1. Participants
A total of 160 adults (23.1% males, 76.9% females) participated in the study. Most of the participants were: employees in a private sector company located in Athens, Greece (56.3%), running their own business (17.5%), looking for a job (11.3%), public servants (6.3%), housekeeping (1.3%) or other (7.5%). The sample had an average age of 34.69 years (SD = 8.00).Participants were either married/living together (49.4%), single (48.1%), or divorced (1.3%) and widowed (1.3%).The 70% of the respondents did not have children, 15% had one child, 10.6% had two children and 4.4% three or more.
2.2. Measures
1) Flow Short Scale (FSS)
Flow was measured with the Flow Short Scale (Rheinberg, Vollmeyer, & Engeser, 2003) . FSS evaluates all nine components (Jackson & Marsh, 1996; Jackson & Csikszentmihalyi, 1999) of flow experience (Csikszentmihalyi, 1975/2000; Csikszentmihalyi & Csikszentmihalyi, 1988) with ten items over a 7-point scale ranging from a minimum of 1 (not at all), a midpoint of 4 (partially) and a maximum of 7 (very much).More specifically, state flow (as opposed to dispositional flow; Jackson & Eklund, 2002, 2004; Moneta, 2012 ) was measured during a performed leisure-time task(see details on Procedure section). Except for the ten flow items (e.g. “I do not notice time passing”), the questionnaire separately provides three items tapping on perceived importance as proposed by Engeser ( Engeser, 2012: p. 202 ; see also Keller & Landhäußer, 2012 ). The Flow Short Scale has been validated by Rheinberg et al. (2003) and by Engeser & Rheinberg (2008) . The internal consistency reliability was reported to be α = .92 for the flow factor (Engeser & Rheinberg, 2008) . The scale has been used by Rheinberg et al. (2007) with either the Experience-Sampling Method (ESM; Csikszentmihalyi et al., 1977 ) or with a procedure similar to the one adopted here (c.f. Engeser & Rheinberg, 2008 ). Item 10 was reversed scored in some of the factor structures tested here.
2) Translation procedure
The Greek adaptation of the FSS was translated from the English version (Engeser, 2012: p. 201) with the committee procedure (Brislin, Lonner, & Thorndike, 1973) . First, two Greek-English bilingual psychologists translated the English version into Greek independently. Next, a committee consisted of the two abovementioned psychologists and two other team members fluent in English examined the two Greek FSS versions item by item to check any ambiguous wording or awkward content. The final version that emerged after this procedure was used to measure flow in this study. Generally, cross-cultural flow research indicated that the translation of the English word “challenge” was an issue (Massimini, Csikszentmihalyi, & Delle Fave, 1986; Delle Fave, 2013 ). However, in this study, the word challenge was not an issue. Nevertheless, two other issues are noteworthy. First, the item allocation in each of the two original factors proposed by Engeser & Rheinberg (Engeser & Rheinberg, 2008; Engeser, 2012; Rheinberg et al., 2003) was semantically different for the Greek cultural context. Table 1 presents an item allocation, more semantically compatible with the Greek contextin the two original factors. This modified bi-dimensional structure is shown on Table 1 in comparison to the original bi-dimensional structure.
Note that 2 out of 6 original FP items and 3 out of 4 original ABA items proposed by Engeser & Rheinberg (2008) and Engeser (2012) are identical to this modified bi-dimensional factor allocation for the Greek context. Second, the phrase “lost in thought” in Greek has a negative connotation (troubled), pointing to a negative affect state, inherently incompatible to flow, called in other words the “optimal experience” (Fullagar et al., 2017; Boniwell, 2012) .

Table 1. The Two-factor Item allocation compatible with the Greek Cultural Context.
The factor of each item is included in parenthesis, ABA = Absorption by activity factor, FP = Fluency of performance factor.
However, we decided to keep the original expression as is, because we believed that flow context would cancel the negative undertone.
3) Scale of Positive and Negative Experience (SPANE)
This is a scale containing 12 one-word items. It is a subjective well-beingmeasure by Diener et al. (2009, 2010) with two opposite dimensions of affect: (a) positive experiences (6 items, e.g. “Good” or “Happy”), and (b) negative experiences (6 items, e.g., “Angry”, “Sad”). On each dimension (positive and negative) three feelings are general, and the remaining three are specific (Diener et al., 2010: p. 145) . Items are scored on a 5-point Likert scale measuring frequency of experiences, from 1 (very rarely or never) to 5 (very often or always). Experiences are rated on a monthly time frame. The score of positive experiences (SPANE-P) and the score of negative experiences (SPANE-N) can vary from 6 to 30. Their difference (Affect Balance or SPANE-B) ranges from −24 to 24. Internal consistency reliability, as reported by Diener et al. (2010) for Negative Experiences, Positive Experiences and Affect Balance was α = .87, .81 and .89 respectively. In self-report flow studies, the inclusion of an affect measure is generally suggested (Engeser & Rheinberg, 2008) .
4) Scale of Positive and Negative Experience 8 (SPANE-8)
Except for the original version of SPANE, this study also included a second, shorter version (SPANE-8; Kyriazos, Stalikas, Prassa, Yotsidi, 2018 ) containing 8 items (4 in SPANE P and 4 in SPANE N). SPANE-8 is a revised structure containing one general feeling per dimension instead of 3 included in the original SPANE (Diener et al., 2010: p. 145) . Among the general positive and negative feelings items, the items with the lowest factor loadings during CFA were excluded (cf. Kyriazos et al. in press ). This resulted to a briefer and more parsimonious structure with 4 positive (Pleasant, Happy, Joyful, Contented) and 4 negative (Bad, Sad, Afraid, Angry) items.
5) Satisfaction with life scale (SWLS)
The Satisfaction with Life Scale (Diener, Emmons, Larsen, & Griffin, 1985) is a brief, widely used measure with cognitive evaluations of lifesatisfaction. Specifically, it evaluates participants’ global satisfaction with their lives and circumstances. Perceived satisfaction is rated on a 7-point scale, from 1 (strongly disagree) to 7 (strongly agree). An example item is “So far I have gotten the important things I want in life”. The higher the score the greater the perceived satisfaction of the respondent. Possible scores range from 1 to 35. The SWLS has been used both in clinical and non-clinical samples (Pavot & Diener, 2008) . Internal consistency (Cronbach’s alpha coefficient) was reported from .79 to .89 for non-clinical samples (Pavot & Diener, 1993) .
6) Demographics
Socio-demographic information collected included gender, age, marital status, whether respondent had children, level of education, monthly income and occupation.
2.3. Procedure
Participants initially received an e-mail message from the research team, announcing the study as a scientific research about attitudes and emotions on leisure-time activities. The information made clear that the study was hosted by Panteion University, and participation to the study is not related to their employment status. Participation to the study was on a voluntary basis, anonymous and no incentives were offered. After the announcement, team members visited the company and explained further the purpose of the study, while presenting the test battery. First the test battery included a brief introductory text with the purpose of the study and inform consent. Next, the research team presented a brief quote to the participants describing a flow experience (Csikszentmihalyi & Csikszentmihalyi, 1988: p. 195) . Then specific instructions on how to complete the test battery followed. Specifically, participants were asked to choose a quiet, familiar spot where they could be on their own, and to work on a skill-related activity of their choice (c.f. Keller & Landhäußer, 2012 ); one they typically perform and enjoy, and it is likely to generate a flow state. Ideally, during the activity performed they should have a clear set of rules to follow and be able to get feedback on their progress (Csikszentmihalyi, 2000, 1978; Moneta, 2012; Csikszentmihalyi, 2014) . They were also instructed to set an alarm clock ten minutes after they had started performing the task. At that point they should fill out the measures of the study. Data were collected using an electronic form format (Google FormsÒ) via a web-link e-mailed to all participants. The test battery took approximately 8 minutes to complete. The study was available online for about three months.
2.4. Design of the Research
Our sample size did not allow the implementation of the “3-faced construct validation method”, thus the alternative suggested method for small samples was implemented (Kyriazos, Stalikas, Prassa, & Yotsidi, 2018) . The analysis involved the following steps: 1) Evaluation of construct validity with Confirmatory Factor Analysis (CFA) where 15 alternative models were evaluated using different approaches including Independent Cluster Model Confirmatory Factor Analysis (ICM-CFA), Exploratory Structural Equation Modeling (ESEM), Bifactor CFA and Bifactor ESEM; 2) Population heterogeneity and measurement invariance were evaluated for latent means and item intercepts by the Multiple Indicators Multiple Causes method (MIMIC) controlling for the effects of age and marital status; 3) Internal Reliability and construct reliability (Hoque et al., 2017) were evaluated with Cronbach’s alpha (Cronbach, 1951) and Omega Total coefficient (McDonald, 1999) ; 4) Concurrent Validityfollowed with a measure of subjective well-being (SWLS; Diener et al., 1985 ) and two measures of emotionality (SPANE-12; Diener et al, 2009, 2010 ; SPANE-8; Kyriazos et al., in press ). Data were analyzed using SPSS, Version 25 (IBM, 2017) , Stata Version 14.2 (StataCorp, 2015) and MPlus Version 7.0 (Muthen & Muthen, 2012) .
3. Results
3.1. Data Management
The full sample had N = 160 cases with no missing values because all the fields of the digital test-battery were required. Generally, the sample was comparable to other validation studies of FSS (e.g. Engeser & Rheinberg, 2008 and N = 246) and it is generally sufficient for the purpose of the study, taking into account the inherent difficulties of the quantitative state flow measurement (Engeser & Rheinberg, 2008) , where the respondent should be involved in a skill-related activity (Keller & Landhäußer, 2012) .
Moreover, items 11 - 13 (about perceived importance) were not included in the analyses because Schiepe-Tiska and Engeser (2017) indicate that FSS scale consists of ten items and the additional items are designed separately to assess perceived demand/skills fit. Thus, our sample to variable ratio was 16 participants per item. This value is above the generally accepted value of 5 to 10 participants per item for up to about 300 cases ( Tinsley & Tinsley, 1987 as quoted in DeVellis, 2017 ). In a similar vein, Comrey ( Comrey, 1988; Comrey & Lee, 1992 ) argued that a sample size of 200 cases is generally adequate, if the scale has <40 items. Although the importance of sample size to the validity of the factor analysis is a complicated issue, these simple rules of thumb are generally accepted and used over the years (DeVellis, 2017) .
3.2. Reliability and Validity
To evaluate the reliability and validity of FSS (N = 160) the following methods were used: First, Cronbach’s alpha coefficient (α; Cronbach, 1951 ) was assessed to measure internal consistency of the FSS item responses. A Cronbach’s alpha ≥ .70 is generally acceptable (Hair et al., 2010) or ≥ .80 satisfactory (Nunnally & Berstein, 1997) . However, Kline (1999) suggested that this value can be as low as .60 for psychological constructs. Second, Omega Total coefficient (ω; McDonald, 1999 ) was estimated to measure construct reliability (Hoque et al., 2017) . Omega Total measures either the total or per latent factor variance (Brunner et al., 2012) . Values ≥ .70 are acceptable (Hair et al., 2010) ; (c) Average Variance Extracted (AVE; Fornell & Larcker, 1981 ) to estimate convergent validity. Omega alone is occasionally an elusive reliability criterion, potentially permitting an error variance as high as 50% (Malhotra & Dash, 2011) . Therefore, AVE, was here computed in cohort with ω coefficient, as a more conservative convergent validity (Malhotra & Dash, 2011) . The suggested minimum value for AVE is .50 (Fomell & Larcker, 1981; Hair et al., 2010; Awang et al., 2015 ).
Furthermore, the following should be noted regarding the evaluation of alpha coefficient of FSS. Preliminary analysis indicated that Cronbach’s alpha for the ABA factor proposed by Engeser and Rheinberg (Engeser and Rheinberg, 2008; Engeser, 2012) was below the generally acceptable limit of .60 - .70 ( Kline, 1999; Hair et al., 2010 ; see results in Table 2). Thus, the modified two-factor item allocation, compatible with the Greek context (see Table 1) was evaluated in an
Table 2. Internal Reliability and Construct Reliability for optimal FSS CFA models.
FP = Fluency of Performance, ABA = Absorption by activity.
attempt to improve internal consistency of the original ABA factor (see Table 2 for alpha coefficients).
In general, reliability analysis confirmed initial reservations about the incompatibility of the original two-factor item allocation for the Greek culture. Also, the need to either remove and/or reverse-score item 10 emerged to improve alpha coefficients of ABA and FSS total. Specifically, for the original FSS the total internal reliability (see Table 3) although satisfactory (.79) it would benefit from the removal of item 10 (.83). Nevertheless, the alpha was unsatisfactory for ABA (.34) but not for FP (.84). The pattern was repeated after reverse-scoring item 10. Remember item 10 was the one that raised issues during translation because of the negative meaning. Also note that both ABA and FSS total alpha would benefit from the removal of item 10 (Table 3).
On the contrary, for the modified two-factor structure proposed for the Greek context with different item allocation per factor (see Table 1), alphas were adequate for both ABA (.74) and FP (.65). Finally, FSS-6 Short had adequate alphas in all factors, taking into account the brevity of the scale, since alpha depends on the number of items evaluated (Cortina, 1993; Nunnally & Bernstein, 1995). Likewise, Omega coefficient was adequate for the total FSS, acceptable for the modified two-factor structure, and equally acceptable for FSS-6 Short. Regarding AVE, for both the modified two factor structure proposed for the Greek context and the FSS-6 Short, AVEs were below acceptable limits (see in Table 2).
3.3. Univariate and Multivariate Normality
The data violated the assumption of univariate normality. All Kolomogorov-Smirnov tests (Massey, 1951) on each one of the 10 items of FSS were statistically significant with p = .000, indicating a non-normal distribution. Specifically, Kolomogorov-Smirnov ranged from D (160) = .17 to D (160) = .24, all p = .000. Next, to estimate multivariate normality four tests were carried out: 1) Mardia’s multivariate kurtosis test (Mardia, 1970) ; 2) Mardia’s multivariate skewness test (Mardia, 1970) ; 3) Henze-Zirkler’s consistent test (Henze & Zirkler, 1990) , and 4) Doornik-Hansen omnibus test (Doornik & Hansen, 2008) . The null hypothesis was rejected for all four tests, indicating a violation of multivariate normality. Specifically, Mardia’s multivariate skewness was 21.66, χ2 (220) = 590.25, p = .0000. Mardia’s multivariate kurtosis was 154.39, χ2 (1) = 197.13, p = .0000. Henze-Zirkler multivariate test was 1.5742, χ2 (1) = 1518.34, p = .0000 and finally chi-square for the Doornik-Hansen test was χ2 (20) = 43.67, p = .0017.
3.4. Evaluation of Construct Validity with Confirmatory Factor Analysis (CFA)
Given the results of the normality tests, CFA was carried out with MLR for the estimation of parameters (c.f. Muthen & Muthen, 2012 ). MLR is a rescaling-based estimation method appropriate for non-normal distributions and unlike similar approaches it offers standard errors and chi-square test (Wang &
Table 3. Model fit of the FSS models tested.
Parameter estimator = MLR; FP = Fluency of Performance, ABA = Absorption by activity; ICM-CFA = Cluster Model Confirmatory Factor Analysis, Bifactor CFA = Bifactor Confirmatory Factor Analysis, ESEM = Exploratory Structural Equation Modeling, Bifactor ESEM = Bifactor Exploratory Structural Equation Modeling; TLI = Tucker-Lewis index, CFI = comparative fit index, RMSEA = root mean square error of approximation (90% CI), SRMR = standardized root mean square residual, CI = confidence Interval; Bold indicates optimal fit models. FSS Short = items 1, 2, 6, 7, 8, 9.
Wang, 2012) . Moreover, MLR is suitable for small samples (Bentler & Yuan, 1999; Muthen & Asparouhov, 2002; Wang & Wang, 2012) . Goodness of fit was evaluated by the following fit measures: The Standardized Root Mean Square Residual (SRMR), the Root Mean Square Error of Approximation (RMSEA, 90% CI), the Comparative Fit Index (CFI), the Tucker-Lewis index (TLI), and finally the Chi-square/df ratio. Acceptable fit was evaluated based on the following standards (Hu & Bentler, 1999; Brown, 2015) : RMSEA ≤ .06 (90% CI ≤ .06), SRMR≤ .08, CFI ≥ .95 and TLI ≥ .95 and lastly chi-square/DFratio < 3 (Kline, 2016) . The comparison of multiple fit indices offers a more reliable evaluation of model fit (Brown, 2015) . Additionally, alternative CFA models were tested with item 10, without item 10, and with item 10 reversed-scored (see Table 3).
Based on prior empirical evidence, the following models were evaluated. MODEL 1 is a single factor model with all 10 FSS items in a single factor without item 10 reversed. Similarly, MODEL 2 is a single-factor model with item 10 reversed-scored. A unidimensional structure for the10 FSS flow items was proposed by Engeser and Rheinberg (2008) . Besides, it is a standard practice to test a single-factor model, evaluating the assumption of maximum parsimony (Crawford & Henry, 2004; Brown, 2015) . MODEL 3 is the two-factor structure proposed by Rheinberg et al. (Rheinberg et al., 2003; Engeser & Rheinberg, 2008; Engeser, 2012) with the two flow factors: fluency of performance (FP; items 2, 4, 5, 7, 8, 9) and absorption by activity (ABA; items 1, 3, 6, 10). MODEL 4 is a variation of MODEL 3 with error covariances added. MODEL 5 is the two factor model proposed by Rheinberg et al. (Rheinberg et al., 2003; E ngeser & Rheinberg, 2008; Engeser, 2012) without item 10 because its factor loading was negative, as shown in the factor loadings range of the single factor models (Table 3). MODEL 6 is a variation of MODEL 5 with error covariances added. MODEL 7 is the modified two-factor item allocation, compatible with the Greek context, having items 1, 8, 9 in the FP factor and items 2 - 7, 10 in the ABA factor (see Table 1 for comparison to the original item allocation). MODEL 8 is a variation of MODEL 7 without item 1. MODEL 9 is a new, empirical-based structure of FSS with 6 instead of 10 items separated in two factors (FP factor with items 1, 8, 9 and ABA factor with items 2, 6, 7). Models 1 - 9 were all Independent Cluster Model Confirmatory Factor Analysis models (ICM-CFA). In ICM-CFA secondary factor loadings are by default assigned a zero value (Howard et al., 2016) . On the contrary, MODEL 10 is an ESEM with the original 2-factor structure proposed by Rheinberg et al. (Rheinberg et al., 2003; Engeser & Rheinberg, 2008; Engeser, 2012) . ESEM (Asparouhov & Muthen, 2009) is a hybrid method of EFA, CFA, and SEM that potentially resolves misspecifications inherently present in ICM-CFA (Marsh et al., 2014) . CFA misspecification problems are mainly attributed to zero-constrained secondary factor loadings, resulting to inflated factor loadings (Marsh et al., 2014) . Next, MODELS 11-16 are Bifactor CFA (Schmid & Leiman, 1957) and Bifactor ESEM (c.f. Reise, 2012; Marsh et al. 2013 ) models. Reise et al. (2007) recommend the evaluation of Bifactor models as a good practice when evaluating factor structure. Apart from that, factor correlations between ABA and FP were > .65 in all alternative models tested (see Table 3), generally designating a Bifactor structure (Hammer & Toland, 2016) . More specifically, MODEL 11 is a Bifactor CFA structure with a General Flow factor and ABA and FP as specific factors using the item allocation proposed by Rheinberg et al. (Rheinberg et al., 2003; Engeser & Rheinberg, 2008; Engeser, 2012) and item 10 reversed. MODEL 12 is a Bifactor ESEM variation of MODEL 11. MODEL 13 is a Bifactor CFA structure with a General Flow Factor and ABA (items 2 - 7 and10 reversed) and FP (items 1, 8, 9) as specific factors with an alternative item allocation customized for the Greek context. A higher order structure on the flow construct was elaborated by Moneta (2012) . However, a higher order structure cannot be evaluated for FSS, because it has a two factor structure (Wang & Wang, 2012) . However, Bifactor structures can successfully replicate higher order structures (Howard et al., 2016) , without the above limitations. MODEL 14 is a Bifactor ESEM variation of MODEL 13. Finally, MODEL 15 is a Bifactor CFA model with all 10 FSS items loading on the General Flow factor but only 6 items loading on two specific factors (FP with items 1, 8, 9 and ABA with items 2, 6, 7). See in Table 3 all 15 models evaluated.
The fit for each of the alternative models evaluated was the following. MODEL 1 and 2 with a single-factor structure had a poor fit. However, from their factor loadings (Table 3) the need for reversing item 10 was evidenced. MODEL 3, the original 2-factor structure with item 10 reversed, also had an unsatisfactory fit. MODEL 4 had a tolerable fit due to error covariances added. In MODEL 5the fit was only marginally improved after item 10 removal but remained inadequate. MODEL 6 (basically MODEL 5 with error covariances added) had a marginally improved fit. Note that factor loadings for the original bi-dimensional MODELS 3 - 6 were also comparable (from .117 to .795). MODEL 7, the modified two-factor item allocation had all fit indexes within acceptable limits with a very good fit. The removal of item 10 (MODEL 8) marginally improved fit. In MODEL 9, the shorter FSS alternative showed a good fit with 3 fit indices in maxim possible values and acceptable factor loadings. The ESEM MODEL 10 had an acceptable fit but with cross-loadings and unsatisfactory factor loadings (see Table 3). Regarding Bifactor models tested, they all generally had an adequate fit with some indexes at maximum values (in Bifactor ESEM MODELS 12 and 14). Finally, fit statistics for MODEL 15, were good. In general, it must be noted that factor loadings of the specific factors in all Bifactor models were unsatisfactory despite the good fit statistics (see Table 3 for details).
Taking into consideration the goodness-of-fit indices and the factor loadings (Table 3), three competing optimal models emerged: 1) The modified 2-factor model with ABA and FP having a different item allocation, customized for the Greek context (MODEL 7), Chi-square = 45.95, chi-square/df = 1.35, CFI = .964, TLI = .952, RMSE = .047, SRMR = .058, with factor loadings ranging from .145 to .822 for the ABA factor and from .351 to .805 for the FP factor. The two factors were inter-correlated with a value of .760, suggesting a strong relation between them (see Figure 1(a)). 2) The short version of FSS with 6 items in 2 3-item factors (MODEL 9) had also a very good fit, Chi-square = 6.53, chi-square/df = .82, CFI = 1.000, TLI = 1.000, RMSE = .000, SRMR = .030, with factor loadings ranging from .610 to .679 for the ABA factor and from .360 to .764 for the FP factor. Moreover, covariance between the two factors was .868 indicating a very strong relation between the two factors (see Figure 1(b). 3) The Bifactor CFA model with a General Flow factor with 10 items and two specific factors (ABA; items 2, 6, 7 and FP; items 1, 8, 9). However, despite the good fit, factor loadings in the specific factors were unsatisfactory (see Figure 1(c). After considering the above findings, we will use the modified 2-factor model having the original factors with different item allocation (MODEL 7) and the short version of FSS with 6 items in 2 factors (MODEL 9) in subsequent analyses.
3.5. Multiple Indicators Multiple Causes Modeling (MIMIC)
CFA with covariates or MIMIC modeling is an alternative method for examining invariance of indicators and latent means in multiple groups, by regressing them onto covariates indicating group membership. Crucially, MIMIC models are
 (a)
(a)
 (b)
(b)
 (c)
(c)
Figure 1. Path diagrams of the three optimal models emerged: (a) The 2-factor original FSS structure with different allocation of items probably due to cultural differences; (b) A shorter alternative of FSS with 6 items in the two original factors; (c) The bifactor structure with the 6 items of FSS-6 short load on the specific ABA and FP factors and a general flow factor with all 10 items of FSS (an hybrid Bifactor structure of A and B above).
more appropriate for small samples (even of N = 150) than multiple-group CFA (Brown, 2015: pp. 273-274) .
Initially, a viable measurement model was necessary, collapsing across specified groups (i.e., a typical ICM-CFA model). The modified 2-factor model with ABA and FP having a different item allocation for the Greek context was used for this purpose in the full sample (N = 160), because it showed optimal fit in the CFA. Then, the covariates of age (≤35 = 0 and ≥36 = 1) and marital status (single, divorced, widowed=0 and married =1) were added to examine their direct effects on the factors and selected indicators of the model (see Figure 2). The results showed that the fit of this model (M1) was not acceptable (see Table 4 and Figure 2(a)). The effect of age on ABA factor was positive and statistically significant, .489, p = .010. Likewise, the effect of age on FP factor was positive and statistically significant, .226, p = .003. Thus, respondents in the age of 36 (the mean age in the sample) or older have a higher mean than those in the age of 35 or younger, on both ABA and FP (measurement noninvariance). Regarding the covariate of marital status, the effect of marital status was positive and not statistically significant, on ABA .298, p = .070. and on FP, .106, p = .125. The explained variances in the ABA and FP vary from .11 to .15.
After investigating the effect of the age and marital status covariates on ABA and FP factors, we also examined whether these covariates directly affected the observed endogenous indicators (i.e. Differential item functioning; Muthén, 1989 ). Therefore, a direct effect of marital status was added on item 6 (“I am totally absorbed in what I am doing”), suggested by modification indices (see Figure 2(b)). The results showed that this model (M2) fitted the data well (Table 4). The effect of marital status on item 6 was negative and statistically significant, −.689, p = .000, suggesting that item 6 is not invariant (population heterogeneity). The above findings are supported by empirical literature reporting significant association of flow with age (Sahoo & Sahu 2009) .
3.6. Concurrent Validity
Correlation analysis was implemented using a measure of subjective well-being (SWLS; Diener et al., 1985 ) and two measures of positive emotionality and negative emotionality (SPANE; Diener et al., 2009, 2010 ; SPANE-8, Kyriazos et al., in press ). Table 5 presents the results of the correlation analysis.
Table 4. Goodness of fit statistics of MIMIC models evaluated.
Estimator = MLR, MS = marital status; RMSEA = Root Mean Square Error of Approximation; CFI = Comparative Fit Index, TLI = Tucker-Lewis Index; CI = confidence interval.
Table 5. Correlation Analysis of FSS to examine concurrent validity.
All p values were < .01. SPANE P = SPANE POSITIVE, SPANE N = SPANE NEGATIVE, SPANE B = SPANE AFFECT BALANCE; SPANE-8 N = Bad, Sad, Afraid, Angry, SPANE-8 P = Pleasant, Happy, Joyful, Contented.
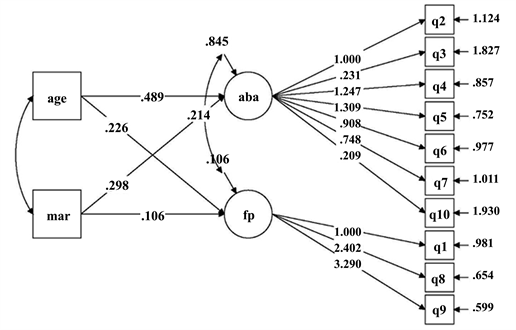 (a)
(a) (b)
(b)
Figure 2. Path diagrams of the two MIMIC Models tested. (a) ICM-CFA with the covariates of age (above and below mean sample age), and marital status (married, non-married); (b) MIMIC model with direct effect of marital status on Item 6 according to modification indexes.
For the original FSS (Rheinberg et al., 2003; Engeser & Rheinberg, 2008; Engeser, 2012) the correlations with the affect scales were moderate to strong, ranging for FP from −.49 (SPANE-12 N) to .58 (SPANE-8 B), for ABA from −.33 (SPANE-12 N) to .40 (SPANE-8 B), and for total FSS from −.50 (SPANE-12 N) to .59 (SPANE-8 B). The correlations of the original FSS with life satisfaction were also strong but of lesser magnitude (M = .45). The correlations between the modified 2-factorFSS with the affect scales were also moderately strong, ranging for FP from −.42 (SPANE-8 N) to .43 (SPANE-8 B), and for ABA from −.47 (SPANE-12 N) to .58 (SPANE-8 B). The correlations of the modified 2-factor FSS with life satisfaction were also moderate to strong, (M = .43). The correlation pattern of the FSS short was similar to the alternative FSS with moderate to strong correlations with the affect scales, ranging for FP from −.42 (SPANE-12 N) to .43 (SPANE-8 B), for ABA from −.42 (SPANE-12 N) to .50 (SPANE-8 B) and for Total FSS-6 form −.47 (SPANE-12 N) to .51 (SPANE-8 B). Finally, FSS-6 Short had moderate correlations to life satisfaction (M = .37), see Table 5 for details. The correlation of the total FSS-6 Short with the original FSS (Engeser, 2012) was very strong (.93).
4. Discussion
The focus of this research was to evaluate the psychometric properties of the Flow Short Scale (Rheinberg et al., 2003; Engeser & Rheinberg, 2008; Engeser, 2012) in Greek adults of the general population. Specifically, research objectives were the following: 1) To evaluate construct validity with Confirmatory Factor Analysisby applying techniques including ICM CFA, ESEM, Bifactor CFA and Bifactor ESEM. 2) To evaluate invariance for item intercepts and latent factor means with Multiple Indicators Multiple Causes (MIMIC) method, controlling for the effects of age and marital status. 3) To evaluate Internal Reliability, Construct Reliability (Hoque et al., 2017) and AVE-based convergent validity. 4) To examine the relation of FSS with a measure of subjective well-being (SWLS; Diener et al., 1985 ) and with two measures of emotionality (SPANE-12; Diener et al, 2009, 2010 ; SPANE-8; Kyriazos et al., in press ), demonstrating Concurrent Validity. The 3-faced construct validation method could not be implemented because of the inadequate sample size, so the proposed alternative method was implemented for small sample sizes (Kyriazos et al., in press) .
The main findings suggested that: 1) the bi-dimensional factor structure of FSS is confirmed but not with the original item allocation proposed (Rheinberg et al., 2003; Engeser & Rheinberg, 2008; Engeser, 2012) but with a modified item allocation (see Table 1), that is probably a culture-specific effect; 2) a shorter, 6-item version of FSS also emerged having the original two factors of ABA and FP (with 3 items each); 3) The modified bi-dimensional model and the Shorter FSS had satisfactory internal consistency and construct reliability (Hoque et al., 2017) . 4) A MIMIC model indicated a significant direct effect of the age covariate on FSS factors thus, population heterogeneity. A significant direct effect of marital status on an indicator (item 6, I am totally absorbed in what I am doing) was found, thus measurement noninvariance.
Initially, during the translation process, a modified item allocation occurred for ABA and FP for the Greek context. Additionally, items 11 - 13 (about perceived importance) were excluded from the analyses because the FSS scale consists of ten items measuring the nine components of flow (Jackson & Marsh, 1996; Jackson & Csikszentmihalyi, 1999; Engeser, 2012) . The additional items were designed separately for the evaluation of perceived demand/skills fit (Schiepe-Tiska & Engeser, 2017). Besides, Ellis et al. (1994) suggested that many facets of experience are not clearly connected to the flow construct and therefore cannot be regarded as flow indicators. In particular, variables like “wish to do the activity” have never been part of the flow experience (cited in Moneta, 2012 ).
Next, reliability analysis confirmed our initial reservations about the incompatibility of the original two-factor item allocation for the Greek culture because Cronbach’s alpha for the ABA factor (Engeser & Rheinberg, 2003, 2008; Engeser, 2012) was below the generally acceptable limits (Kline, 1999; Hair et al., 2010) . Thus, the modified item allocation for ABA and FP for the Greek context was evaluated in an attempt to improve internal consistency of the original ABA factor. This modified FSS bi-dimensional structure had acceptable internal reliability and construct validity (Hoque et al., 2017) . All AVE values were below the acceptability value. Finally, FSS-6 Short also had acceptable alphas despite the dependence of alpha scale length (Cortina, 1993; Green, Lissitz, & Mulaik, 1977; Nunnally & Bernstein, 1995) .
Moving into the CFA results, a total of 15 alternative CFA models were examined. Nine of them were ICM-CFA models, where secondary factor loadings are by default constrained to zero (Marsh et al., 2014; Howard et al., 2016) . On the contrary, one of the alternative models was an ESEM model (Asparouhov & Muthen, 2009) , where secondary factor loadings are freely estimated (Marsh et al., 2014) . Finally, three Bifactor CFA (Schmid & Leiman, 1957) and two Bifactor ESEM models (c.f. Reise, 2012 ) were examined. Summarizing fit results of the alternative models tested, single factor models showed poor fit, indicating that FSS in Greek context is a multidimensional measure. Fit indicators of models having the original 2-factor structure (Rheinberg et al., 2003; Engeser & Rheinberg, 2008; Engeser, 2012) did not achieve desired fit limits, both with and without item 10, or with item 10 reversed. ESEM models, despite the good fit statistics, had cross-loadings and unsatisfactory factor loadings. Likewise, all factor loadings of Bifactor models were unsatisfactory despite the good fit measures.
Taking into consideration the goodness-of-fit indices and factor loadings, two optimal models arose: 1) The modified 2-factor model with the original ABA and FP factors but different item allocation possibly due to context-specific effects; 2) The shorter version of FSS, having 6 items in two 3-item factors. This is an empirically derived version, supported also by flow theory (c.f. the 6 core facets of flow; Rheinberg, 2008 ); The Bifactor CFA model contained a General Flow factor with 10 items and two specific factors with 6 items (ABA; items 2, 6, 7 and FP; items 1, 8, 9). However, despite the good fit, the loadings in the specific factors were inadequate. Besides, dimensionality of a construct based only on Bifactor analysis ( Schmid & Leiman, 1957 ; c.f. Reise, 2012 ) has been criticized (Joshanloo, Jose, & Kielpikowski, 2017; Joshanloo & Jovanovic, 2016) .
Moreover, the modified 2-factor model with ABA and FP having a different item allocation for the Greek context was used as a measurement model in a CFA with covariates modeling (MIMIC), controlling on the effects of age (using mean age to create age groups) and marital status (married and non-married as the two groups were almost equally distributed) on ABA and FP because the sample size was inadequate for testing measurement invariance with the standard Multiple group CFA. On the contrary MIMIC can handle small sample sizes (Brown, 2015) . Results indicated that respondents in the age of 36 and older had a higher mean than those in the age of 35 and younger, on both ABA and FP factors (population heterogeneity). Additionally, item 6 (I am totally absorbed in what I am doing) is not invariant in married and non-married respondents (measurement noninvariance). Generally, to the best of our knowledge, all the above empirical findings cannot be compared to similar results, due to lack of empirical literature on FSS factor structure, especially using CFA techniques. However, a study in the Indian culture reported significant association of flow with age, education and income supporting MIMIC findings ( Sahoo & Sahu 2009 ; in Singh et al., 2016 ).
Finally, correlation analysis that followed showed that FSS had a moderately strong relation with both affect and life satisfaction, evidencing concurrent validity. These findings are confirmed by current research since flow was positively related with happiness and life satisfaction ( Sahoo & Sahu 2009 ; cited in Singh et al., 2016) . Moreover, studies on flow reported similar findings about the relation of flow with Scale of Positive and Negative Experiences (Diener et al., 2009, 2010) and Flourishing Scale (Singh et al., 2016) .
5. Conclusion
Engeser and Schiepe (2012) pointed out the need of integration and standardization of the existing measurement methods and tools because models and measurement methods are vital to the development and application of flow (in Moneta, 2012 ). The purpose of this research was in line with these suggestions. The most prominent finding is that FSS is not a unidimensional but a bi-dimensional measure of flow in Greek context, having the original factors but with different items allocated to them. However, despite the positive findings, this alternative structure remains to be tested in different samples. FSS-6 short is an empirically derived version, also supported by flow theory (about the 6 core facets of flow; Rheinberg, 2008 ), but additional validation is required. However, initial results of the above proposed that structures are promising, suggesting two valid and reliable structures for the measurement of flow. On the other hand, additional research in a larger sample is necessary to verify these promising, initial results, as well as to investigate inadequate AVE results. Moreover, the results of this ad hoc sample must be generalized with caution (Kline, 2009) , however this is a common place in many research designs in psychology, i.e. student samples (Sears, 1986; Little, 2013). Nevertheless, these preliminary findings on the modified 2-factor solution of FSS and FSS-6 short are promising, suggesting that both versions are valid and reliable tools for measuring flow in the Greek context.
Cite this paper
Kyriazos, T. A., Stalikas, A., Prassa, K., Galanakis, M., Flora, K., & Chatzilia, V. (2018). The Flow Short Scale (FSS) Dimensionality and What MIMIC Shows on Heterogeneity and Invariance. Psychology, 9, 1357-1382. https://doi.org/10.4236/psych.2018.96083
References
- 1. Asparouhov, T., & Muthen, B. (2009). Exploratory Structural Equation Modeling. Structural Equation Modeling, 16, 397-438. https://doi.org/10.1080/10705510903008204 [Paper reference 2]
- 2. Awang, Z., Afthanorhan, A., & Asri, M. A. M. (2015). Parametric and Non Parametric Approach in Structural Equation Modeling (SEM): The Application of Bootstrapping. Modern Applied Science, 9, 58-67. https://doi.org/10.5539/mas.v9n9p58 [Paper reference 1]
- 3. Bentler, P. M., & Yuan, K. H. (1999). Structural Equation Modeling with Small Samples: Test of Global Self-Esteem. Journal of Personality and Social Psychology, 89, 623-642. [Paper reference 1]
- 4. Berlyne, D. E. (1960). Conflict, Arousal and Curiosity. New York, NY: McGraw-Hill. https://doi.org/10.1037/11164-000 [Paper reference 2]
- 5. Boniwell, I. (2012). Positive Psychology in a Nutshell, the Science of Happiness (3rd ed.). England: Open University Press, McGraw-Hill Education. [Paper reference 4]
- 6. Brislin, R., Lonner, W., & Thorndike, R. (1973). Cross-Cultural Research Methods. New York, NY: John Wiley & Sons. [Paper reference 1]
- 7. Brown, T. A. (2015). Confirmatory Factor Analysis for Applied Research (2nd ed.). New York, NY: Guilford Publications. [Paper reference 5]
- 8. Brunner, M., Nagy, G., & Wilhelm, O. (2012). A Tutorial on Hierarchically Structured Constructs. Journal of Personality, 80, 796-846. https://doi.org/10.1111/j.1467-6494.2011.00749.x
- 9. Comrey, A. L. (1988). Factor Analytic Methods of Scale Development in Personality and Clinical Psychology. Journal of Consulting and Clinical Psychology, 56, 754-761. https://doi.org/10.1037/0022-006X.56.5.754
- 10. Comrey, A. L., & Lee, H. B. (1992). A First Course in Factor Analysis (2nd ed.). Hillsdale, NJ: Erlbaum.
- 11. Cortina, J. M. (1993). What Is Coefficient Alpha? An Examination of Theory and Applications. Journal of Applied Psychology, 78, 98-104. https://doi.org/10.1037/0021-9010.78.1.98 [Paper reference 1]
- 12. Crawford, J. R., & Henry, J. D. (2004). The Positive and Negative Affect Schedule (PANAS): Construct Validity, Measurement Properties and Normative Data in a Large Non-Clinical Sample. British Journal of Clinical Psychology, 43, 245-265. https://doi.org/10.1348/0144665031752934 [Paper reference 1]
- 13. Cronbach, L. J. (1951). Coefficient Alpha and the Internal Structure of Tests. Psychometrika, 16, 297-334. https://doi.org/10.1007/BF02310555 [Paper reference 2]
- 14. Csikszentmihalyi, M. (1975/2000). Beyond Boredom and Anxiety: Experiencing Flow in Work and Play (2nd ed.). San Francisco, CA: Jossey Bass. [Paper reference 3]
- 15. Csikszentmihalyi, M. (1978). Attention and the Holistic Approach to Behavior. In K. S. Pope, & J. L. Singer (Eds.), The Stream of Consciousness (pp. 335-356). New York: Plenum. https://doi.org/10.1007/978-1-4684-2466-9_13 [Paper reference 1]
- 16. Csikszentmihalyi, M. (1990). Flow: The Psychology of Optimal Experience. New York, NY: Harper Perennial. [Paper reference 1]
- 17. Csikszentmihalyi, M. (1996). Creativity. New York, NY: HarperCollins. [Paper reference 1]
- 18. Csikszentmihalyi, M. (2014). Flow and the Foundations of Positive Psychology. The Netherlands: Springer. https://doi.org/10.1007/978-94-017-9088-8 [Paper reference 3]
- 19. Csikszentmihalyi, M., & Csikszentmihalyi, I. (1988). Optimal Experience: Psychological Studies of Flow in Consciousness. Cambridge: Cambridge University Press. https://doi.org/10.1017/CBO9780511621956 [Paper reference 4]
- 20. Csikszentmihalyi, M., & LeFevre, J. (1989). Optimal Experience in Work and Leisure. Journal of Personality and Social Psychology, 56, 815-822. https://doi.org/10.1037/0022-3514.56.5.815 [Paper reference 1]
- 21. Csikszentmihalyi, M., & Robinson, R. (1990). The Art of Seeing. Malibu, CA: J. Paul Getty Museum and the Getty Center for Education in the Arts. [Paper reference 1]
- 22. Csikszentmihalyi, M., Larson, R. J., & Prescott, S. (1977). The Ecology of Adolescent Activity and Experience. Journal of Youth and Adolescence, 6, 281-294. https://doi.org/10.1007/BF02138940 [Paper reference 2]
- 23. Debus, M. E., Sonnentag, S., Deutsch, W., & Nussbeck, F. W. (2014). Making Flow Happen: The Effects of Being Recovered on Work-Related Flow between and within Days. Journal of Applied Psychology, 99, 713-722. https://doi.org/10.1037/a0035881 [Paper reference 1]
- 24. DeCharms, R. (1968). Personal Causation. New York, NY: Academic Press. [Paper reference 1]
- 25. Deci, E. L., & Ryan, R. M. (1980). The Empirical Exploration of Intrinsic Motivational Processes. In L. Berkowitz (Ed.), Advances in Experimental Social Psychology (pp. 39-80). New York, NY: Academic Press. https://doi.org/10.1016/S0065-2601(08)60130-6 [Paper reference 1]
- 26. Delle Fave, A. (2013). Past, Present and Future of Flow. In S. A. David, I. Boniwell, & A. ConleyAyers (Eds.), The Oxford Handbook of Happiness (pp. 60-72). New York, NY: Oxford University Press. https://doi.org/10.1093/oxfordhb/9780199557257.013.0005 [Paper reference 3]
- 27. DeVellis, R. F. (2017). Scale Development: Theory and Applications (4th ed.). Thousand Oaks, CA: Sage. [Paper reference 2]
- 28. Diener, E., Emmons, R. A., Larsen, R. J., & Griffin, S. (1985). The Satisfaction with Life Scale. Journal of Personality Assessment, 49, 71-75. https://doi.org/10.1207/s15327752jpa4901_13 [Paper reference 4]
- 29. Diener, E., Wirtz, D., Biswas-Diener, R., Tov, W., Kim-Prieto, C., Choi, D., et al. (2009). New Measures of Well-Being. The Netherlands: Springer. https://doi.org/10.1007/978-90-481-2354-4_12 [Paper reference 2]
- 30. Diener, E., Wirtz, D., Tov, W., Kim-Prieto, C., Choi, D., Oishi, S., & Biswas-Diener, R. (2010). New Well-Being Measures: Short Scales to Assess Flourishing and Positive and Negative Feelings. Social Indicators Research, 97, 143-156. https://doi.org/10.1007/s11205-009-9493-y [Paper reference 6]
- 31. Doornik, J. A., & Hansen, H. (2008). An Omnibus Test for Univariate and Multivariate Normality. Oxford Bulletin of Economics and Statistics, 70, 927-939. https://doi.org/10.1111/j.1468-0084.2008.00537.x [Paper reference 2]
- 32. Ellis, G. D., Voelkl, J. E., & Morris, C. (1994). Measurements and Analysis Issues with Explanation of Variance in Daily Experience Using the Flow Model. Journal of Leisure Research, 26, 337-356. https://doi.org/10.1080/00222216.1994.11969966 [Paper reference 1]
- 33. Engeser, S. (2012). Advances in Flow Research. New York, NY: Springer. https://doi.org/10.1007/978-1-4614-2359-1 [Paper reference 19]
- 34. Engeser, S., & Rheinberg, F. (2008). Flow Performance and Moderators of Challenge-Skill Balance. Motivation & Emotion, 32, 158-172. https://doi.org/10.1007/s11031-008-9102-4 [Paper reference 23]
- 35. Engeser, S., & Schiepe-Tiska, A. (2012). Historical Lines and an Overview of Current Research on Flow. In S. Engeser (Ed.), Advances in Flow Research (pp. 1-22). New York: Springer. [Paper reference 3]
- 36. Fornell, C., & Larcker, D. F. (1981). Structural Equation Models with Unobservable Variables and Measurement Error: Algebra and Statistics. Journal of Marketing Research, 18, 382-388. https://doi.org/10.2307/3150980 [Paper reference 1]
- 37. Fullagar, C., Delle Fave, A., & Van Krevelen, S. (2017). Flow at Work: The Evolution of a Construct. In C. Fullagar, A. Delle Fave, & S. Van Krevelen (Eds.), Flow at Work, Measurement and Implications (pp. 1-39). New York: Routledge. [Paper reference 1]
- 38. Getzels, J. W., & Csikszentmihalyi, M. (1976). The Creative Vision. New York, NY: Wiley. [Paper reference 1]
- 39. Goldberg, I. I., Harel, M., & Malach, R. (2006). When the Brain Loses Its Self: Prefrontal Inactivation during Sensorimotor Processing. Neuron, 50, 329-339. https://doi.org/10.1016/j.neuron.2006.03.015 [Paper reference 1]
- 40. Green, S. B., Lissitz, R. W., & Mulaik, S. A. (1977). Limitations of Coefficient Alpha as an Index of Test Unidimensionality. Educational and Psychological Measurement, 37, 827-836. https://doi.org/10.1177/001316447703700403 [Paper reference 1]
- 41. Hair, J., Black, W., Babin, B., & Anderson, R. (2010). Multivariate Data Analysis (7th ed.). Upper Saddle River, NJ: Prentice-Hall, Inc. [Paper reference 5]
- 42. Hammer, J. H., & Toland, M. D. (2016). Bifactor Analysis in Mplus. Lexington, KY: University of Kentucky. http://sites.education.uky.edu/apslab/upcoming-events/ [Paper reference 2]
- 43. Hebb, D. O. (1955). Drives and the CNS. Psychological Review, 62, 243-254. https://doi.org/10.1037/h0041823 [Paper reference 1]
- 44. Henze, N., & Zirkler, B. (1990). A Class of Invariant Consistent Tests for Multivariate Normality. Communications in Statistics-Theory and Methods, 19, 3595-3617. https://doi.org/10.1080/03610929008830400 [Paper reference 1]
- 45. Hoque, A. S., Awang, Z., Jusoff, K., Salleh, F., &Muda, H. (2017). Social Business Efficiency: Instrument Development and Validation Procedure Using Structural Equation Modeling. International Business Management, 11, 222-231. [Paper reference 6]
- 46. Howard, J., Gagné, M., Morin, A. J. S., Wang, Z. N., & Forest, J. (2016). Using Bifactor Exploratory Structural Equation Modeling to Test for a Continuum Structure of Motivation. Journal of Management, 1-59. [Paper reference 2]
- 47. Hu, L., & Bentler, P. M. (1999). Cutoff Criteria for Fit Indexes in Covariance Structure Analysis: Conventional Criteria versus New Alternatives. Structural Equation Modeling, 6, 1-55. https://doi.org/10.1080/10705519909540118 [Paper reference 1]
- 48. Hunt, J. (1965). Intrinsic Motivation and Its Role in Development. Nebraska Symposium on Motivation, 12, 189-282. [Paper reference 1]
- 49. IBM Corporation (2017). IBM SPSS Statistical Software, Release 25. Spring House, PA: IBM Corporation. [Paper reference 1]
- 50. Jackson, S. (1995). Factors Influencing the Occurrence of Flow State in Elite Athletes. Journal of Applied Sport Psychology, 7, 138-166. https://doi.org/10.1080/10413209508406962 [Paper reference 1]
- 51. Jackson, S. (1996). Toward a Conceptual Understanding of the Flow Experience in Elite Athletes. Research Quarterly for Exercise and Sport, 67, 76-90. https://doi.org/10.1080/02701367.1996.10607928 [Paper reference 2]
- 52. Jackson, S. A., & Csikszentmihalyi, M. (1999). Flow in Sports: The Keys to Optimal Experiences and Performances. Champaign, IL: Human Kinetics. [Paper reference 3]
- 53. Jackson, S. A., & Eklund, R. C. (2002). Assessing Flow in Physical Activity: The Flow State Scale-2 and Dispositional Flow Scale-2. Journal of Sport & Exercise Psychology, 24, 133-150. https://doi.org/10.1123/jsep.24.2.133 [Paper reference 3]
- 54. Jackson, S. A., & Eklund, R. C. (2004). Relationships between Quality of Experience and Participation in Diverse Performance Settings. Australian Journal of Psychology, 56, 193. [Paper reference 1]
- 55. Jackson, S. A., & Marsh, H. W. (1996). Development and Validation of a Scale to Measure Optimal Experience: The Flow State Scale. Journal of Sport & Exercise Psychology, 18, 17-35. https://doi.org/10.1123/jsep.18.1.17 [Paper reference 2]
- 56. Jackson, S. A., Thomas, P. R., Marsh, H. W., & Smethurst, C. J. (2001). Relationships between Flow, Self-Concept, Psychological Skills, and Performance. Journal of Applied Sport Psychology, 13, 129-153. https://doi.org/10.1080/104132001753149865 [Paper reference 1]
- 57. Joshanloo, M., & Jovanovic, V. (2016). The Factor Structure of the Mental Health Continuum-Short Form (MHC-SF) in Serbia: An Evaluation Using Exploratory Structural Equation Modeling. Journal of Mental Health, 26, 510-515. https://doi.org/10.1080/09638237.2016.1222058 [Paper reference 1]
- 58. Joshanloo, M., Jose, P. E., & Kielpikowski, M. (2017). The Value of Exploratory Structural Equation Modeling in Identifying Factor Overlap in the Mental Health Continuum-Short Form (MHC-SF): A Study with a New Zealand Sample. Journal of Happiness Studies, 8, 1061-1074. https://doi.org/10.1007/s10902-016-9767-4 [Paper reference 1]
- 59. Keller, J., & Bless, H. (2008). Flow and Regulatory Compatibility: An Experimental Approach to the Flow Model of Intrinsic Motivation. Journal of Personality and Social Psychology Bulletin, 34, 196-209. https://doi.org/10.1177/0146167207310026 [Paper reference 2]
- 60. Keller, J., & Landhäußer, A. (2012). The Flow Model Revisited. In S. Engeser (Ed.), Advances in Flow Research (pp. 51-64). New York: Springer.https://doi.org/10.1007/978-1-4614-2359-1_3 [Paper reference 4]
- 61. Kline, P. (1999). Handbook of Psychological Testing. London: Routledge. [Paper reference 4]
- 62. Kline, R. B. (2016). Principles and Practice of Structural Equation Modeling (4th ed.). New York, NY: The Guilford Press. [Paper reference 1]
- 63. Kyriazos, T. A., Stalikas, A., Prassa, K., Yotsidi, V. (2018). A 3-Faced Construct Validation and a Bifactor Subjective Well-Being Model Using the Scale of Positive and Negative Experience, Greek Version. Psychology, 9, 1143-1175. https://doi.org/10.4236/psych.2018.95071 [Paper reference 8]
- 64. Malhotra, N. K., & Dash, S. (2011). Marketing Research an Applied Orientation. London: Pearson Publishing. [Paper reference 2]
- 65. Mardia, K. V. (1970). Measures of Multivariate Skewness and Kurtosis with Applications. Biometrika, 57, 519-530. https://doi.org/10.1093/biomet/57.3.519 [Paper reference 2]
- 66. Marsh, H. W., Ludtke, O., Nagengast, B., Morin, A. J. S., & Von Davier, M. (2013). Why Item Parcels Are (Almost) Never Appropriate: Two Wrongs Do Not Make a Right—Camouflaging Misspecification with Item Parcels in CFA Models. Psychological Methods, 18, 257-284. https://doi.org/10.1037/a0032773 [Paper reference 1]
- 67. Marsh, H. W., Morin, A. J. S., Parker, P. D., & Kaur, G. (2014). Exploratory Structural Equation Modeling: An Integration of the Best Features of Exploratory and Confirmatory Factor Analysis. Annual Review of Clinical Psychology, 10, 85-110. https://doi.org/10.1146/annurev-clinpsy-032813-153700 [Paper reference 4]
- 68. Massey, F. J. (1951). The Kolmogorov-Smirnov Tests for Goodness of Fit. Journal of American Statistical Association, 46, 68-78. https://doi.org/10.1080/01621459.1951.10500769 [Paper reference 1]
- 69. Massimini, F., & Delle Fave, A. (2000). Individual Development in a Bio-Cultural Perspective. American Psychologist, 55, 24-33. https://doi.org/10.1037/0003-066X.55.1.24 [Paper reference 1]
- 70. McDonald, R. P. (1999). Test Theory: A Unified Treatment. Mahwah, NJ: Erlbaum. [Paper reference 2]
- 71. McReynolds, P. (1971). The Nature and Assessment of Intrinsic Motivation. In P. McReynolds (Ed.), Advances in Psychological Assessment (Vol. 2, pp. 157-177). Palo Alto: Science and Behavior Books. [Paper reference 1]
- 72. Moneta, G. B. (2012). On the Measurement and Conceptualization of Flow. In S. Engeser (Ed.), Advances in Flow Research (pp. 23-50). New York, NY: Springer. https://doi.org/10.1007/978-1-4614-2359-1_2 [Paper reference 15]
- 73. Moneta, G. B., & Csikszentmihalyi, M. (1996). The Effect of Perceived Challenges and Skills on the Quality of Subjective Experience. Journal of Personality, 64, 274-310. https://doi.org/10.1111/j.1467-6494.1996.tb00512.x [Paper reference 1]
- 74. Muthén, B. (1989). Latent Variable Modeling in Heterogeneous Populations. Psychometrika, 54, 557-585. https://doi.org/10.1007/BF02296397 [Paper reference 1]
- 75. Muthen, B., & Asparouhov, T. (2002). Using Mplus Monte Carlo Simulations in Practice: A Note on Non-Normal Missing Data in Latent Variable Models. Mplus Web Notes: No. 2. [Paper reference 2]
- 76. Muthen, L. K., & Muthen, B. O. (2012). Mplus Statistical Software, 1998-2012. Los Angeles, CA: Muthén & Muthén. [Paper reference 1]
- 77. Nakamura, J. (1988). Optimal Experience and the Uses of Talent. In M. Csikszentmihalyi, & I. Csikszentmihalyi (Eds.), Optimal Experience: Psychological Studies of Flow in Consciousness (pp. 319-326). Cambridge: Cambridge University Press. https://doi.org/10.1017/CBO9780511621956.019 [Paper reference 1]
- 78. Nakamura, J., & Csikszentmihalyi, M. (2005). The Concept of Flow. In C. R. Snyder, & S. J. Lopez (Eds.), Handbook of Positive Psychology (pp. 89-105). Oxford: University Press. [Paper reference 1]
- 79. Novak, T. P., Hoffman, D. L., & Yung, Y. (1997). Measuring the Flow Experience among Web Users. Paper Presented at the Interval Research Corporation, Project 2000, Vanderbilt University. [Paper reference 2]
- 80. Nunnally, J., & Berstein, I. (1995). Psychometric Theory. New York, NY: McGraw-Hill. [Paper reference 2]
- 81. Pavot, W., & Diener, E. (1993). The Affective and Cognitive Context of Self-Reported Measures of Subjective Well-Being. Social Indicators Research, 28, 1-20. https://doi.org/10.1007/BF01086714 [Paper reference 1]
- 82. Pavot, W., & Diener, E. (2008). The Satisfaction with Life Scale and the Emerging Construct of Life Satisfaction. The Journal of Positive Psychology, 3, 137-152. https://doi.org/10.1080/17439760701756946 [Paper reference 1]
- 83. Perry, S. K. (1999). Writing in Flow. Cincinnati, OH: Writer’s Digest Books. [Paper reference 1]
- 84. Pfister R. (2002). Flow im Alltag. Untersuchungen zum Quadrantenmodell des Flow-Erlebens und zum Konzept der autotelischen Personlichkeit mit der Experience Sampling Method (ESM) [Flow in Everyday Life: Studies on the Quadrant Model of Flow Experiencing and on the Concept of the Autotelic Personality with the Experience Sampling Method (ESM)]. Bern: Peter Lang. [Paper reference 2]
- 85. Puca, R. M., & Schmalt, H. D. (1999). Task Enjoyment: A Mediator between Achievement Motives and Performance. Motivation and Emotion, 23, 15-29. https://doi.org/10.1023/A:1021327300925 [Paper reference 1]
- 86. Quinn, R. W. (2005). Flow in Knowledge Work: High Performance Experience in the Design of National Security Technology. Administrative Science Quarterly, 50, 610-641. https://doi.org/10.2189/asqu.50.4.610 [Paper reference 1]
- 87. Reise, S. (2012). The Rediscovery of Bifactor Measurement Models. Multivariate Behavioral Research, 47, 667-696. https://doi.org/10.1080/00273171.2012.715555 [Paper reference 3]
- 88. Reise, S. P., Morizot, J., & Hays, R. D. (2007). The Role of the Bifactor Model in Resolving Dimensionality Issues in Health Outcomes Measures. Quality of Life Research, 16, 19-31. https://doi.org/10.1007/s11136-007-9183-7 [Paper reference 2]
- 89. Rheinberg, F. (2008). Intrinsic Motivation and Flow-Experience. In H. Heckhausen, & J. Heckhausen (Eds.), Motivation and Action (pp. 323-348). Cambridge, UK: Cambridge University Press. https://doi.org/10.1017/CBO9780511499821.014 [Paper reference 5]
- 90. Rheinberg, F., Manig, Y., Kliegl, R., Engeser, S., & Vollmeyer, R. (2007). Flow bei der Arbeit,doch Glóck in der Freizeit [Flow during Work but Happiness during Leisure Time: Goals, Flow-Experience, and Happiness]. Zeitschrift fór Arbeitsund Organisationspsychologie [Journal of Work and Organizational Psychology], 51, 105-115.
- 91. Rheinberg, F., Vollmeyer, R., & Engeser, S. (2003). Die Erfassung des Flow-Erlebens [The Assessment of Flow Experience]. In J. Stiensmeier-Pelster, & F. Rheinberg (Eds.), Diagnostik von Selbstkonzept, Lernmotivation und Selbstregulation [Diagnosis of Motivation and Self-Concept]. Göttingen: Hogrefe. [Paper reference 12]
- 92. Sahoo, F. M., & Sahu, R. (2009). The Role of Flow Experience in Human Happiness. Journal of the Indian Academy of Applied Psychology, 35, 40-47. [Paper reference 3]
- 93. Schmid, J., & Leiman, J. N. (1957). The Development of Hierarchical Factor Solutions. Psychometrika, 22, 53-61. https://doi.org/10.1007/BF02289209 [Paper reference 3]
- 94. Schuler, J. (2010). Achievement Incentives Determine the Effects of Achievement-Motive Incongruence on Flow Experience. Motivation and Emotion, 34, 2-14. https://doi.org/10.1007/s11031-009-9150-4 [Paper reference 1]
- 95. Seligman, E. P. (2002). Authentic Happiness. New York, NY: Free Press. [Paper reference 2]
- 96. Singh, K., Junnarkar, M., & Kaur, J. (2016). Measures of Positive Psychology, Development and Validation. Berlin: Springer. https://doi.org/10.1007/978-81-322-3631-3 [Paper reference 3]
- 97. StataCorp. (2015). Stata: Release 14. Statistical Software. College Station, TX: StataCorp. [Paper reference 1]
- 98. Tinsley, H. E. A., & Tinsley, D. J. (1987). Uses of Factor Analysis in Counseling Psychology Research. Journal of Counseling Psychology, 34, 414-424. [Paper reference 1]
- 99. Wang, J., & Wang, X. (2012). Structural Equation Modeling. Hoboken, NJ: Wiley, Higher Education Press. [Paper reference 4]
- 100. White, R. W. (1959). Motivation Reconsidered: The Concept of Competence. Psychological Review, 66, 297-333. [Paper reference 1]
- 101. Woodworth, R. S. (1918). Dynamic Psychology. New York, NY: Columbia University Press. [Paper reference 1]