Journal of Environmental Protection
Vol.4 No.6(2013), Article ID:33131,5 pages DOI:10.4236/jep.2013.46066
Release of Uranium by an Ore Treatment Unit at Caldas, MG, Brazil
![]()
1Multidisciplinary Group of Radioprotection (GMR), Serviço de Radioproteção, Unidade de Tratamento de Minério, Indústrias Nucleares do Brasil, Caldas, Brazil; 2Laboratory of Radiobiology and Radiometry Pedro Lopes dos Santos (LARARA-PLS), Group of Environmental Themes Assessment (GETA), Universidade Federal Fluminense (UFF), Niterói, Brazil; 3Interdisciplinary under Graduation in Science and Technology, Universidade Federal de Alfenas, Poços de Caldas, Brazil.
Email: pereiraws@gmail.com
Copyright © 2013 Wagner de S. Pereira et al. This is an open access article distributed under the Creative Commons Attribution License, which permits unrestricted use, distribution, and reproduction in any medium, provided the original work is properly cited.
Received March 15th, 2013; revised April 17th, 2013; accepted May 13th, 2013
Keywords: Uranium; Ore Treatment Unit; Caldas; Radionuclide Monitoring
ABSTRACT
This study aims to assess the behavior of the release of Unat (i.e. uranium isotopes in natural relative abundance) from the release of water treated by the Ore Treatment Unit (UTM) in Caldas, state of Minas Gerais, Brazil, during the years 1999 to 2009. During this period, the unit showed no industrial activity, except between 2004 and 2005, when UTM operated 400 tons of monazite in a process to obtain rare earths. Unat was analyzed by spectrophotometry once per week in the effluent waters at sampling point 014. Two fractions were considered for analysis: the soluble one (that passes through a 0.45 µm filter) and the particulate one (retained on a 0.45 µm filter). Statistical analyses were performed: the “Z” test and Pearson’s r2 correlation index. The values for the soluble fraction were consistently lower than those of the particulate fraction and no statistically significant correlation was observed between the soluble and particulate fractions. However, the particulate and the total fractions (the sum of soluble and particulate) strongly correlated.
1. Introduction
The Industrial Complex of Poços de Caldas (CIPC) was the first unit of uranium mining and milling in Brazil. It is located in the municipality of Caldas, Poços de Caldas plateau, state of Minas Gerais, Brazil. In the mid-1980s, with the end of the economic profitability of uranium exploitation, the CIPC was disabled.
In the years 2004 and 2005, the CIPC disabled facilities—now called Ore Treatment Unit (UTM, in Portuguese)—operated 400 tons of monazite in a process of obtaining rare earths. In all the other years, there was no industrial process.
The open pit deactivated mine, the deposits mine tailings and the radionuclide waste pond are sources of heavy metals and radionuclides that may cause environmental impact.
Thus, a program of effluent treatment was created with the objective of minimizing the environmental impact of the UTM operation. Similarly, an environmental monitoring program was undertaken to confirm that the effluent treatment actually mitigated impacts and maintained the effluents within the limits allowed by the Brazilian legislation for their release into the environment.
Several studies were conducted in the region to assess radiological environmental impact (REI) during plant operation [1-4], and other authors focused transport of radionuclides in the region during the same phase [5,6].
Before operation of the CIPC, the baseline of the region was established by Amaral et al. [7]. Brazilian law in force at that time [8] legislated on the additional dose, as well as the current does [9]. The management of the waste dump was studied by Fernandes [10] and Fernandes et al. [11], aiming the process of plant decommissioning.
The present study aims to assess the release of natural uranium by the ore treatment unit (UTM) over an 11 years period, from 1999 to 2009, in the soluble, particulate and total (sum of soluble and particulate) phases.
2. Methodology
The area of the study is located in the city of Caldas, state of Minas Gerais. Figures 1 and 2 shows details of the release point analyzed (point 014).
Five liter samples were collected weekly at point 014,
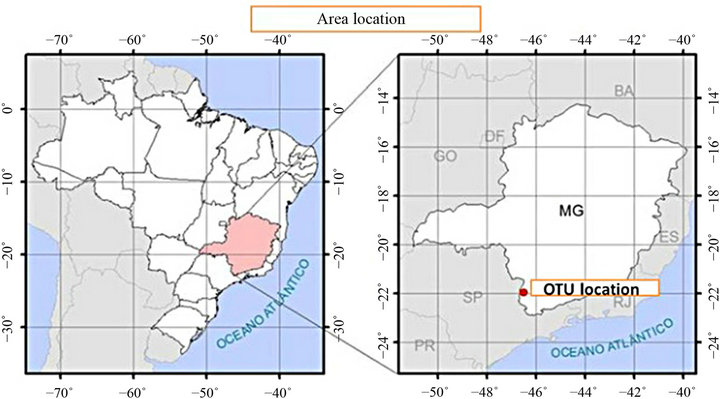
Figure 1. Localization of UTM in Brazil.
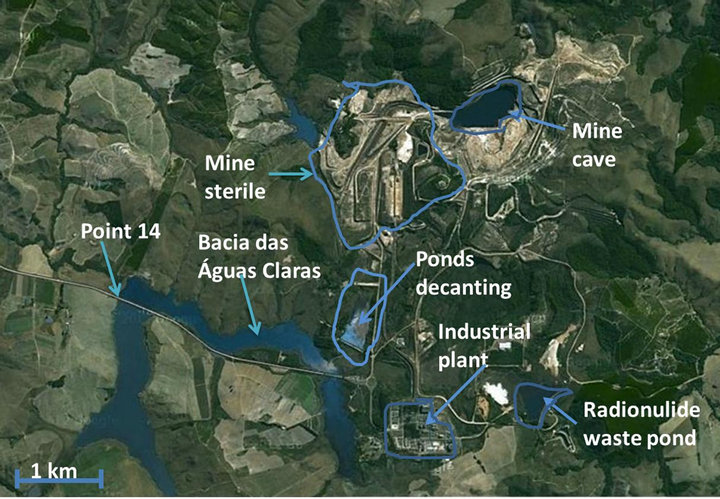
Figure 2. Localization of point 014, interface point between UTM and analyzed environment (Google Maps).
at the output of the Bacia das Águas Claras (Clear Water pond), see Figure 2. Aliquots of one liter were filtered through a cellulose acetate filter of porosity 0.45 µm. The fraction that passed through the filter was considered as the soluble fraction and material retained on the filter was considered as the particulate fraction. In both fractions concentrations of activity of Unat were analyzed in Bq∙l−1. The fraction of total (which is the sum of the soluble and particulate fractions) is used to evaluate doses surrounding the installation.
Uranium was analyzed using spectrometry with arsenazo, following Savvin [12]. Data were organized by date and analyzed fraction. A descriptive statistical analysis of data was carried out, evaluating mean, standard deviation, skewness and kurtosis and, and the number of analyzes performed.
A temporal series was performed and a trend line was established for this data series. Means between soluble and particulate fractions were compared using a Z test. Tested hypotheses were:
• H0 there are no differences between analysed means;
• H1 there is a difference between analysed means.
After that, the correlation analysis between fractions was established by the r2 Pearson test.
All statistical analyzes were performed using the Excel® statistical package, version 2010 for the Windows® environment.
3. Results
The results of the weekly monitoring along 11 years are resumed in Table 1, which reports a measure of central tendency (mean), of dispersion (standard deviation), two adjustments to the normal curve (skewness and kurtosis) and the total number of samples analyzed.
The Z test performed resulted in an absolute value of calculated Z (Zcalc) of 16.263, exceeding the critical uni caudal Z (Zcrit) of 1.645 with a P value associated to 0 (zero), thus resulting in a statistically significant difference between the means for particulate and soluble fractions, where the particulate fraction is considered statistically higher that the soluble fraction (Table 2).
The results of the time series for the total fraction showed a tendency to maintain the values of the total fraction converging to 0.26 Bq∙l−1; indeed, in the equation that represents the trend line data “y = 9.10−7 × + 0.26” the linear coefficient is 0.26 with a slope on the order of 10−7, which makes the trend line practically constant at 0.26 Bq∙l−1. The low r2 value (in the order of 10−5) demonstrates the great variability in the data set, with a standard deviation of 74% of the average. In this series there are two periods of growth that deviate from the series. The first runs from February to August 2005,
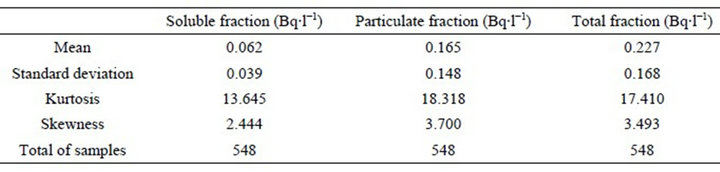
Table 1. Condensed statistical data of Unat release at point 014 (interface of UTM with the environment).
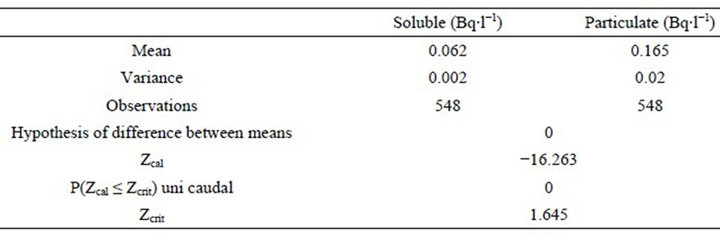
Table 2. Results of the Z test on differences between the means of soluble and particulate fractions.
while the second goes from January to September 2007, covering both roughly the same time of year (Figure 3).
When the total fraction is split into soluble and particulate fractions, the same two periods of increase observed for the total fraction appear in the particulate fraction while the soluble fraction remains virtually unchanged (Figure 4).
In the view of the apparent correlation between particulate and total fractions, the correlations between the soluble, particulate and total fractions were analyzed using Pearson’s r2 coefficient. Figure 5 reports the correlation between soluble and particulate fractions, Figure 6 between soluble and total, and Figure 7 between particulate and total.
In Figure 5 there is a cloud of points associated with lower values of concentration of activity and very few points associated with higher values. The value of Pearson’s r2 coefficient was 0.17 indicating complete independence between these fractions.
Figure 6, repeats the pattern of Figure 5, although with a better fit, resulting in a Pearson’s r2 coefficient of 0.36 which is still insufficient to prove any association between variables, even though the soluble fraction is a component of the total one.
On the contrary, Figure 7 shows a closer correlation than observed in Figures 5 and 6. The correlation between the particulate fraction and the total fraction appeared to be strong with Pearson’s r2 coefficient close to 0.96, demonstrating a close correlation between both variables.
4. Discussion and Conclusions
The concentrations of activity of the particulate fraction were considered statistically higher than those of the
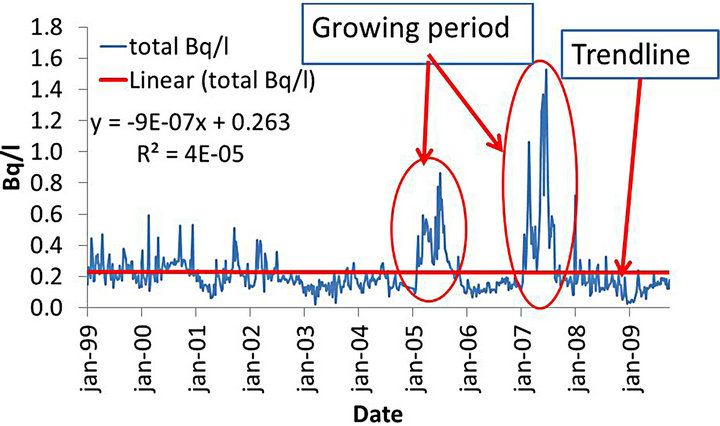
Figure 3. Time series of analyzed samples of natural uranium in water at point 014 of UTM in the total fraction (sum of particulate and soluble fractions), trend line and trend line adjustment equation.
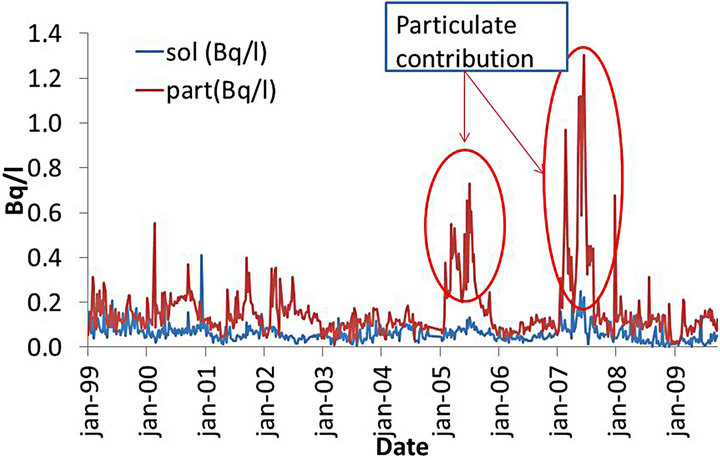
Figure 4. Time series of analyzed samples of natural uranium in water at point 014 of UTM in the soluble and particulate fractions.
soluble fraction.
The total fraction showed a tendency to maintain an
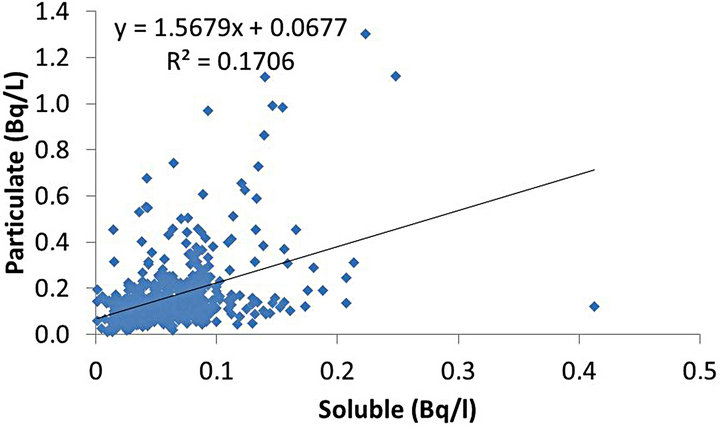
Figure 5. Pearson’s r2 correlation between soluble and particulate fractions.
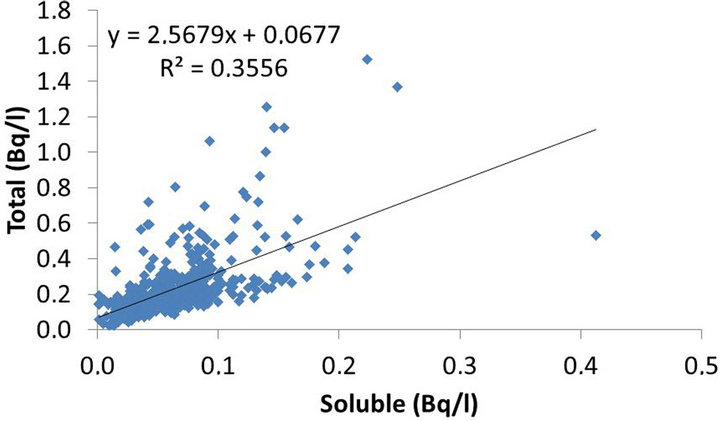
Figure 6. Pearson’s r2 correlation between soluble and total fractions.
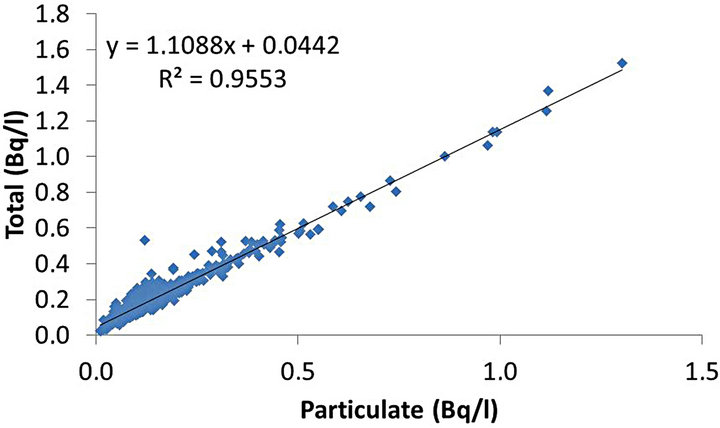
Figure 7. Pearson’s r2 correlation between particulate and total fractions.
activity around 0.26 Bq∙l−1 along the 11 years covered in this study; the equation of the trend line was: y = 9.10−7 × + 0.26, identifying a trend to neutrality with no growth and reduced concentrations of activity as demonstrated by its very small slope, but with a large variability around the mean concentrations of activity estimated, by linear regression of the data analyzed, as 0.26 Bq∙l−1 slightly different from the average established by descriptive statistics of 0.23 Bq∙l−1.
Evaluating the time series there are two periods of obvious additions, covering the period from January to September of 2005 and 2007, see Figure 3. In both cases the fraction responsible for the increase was the particulate fraction (see Figure 4).
The correlation between soluble and particulate fractions was not considered statistically significant (r2 = 0.17), as well as the correlation between the total and soluble fractions (r2 = 0.36). On the other hand, the correlation between the total fraction and the particulate fraction was considered statistically significant (r2 = 0.96). Thus, the particulate fraction was considered as the main responsible for variations in the total fraction.
Analysis of the particulate fraction before and after treatment showed that over 97% of it is composed of lime (calcium carbonate) which is added during the treatment of the mine tailings deposits to increase the pH of the acid drainage produced from c.a. 3 to c.a. 12. Along the residence time in settling tanks, alkaline pH favors co-precipitation of lime, heavy metals and radionuclides present in the effluent, resulting in considerable reduction of their amounts and in pH reduction to values between 7 and 8, thus allowing liberation of this effluent to the environment, in agreement with actual Brazilian standards (see Figure 2).
The rigorous control of the treatment process can contribute to reducing the release of particulates, increasing co-precipitation and reducing the release of particulate material, thereby reducing the release of radionuclide by the UTM.
REFERENCES
- H. M. Fernandes, L. H. S. Veiga, M. R. Franklin, V. C. S. Prado and J. F. Taddei, “Environmental Impact Assessment of Uranium Mining and Milling Facilities: A Study Case at the Poços de Caldas Uranium Mining and Milling Site, Brazil,” Journal of Geochemical Exploration, Vol. 52, No. 1-2, 1994, pp. 161-173. doi:10.1016/0375-6742(94)00043-B
- E. C. S. Amaral, “Modificação da Exposição à Radiação Natural Devido a Atividades Agrícolas e Industriais Numa Área de Radioatividade Natural Elevada No Brasil,” Ph.D. Thesis, Instituto de Biofísica, Universidade Federal do Rio de Janeiro, Rio de Janeiro, 1992, 130 p.
- E. C. S. Amaral, J. M. Godoy, E. R. R. Rochedo, L. M. H. Vasconcellos and M. A. Pires do Rio, “The Environmental Impact of the Uranium Industry: Is the Waste Rock a Significant Contributor,” Radiation Protection Dosimetry, Vol. 22, No. 3, 1988, pp. 165-171.
- E. C. S. Amaral, E. R. R. Rochedo, H. G. Paretzke and E. Penna Franca, “The Radiological Impact of the Agricultural Activities in an Area of High Natural Radioactivity,” Radiation Protection Dosimetry, Vol. 45, No. 1-4, 1993, pp. 289-292.
- H. L. P. Azevedo, E. C. S. Amaral and J. M. Godoy, “Evaluation of the 226Ra Transport by River Sediments Surrounding the Brazilian Uranium Mining and Milling Facilities,” Environmental Pollution, Vol. 51, No. 4, 1988, pp. 259-268. doi:10.1016/0269-7491(88)90166-2
- C. Barcellos, E. Amaral and E. Rochedo, “Radionuclide Transport by Poços de Caldas Plateau Rivers, Brazil,” Environmental Technology, Vol. 11, No. 6, 1990, pp. 533- 540.
- E. C. S. Amaral, H. L. P. Azevedo and A. H. Mendonça, “Pre-Operational Environment Survey at the Uranium Mine and Mill Site, Poços de Caldas, Minas Gerais, Brazil,” Science of the Total Environment, Vol. 42, No. 3, 1985, pp. 257-266. doi:10.1016/0048-9697(85)90061-0
- National Commission for Nuclear Energy—CNEN, Standard CNEN-Ne-3.01, “Diretrizes Básicas de Radioprote- ção,” 1988, 121 p.
- National Commission for Nuclear Energy—CNEN, Standard CNEN-Nn-3.01, “Diretrizes Básicas de Proteção Radiológica,” 2005, 34 p.
- H. M. Fernandes, M. R. Franklin, L. H. S. Veiga, P. Freitas and L. A. Gomiero, “Management of Uranium Mill Tailings: Geochemical Processes and Radiological Risk Assessment,” Journal of Environmental Radioactivity, Vol. 30, No. l, 1996, pp. 69-95. doi:10.1016/0265-931X(95)00032-6
- H. M. Fernandes, “Subsídios ao Descomissionamento da Primeira Indústria de Mineração e Beneficiamento de Urânio No Brasil. O caso do Complexo Mineiro Industrial de Poços de Caldas—Niterói,” Ph.D. Thesis, Departamento de Geoquímica da Universidade Federal Fluminense, Niterói, 1997, 250 p.
- S. B. Savvin, “Analytical Applications of Arsenazo III— II: Determination of Thorium, Uranium, Protactinium, Neptunium, Hafnium and Scandium,” Talanta, Vol. 11, No. 1, 1964, pp. 1-6. doi:10.1016/0039-9140(64)80003-5