Journal of Environmental Protection
Vol. 3 No. 12 (2012) , Article ID: 26022 , 15 pages DOI:10.4236/jep.2012.312184
Elements Content in Otolith as Pollution Indicator for Cultured Sea Bass (Lates calcarifer) of Malaysia
![]()
School of Environmental and Natural Resource Sciences, Faculty of Science and Technology, Universiti Kebangsaan Malaysia, Bangi, Malaysia.
Email: *carmohd@ukm.my
Received September 23rd, 2012; revised October 22nd, 2012; accepted November 21st, 2012
Keywords: Pollution; Otolith; Zn; Ba
ABSTRACT
Otoliths of cultured sea bass and ambient waters were sampled from 24 fish cages and ponds in Malaysia to investigate the contents of Sr, Mg, Ba, Cd and Zn. The following elements content in otolith and water were analysed with Inductively Coupled Plasma Mass Spectrometer (ICP-MS) and/or Atomic Absorption Spectrometer (AAS) to determine the anthropogenic impacts based on the grouping characterisation of the sampling locations. Three groups i.e. A, B and C were characterised according to the least, intermediate and high anthropogenic impact to otolith elemental content. The Enrichment Factor (EF) and Metal Pollution Index (MPI) were calculated to determine the pollution source and level. The content of Ba in otolith was found positively related with the salinity variation and Ba content in water. Elevated content of Zn in otolith and water was found in group A suggesting that oil leaking from tourist boating activities effects exceed the urbanisation and industrialisation impact. EFZn support the enrichment of Zn in waters which exceed the recommended level. MPI showed that group A > C > B and support that tourism activities affect the pollution level and indicate otolith functioned as pollution indicator. Highest EFCd suggested Cd incorporation onto otolith despite of the low content of Cd in water. The sequence of the elements content in otolith and water are Sr > Mg > Zn > Ba > Cd and Sr > Mg > Ba > Zn > Cd respectively.
1. Introduction
Coastal areas in Malaysia are often residential centres that have developed rapidly thus experiencing a sudden increase of urbanisation that contributes to increasing pollutants in the aquatic environment [1]. In Malaysia, the increased pollutant input to aquatic environments is basically derived from anthropogenic activities; mainly agro-based and manufacturing industries, animal husbandry and sewage [2]. The anthropogenic source of heavy metal pollutants such as Cd and Zn in coastal waters were found elevated in adjacent to the industrial estates and urban [3] and ports [4]. In conjunction with the increasing water pollution level in these areas, several studies have been conducted to indicate the coastal waters pollution in cultured and wild organism. Several organism such as green-lipped mussel, Perna viridis [5], blood cockle, Anadara granosa; shrimp, Penaeus merguiensis and catfish, Arius maculatus [6] have been used to as biomonitoring agent for heavy metals pollution in Malaysia. However, few studies have been done to indicate the trace metal content in the cultured or wild sea bass especially by elemental content of otoliths [7,8]. Lates calcarifer or commonly known as sea bass is a catadromous fish extensively cultured along the estuaryies and littoral zone of Malaysian coastal waters. Therefore, cultured sea bass have been exposed to the salinity variation and contaminants either from land-based or sea-based sources and influence the ambient water content in the sea bass rearing waters.
Otoliths are located in the cranium cavity near the fish brain and these aragonite structures of CaCO3 grow continuously throughout fish life time. The trace metal elements such as Sr, Mg, Ba were permanently incorporated onto otoliths through the substitution of Ca2+ into the chloride cell of gills in hyperosmotic fish [9] through the biomineralisation process. The biomineralisation process is affected by both physiological [10] and environmental variables such as salinity, temperature, diet and ambient elemental concentration [9]. The elemental content of otolith have been used to distinguish fish migration [11], fish stock discrimination [12] and to a lesser extent as an indicator for anthropogenic pollutants metal [7,13]. Leakey et al. (2009) [14] suggest that whole otolith elemental analysis can be used to discriminate the juvenile of sole (Solea solea), whiting (Merlangius merlangus) and European seabass (Dicentrarchus labrax) while Milton & Chenery (2001) [7] concluded that the uptake of waterborne Cu, Pb and Sr in sea bass otolith were minimal. Previous studies investigated Zn content in pink snapper (Pagrus auratus) correspond with the contaminated area and [15] suggest that otoliths of black bream (Acanthopagrus butcheri) can be an indicator of exposure to metal contamination [16]. Meanwhile, Li et al. (2011) [17] used thermoluminescence of carp otoliths as finger-print in freshwater pollution.
Given the potential of otoliths as a pollution indicator this study aims to investigate the effect of anthropogenic activities on cultured sea bass otoliths from the elemental content of ambient waters. Elements i.e. Sr, Mg, Ba, Cd and Zn content in otolith were used to ascertain pollution affect from the Sr, Mg, Ba, Cd and Zn contents in ambient waters by grouping the sampling locations based on the pollution level characterisation. Moreover, the relationship between these elements content in water with otolith were determined to reveal the environmental variables effect such as salinity onto otolith chemistry. Hence, the water quality of the sea bass rearing waters in Malaysia was also revealed.
2. Materials and Methods
2.1. Samples and Sampling Locations
Sea bass were collected at the various locations was to differentiate between confined cultured fish and wild free-swimming fish. The cultured fish are exposed to land-based human activities and this will impact to the levels of trace element in the otolith. Cultured sea bass were collected to investigate the terrestrial anthropogenic impact on otolith. A total of 122 sea bass were collected from 24 fish cages and ponds from locations all over Peninsular Malaysia and East Malaysia i.e. Sabah in freshwater, brackish water and seawater. (Figure 1, Table 1). Most of the sampling locations were close to residential areas near estuaries and the seashore. Fish were collected based on their availability and the estimated ages for the cultured fish samples ranged from 12 to 16 months old based on the rearing fish time and were killed immediately during collection.
The 24 sampling location were characterised into 3 groups based on the impact of anthropogenic activities such as human activities, development status, residential areas density and population of each location for the cultured sea bass. These anthropogenic activities channelled terrestrial run-off such as domestic waste and pollutants and also direct waste such as oil spills to the cultured fish rearing area and later referred to as pollution. Group A is characterised by low anthropogenic impact as these stations have low population density, less human activities and are in an area with limited development. This group is represented by 3 sampling locations i.e. St 2, St 3 and St 4 around Langkawi Island which is a tourism island with major activities such as agriculture, animal husbandry and fisheries [18]. Langkawi Island is an archipelago with geological limestone formation which makes the development infrastructure is limited and boats are one of the main transportation methods between islands. The location of St 2 and St 3 are approximately 5 km and 12 km respectively from the cement factory plant. While, St 4 located 6 km from the main island is a remote archipelago with low population density.
Group B characterised by average anthropogenic impact from a median population density of rural to suburban area with active agricultural activity. The agricultural activity in these sampling stations mostly came from palm oil plantation that channel agriculture and domestic waste to the water body of the sampling locations. Other activities involved in this group are mariculture and fisheries which makes these stations as the main passageway for the small boat.
Group C is characterised by high density population of urban area and/or includes influence from industrial and/or shipping activities in either local or nearby neighbouring countries e.g., Singapore. Some stations (i.e., St 13, St 14, St 15, St 16 and St 17) located in the Straits of Johor are influenced by Malaysia and Singapore’s terrestrial anthropogenic waste from industrial activity, shipping activity and domestic waste. The Straits of Johor also had been considered polluted as it receives uncontrollable discharge from coastal area which lead to eutrophication and is not suitable for drinking [19]. Other stations namely St 7, St 8, St 11 and St 24 are located in high density residential area and receive large volume of domestic waste input.
Five of wild sea bass fishes were obtained from five locations namely Setiu, Penggerang, Kota Kinabalu and Sandakan were used to distinguish the natural influence on sea bass compared to cultured sea bass (Table 2). Wild sea bass stock is limited in Malaysian waters; hence these fish were bought from local fishermen. The estimated age of the wild fish form 2 - 3 years based on the regular growth of wild sea bass [20]. Wild sea bass were caught during spawning at the littoral zone or mangrove area close with the place it was obtained. These fish inhabit natural environment and experience less influenc from anthropogenic impact. The collected fish were kept frozen for further analysis in the laboratory. The fish were then measured and weighed before otolith extraction as shown as Table 1.
2.2. Otolith Preparation and Analysis
The fish heads were cut horizontally parallel to the preopercle in order to expose the sagittal otoliths. The
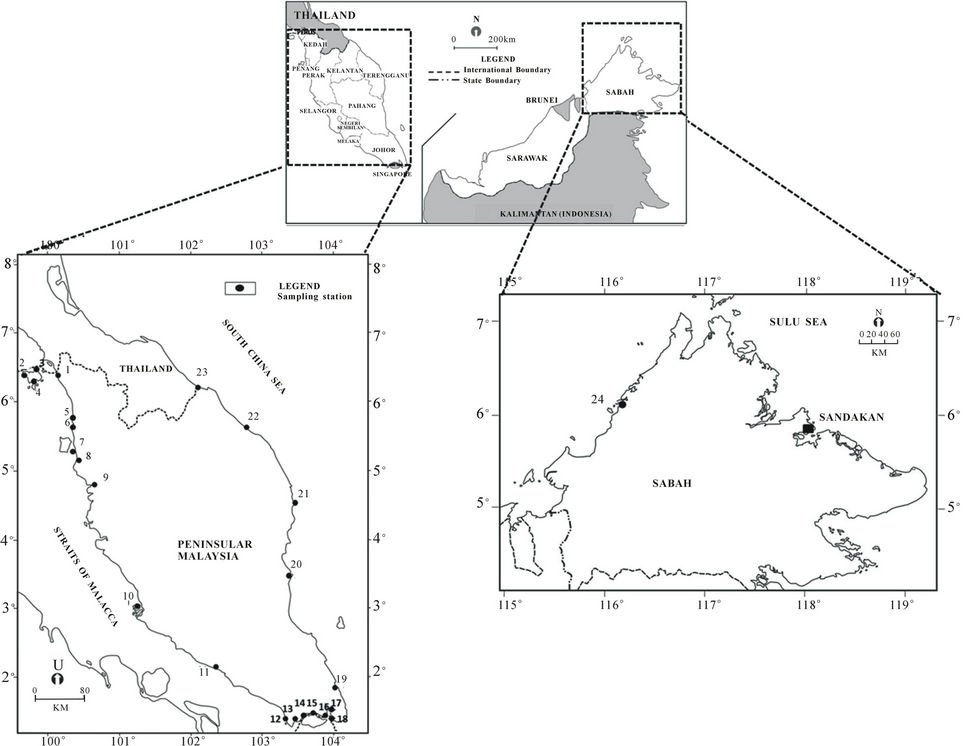
Figure 1. Sampling locations of cultured and wild sea bass in Malaysia.
otoliths were pluck out from the brain cavity using plastic forceps then, being cleaned with deionised water. After that, the otoliths were stored dry in glass vial and dried in room temperature. Afterwards, the otoliths were weighed on electronic balance with accuracy of 0.1 mg to obtain constant weight. Only right sagittal otoliths were used for elemental analysis as both right and left otolith were similar in weight, length and width (paired T-test, p > 0.05).
The otoliths were then dissolved in 10 mL of HNO3 and heat to dryness on a hotplate. Subsequently, 10 mL 0.5 N HNO3 were added before being analysed using Perkin Elmer 9000 Inductively Coupled Plasma Mass Spectrometer (ICP-MS) to determine Sr, Mg, Ba, Cd and Zn. Replicates of Certified Reference Material No. 22 (Otolith) were analysed using the same procedure as otolith samples to validate the analysis method. The recoveries value range 87% - 96% from the certified and reference values (Appendix 1).
2.3. Ambient Water Samples and Analysis
Ambient waters inhabit by the cultured sea bass were sampled to obtain background information of the environment such as salinity and trace elements content. The salinities of ambient waters were recorded using the calibrated YSI 30 salinometer at the time of the fish sample collection.
Surface water samples were collected using the 12 L of high-density polyethylene (HDPE) containers and acidified with the concentrated HNO3 to pH < 3. In the laboratory, the water samples were filtered using the 0.45 μm of WHATMAN membrane filter to remove the suspended solid. Three replicates of 250 mL of filtered water samples were used to extract the trace elements such as Mg, Ba and Cd using the metal complexation of ammonium pyrrolidinedithiocarbamate (APDC) and continuously extracted into the methyl isobutyl ketone (MIBK) method [21]. The extracted trace elements were diluted then detected. The Perkin Elmer AA800 Flame Atomic Absorption Spectrometer (AAS) was used to detect Mg and Cd while Graphite-Furnace Atomic Absorption Spectrometer (GF-AAS) was used to detect Ba. As for Sr and Zn, the water samples were diluted (1:10 v/v) and then detected directly with ICP-MS. All the
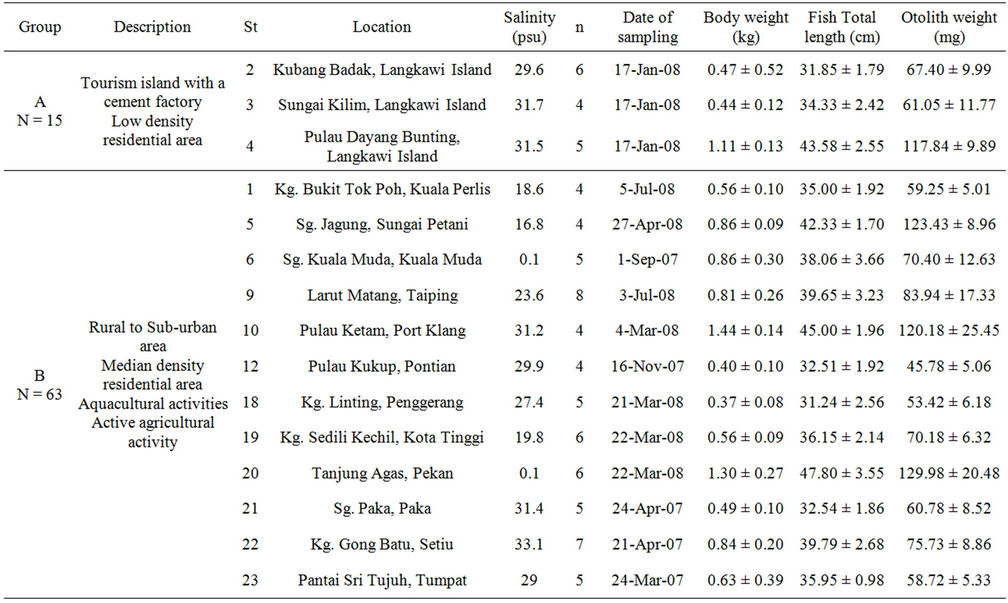
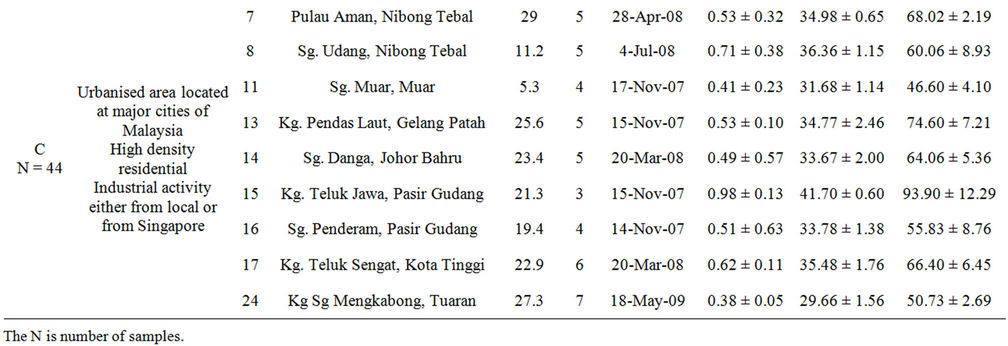
Table 1. Classification and description of sampling locations in fish cages and ponds with mean ± SD of body weight (kg), total length (cm) and otolith weight (g) of cultured sea bass.
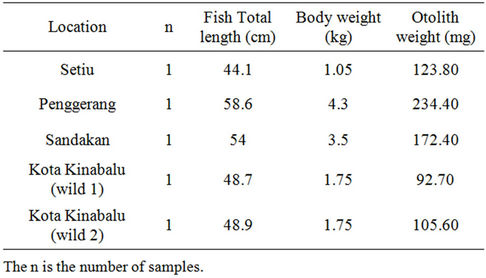
Table 2. Locations, total length (cm) and weight (kg) and otolith weight (mg) of wild sea bass obtained.
glassware being used were soaked in 5% (v/v) of HNO3 overnight prior to analysis.
2.4. Data Analysis
Significance differences between elements in otolith and water were tested with one-way MANOVA based on factors of salinity and groups of the sampling stations and both. Meanwhile, the Pearson bivariate correlation was used to determine the relationship between elements and salinity. Discriminant function analysis (DFA) was used to evaluate the group classification based on elements factors. All the data were not in normal distribution, thus the data was transformed before statistical computation using SPSS version 16.0.
Modification of Enrichment Factor (EF) was used to evaluate the dominant source of elements to otolith as indicators for pollution effects. EF is calculated using an Equation (1) where E is the concentration for the elements.
 (1).
(1).
An EF value less than 1.0 is considered to have ambient water origin while EF higher than 1.0 indicates anthropogenic influence in the sample. When the EF value is more than 10.0, it indicates anthropogenic impact onto otolith. In sea bass otolith, Sr substitution with Ca is dominant thus it became the most stable element content in most fish otolith [7,22-24]. The Sr act as reference elements which influenced by the origin of the otolith natural elements as a normalizer element.
The Metal Pollution Index (MPI) was used to differentiate the contaminant elements concentration in the bivalves [25,26]. In this study, MPI was used to indicate the level of pollution of the sampling locations based on elements content in otolith. However only Ba and Zn were used based on the significance present with pollution factor (MANOVA p < 0.05) where C is the concentration of element in the otolith.
 (2)
(2)
3. Results and Discussion
3.1. Element Contents in Otolith
Foreign elements existences such as Sr, Mg, Ba, Cd and Zn in otolith are not physiologically incorporated onto otolith [27]. It is widely reported that Sr and Ba content in otolith correlates with salinity [11] while heavy metal elements such as Cd and Zn distinguish as pollutants from industrialisation activities and urbanization sewage waste [28]. The presence of these element in ambient water as the dominant source of elements incorporation onto otolith reflects the environment inhabit by the fish [23]. The highest element content in otolith is Sr, followed by Mg, Zn, Ba and Cd (Table 3). The content of Sr ranged from 187.88 ± 20.19 µg∙g–1 to 2754.78 ± 773.59 µg∙g–1 with the lowest and highest recorded at St 6 and St 24 respectively. The content of Mg was below than 50 µg∙g–1 except for 3 stations which are St 2, 4 and 24. It ranged from 4.40 ± 0.55 µg∙g–1 to 111.11 ± 56.42 µg∙g–1 with the lowest and highest recorded at St 18 and St 24 respectively. Most of Ba content was lower than 6 µg∙g–1 and ranged from 4.40 ± 0.55 µg∙g–1 to 12.84 ± 0.22 µg∙g–1 with the lowest and highest at St 10 and St 6 respectively. The content of Zn was lower than 20 µg∙g–1 and ranged from 1.79 ± 0.38 µg∙g–1 to 78.31 ± 15.49 µg∙g–1 with the lowest and highest at St 6 and St 3 respectively. Meanwhile, Cd content was below detection limit in 13 stations and maximum at St 24 with the content of 12.89 ± 8.07 µg∙g–1.
Figure 2 shows the designation of the elements content based on the effect of salinity series and pollution in all sampling locations. The salinity series was based on Por (1972) [29] thallasic classification of oligohaline (0 - 5 psu), mesohaline (6 - 18 psu), polyhaline (19 - 29 psu) and euhaline (30 - 35 psu). Meanwhile, the pollution factor was based on the impact of anthropogenic activeties on sampling stations as described in Table 2. The content of Sr was found higher in group A and lower in low salinity stations—oligohaline. However, the stagnant distribution of Sr by salinity and pollution factors is insignificant (p > 0.05), but only significant with pollution (p = 0.001). The content of Sr was high in all groups but highest in the lowest human activity stations (group A). Group C showed a low content of Sr in oligohaline waters (Figure 2(a)).
Most of the elements showed the highest concentrations in otoliths from Group C samples except for Zn (group A), the lowest concentrations were recorded in group B (Table 3). The contents of Sr, Mg and Cd showed the highest concentrations at St 24 (group C) but Sr and Zn are the lowest in St 6 (group B). On the other hand, Ba content in otoliths shows a distinct inverse relationship with salinity especially in stations under group B even though there was no significant difference (p = 0.053). A clear trend of Ba content towards decreasing salinity was observed in Figure 2(c) with the highest Ba content in oligohaline waters and decreasing to the lowest content in euhaline waters. The content of Mg only shows a slight increasing trend with increasing salinity for group B (Figure 2(b)). The stations of polyhaline waters (18 - 29 psu) were the only salinity series consisting of high Mg content in all groups. Overall, Mg did not show a strong association with salinity and the combination of salinity and group of sampling stations (p > 0.05) with Mg were higher in group A than group C (Figure 2(b)).
The highest Cd and Zn contents in otoliths were recorded at polyhaline groups C and A respectively (Figures 2(d) and (e)). Hence, no exact trend was revealed for Cd as a significant difference (p > 0.05) was found for all factors (Figure 2(d)). However, Zn content in otoliths displayed decreasing trends with the lowest at euhaline stations for group C and A (Figure 2(e)). The content of Zn in group A was the highest followed by group B and C which were also significantly different by salinity and/or pollution factors (p = 0.000). However, all the elements content in the otoliths were significantly different in terms of salinity, pollution and both factors (p < 0.05) as shown in Table 4.
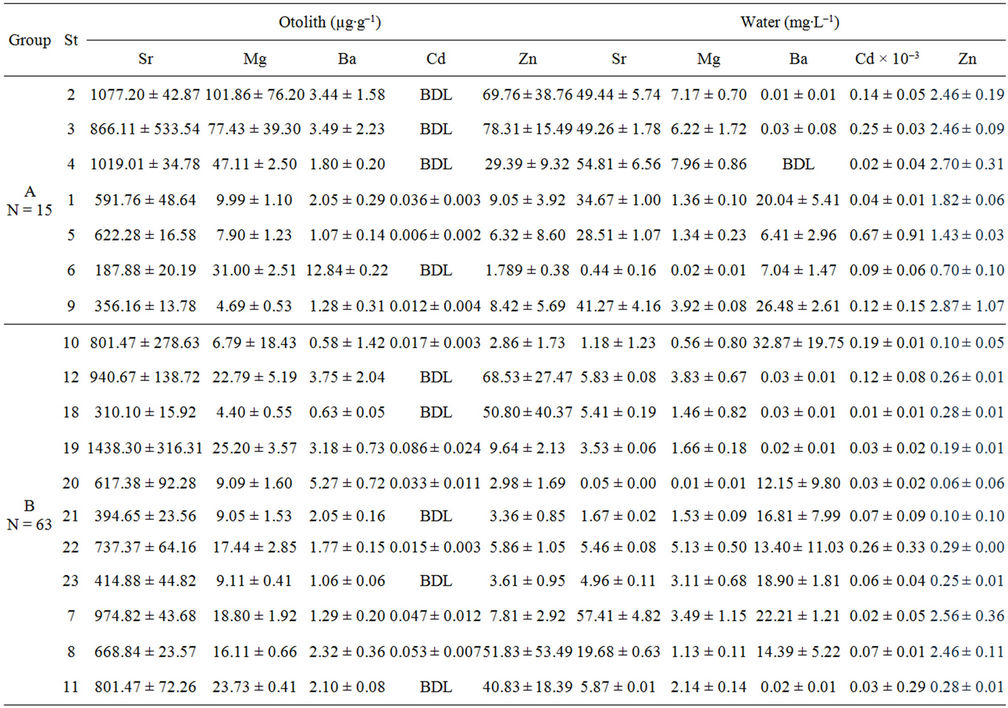
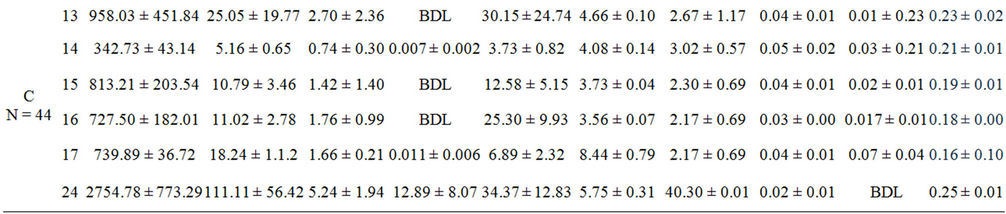
Table 3. Mean ± SD of each element in otoliths (µg∙g−1) and ambient water collected form the cages and ponds (mg∙L−1). BDL is below detection limit.
3.2. Element Contents in Water
In this study, water samples were referred to as baseline information for otolith incorporation by justification of salinity and element content in water. Thus, it indirectly shows the source of element uptake by otoliths besides water content. A few stations, namely St 7, St 11 and St 24 of group C, St 5 and St 9 of group B contained the highest Sr, Mg, Ba, Cd and Zn with concentrations of 57.41 ± 4.82 mg∙L–1, 40.30 ± 0.01 mg∙L–1, 0.02 ± 0.01 mg∙L–1, 0.67 ± 0.91 mg∙L–1 and 2.87 ± 1.07 mg∙L–1 respectively (Table 3). Meanwhile, St 20 showed the lowest content of Sr, Mg, and Zn with concentrations of 0.05 ± 0.00 mg∙L–1, 0.01 ± 0.01 mg∙L–1 and 0.06 ± 0.06 mg∙L–1 respectively. Only two stations, St 4 and St 24 were below the detection limit for Ba and Cd respectively.
It was also found that Cd levels in ambient waters of cultured sea bass in sampling locations was not polluted and were lower than the recommended level by the Malaysia Interim Marine Water Quality Standard (IMWQS). The water in the study area was classified as Class 1 having the quality of preservation, marine protected areas and marine park waters (lower than 0.0005 mg∙L–1) except for St 5. The Cd level in St 5 was classified as Class 2 having the quality of marine life, fisheries, coral reefs recreational and mariculture (lower than 0.003 mg∙L–1). Hence, the Cd levels of Malaysian coastal waters are safe and suitable for mariculture activity (Table 3).
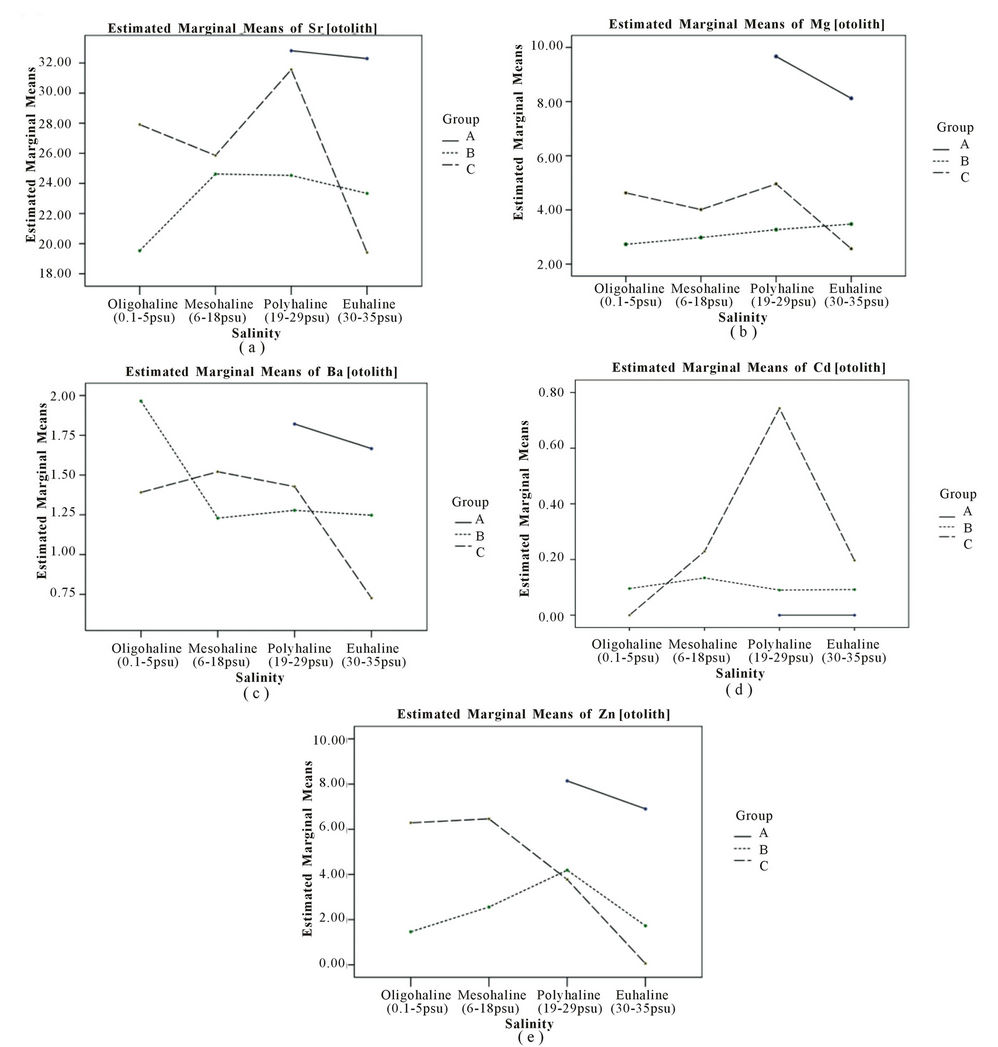
Figure 2. Distribution of Sr, Mg, Ba, Cd and Zn in otoliths following by salinity and classification.
In contrast with the safe level of Cd, the level of Zn is high in all locations and highest in group A (Figure 3(e)). The only safe Cd level in water is in St 20 which is below 0.05 mg∙L–1 in Class 2 & E. According to Ooi et al (2005) [30], water quality of St 3 was classified as Class 3 of IMWQS with the present of organic matter and oil leaching form the boat passing by and port at the jetty deteriorate this area (Table 3 thus, a major input of Zn in group A might be tourism activities as there is a high Zn content in the diesel fuel used in boats around Langkawi Island. Cassella et al. [31] found that Zn content in diesel is generally abundant. The fuel used in boating activities enters the water through direct disposal by the boatman or through leakage from the engine into the water [32]. The level of Zn varied from 3 times to more than 20 times higher than the recommended level of a mariculture area which is 0.05 mg∙L–1 with the exception of St 11 and St 21 (Table 3). It was revealed the level of Zn in sea bass cultured waters exceeds the recommended level of IMWQS but is still safe for drinking based on the
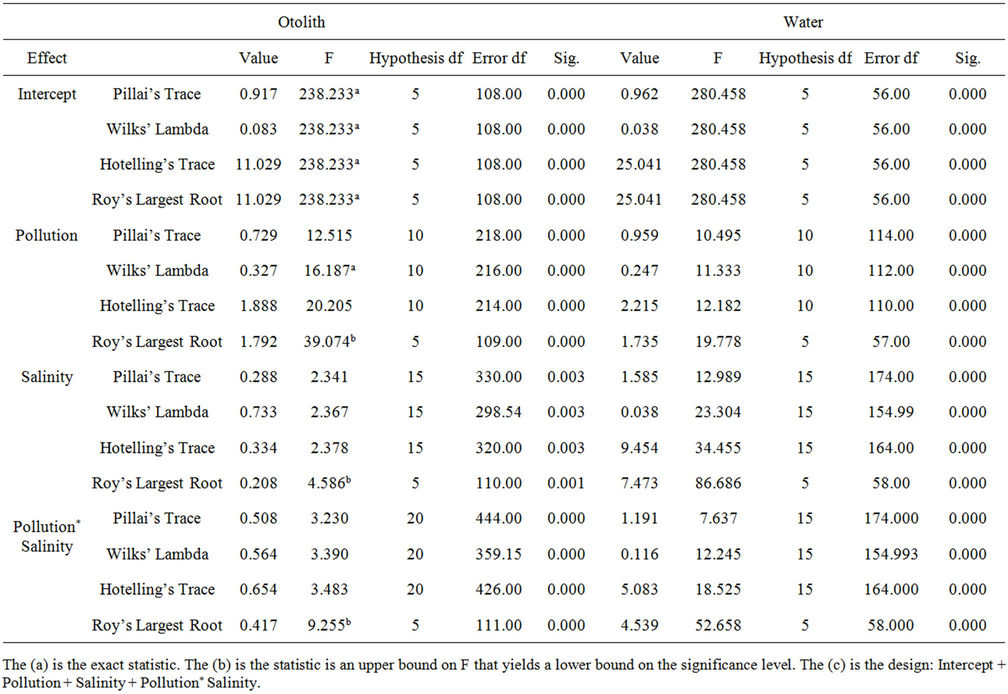
Table 4. One Way MANOVA analysis of cultured sea bass otoliths and ambient water collected at the sampling locations.
National Standard for Drinking Water Quality (lower than 3 mg∙L–1).
Figures 3(d) and 3(e) suggests that the existence of heavy metals i.e. Cd and Zn in water are pollutants in the ambient waters inhabited by the fish (Figures 3(d) and (e)). The content of Cd in water does not show any relationship with salinity. Both salinity and pollution have an influence but this element did show any clear trends with regards to pollution (Figure 3(d)). A higher content of Cd in group B and C support the evidence of pollution input into the study area. All the elements showed a rapid spike in group B and C and are significantly related to salinity (p < 0.05) as shown in Figure 3. The contents of Sr, Mg and Zn are highest at the stations in group A (Figures 3(a), (b) and (e)) while the highest content of Ba, Cd, and Zn was found in mesohaline waters (Figures 3(c)-(e)). Mesohaline stations (St 5 and St 8) showed a maximum increment of Sr, Ba, Cd and Zn levels and suggest that 16 - 18 psu is the optimal salinity for heavy metals in dissolved intermediate and high pollution waters. Both Mg and Ba showed clear trends with regards to salinity (Figures 3(b) and (c)) and the content of Mg increased with salinity (p = 0.000). The Mg trend is also more distinct than Sr, suggesting that Mg could be a tracer for salinity variation in water (Figure 3(b)). The content of Ba in water was scattered and was mostly higher in low salinity oligohaline and mesohaline waters. With regards to salinity and pollution, only Ba was significantly different (p = 0.049). Ba in group C was the highest, suggesting that Ba could act as a tracer for fresh water. The grouping of stations based on pollution factors is significant for all elements (p < 0.05). Ba showed distinct trends of a decrease with salinity in group B. Group C registered the highest level of Ba, suggesting terrestrial input into mesohaline waters (Figure 3(c)). Overall, all element con tents in ambient water were significantly different based on salinity, pollution and both factors as shown in Table 4 (p < 0.05).
3.3. The Relationship between Element Content in Otoliths and Ambient Water
Numerous studies proved that trace elements uptake onto otolith were from ambient water [7,22-34]. Foreign elements except Ca mainly from ambient water undergo complex pathways such as blood plasma and membrane
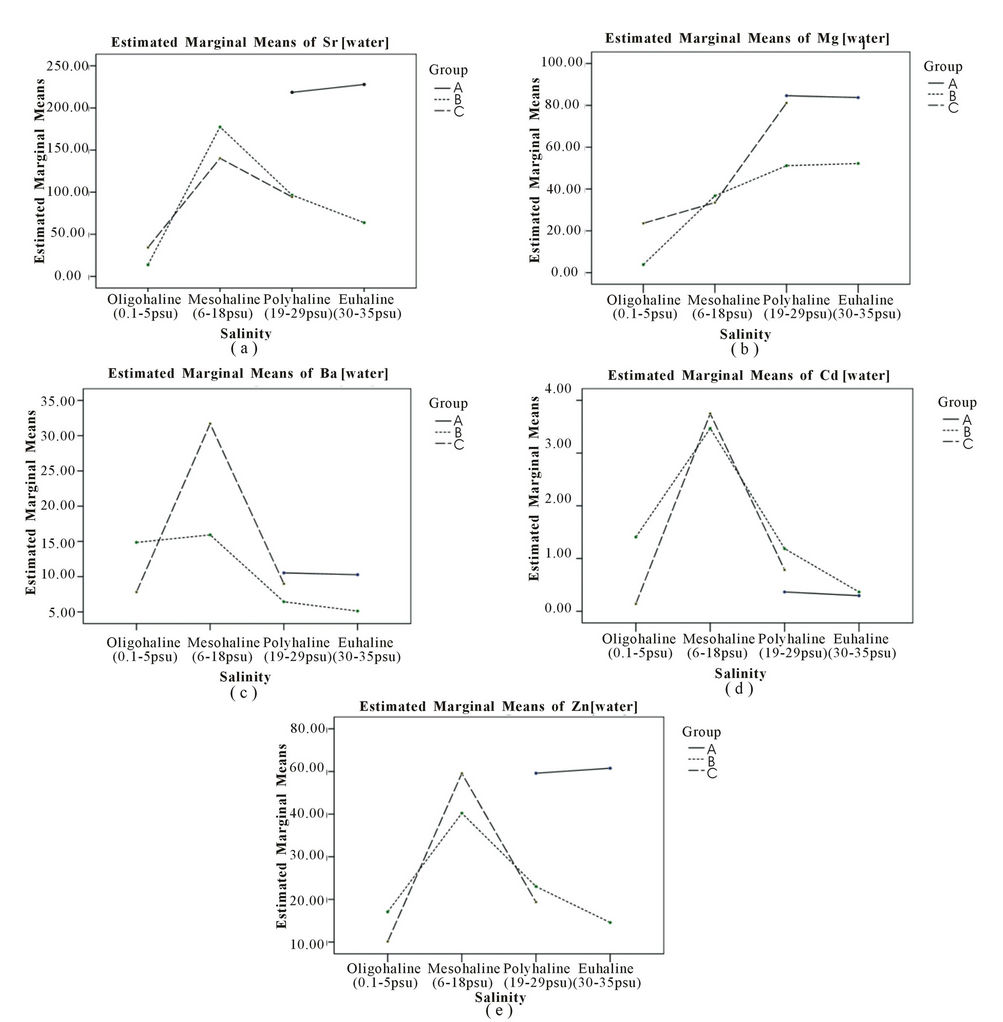
Figure 3. Distribution of Sr, Mg, Ba, Cd and Zn in water according by salinity and classification.
before incorporated onto otolith [27]. Kinetics of ion transport from water to the precipitating surface and mechanism function by which of the trace elements determine the incorporation of elements into otolith [27]. Figure 4(a) showed that Sr have stagnant trend in otolith and but still correlate with Sr level in water. The content of Mg and Ba in otoliths is related to salinity. At the same time, Zn and Cd content in otoliths are related to pollution from terrestrial areas near the sampling locations (Figure 4). However, the inversely significant relationship (r = –0.49, p = 0.01) between Ba in otoliths and salinity proved that the Ba source is freshwater. The elevated content of Mg in saline waters was found to strongly correlate to Mg content in sea bass cultures (r = 0.673, p = 0.000) and saline waters (r = 0.557, p = 0.005) as shown in Figures 2(b), 3(b) and 4(b). In addition, Ba shows a distinct correlation with freshwater discharge into the ambient water of sampling locations (Figure 4(c)). However, enrichment of Ba in otoliths is suspected to have come from terrestrial inputs and natural sources such as limestone or the earth crust ran than from industrial emissions from spatial output [34]. Previous studies
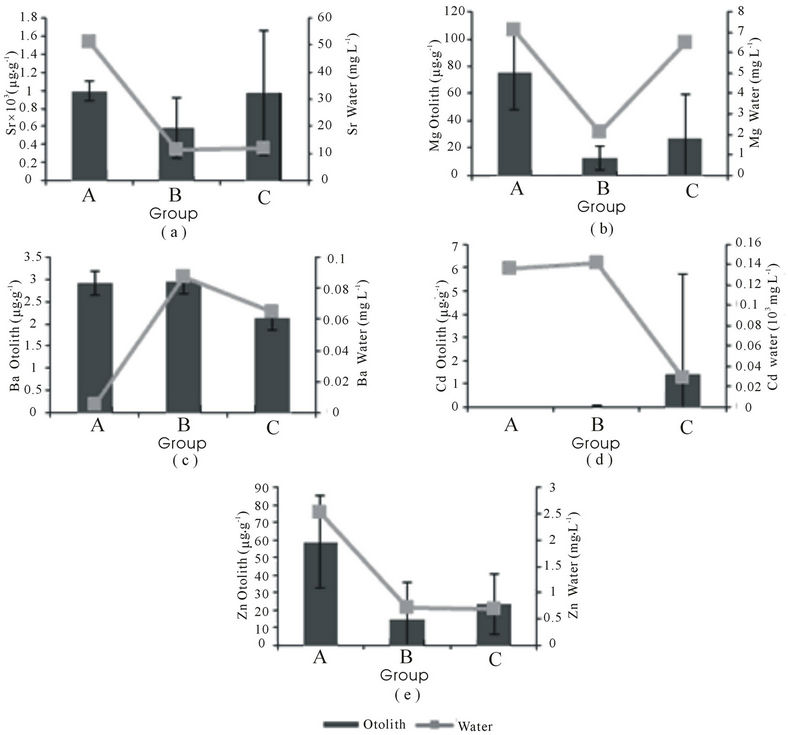
Figure 4. Patterns of relationship between elements in water and otoliths in Malaysia (mean ± SD).
recorded that the Ba content in soil at the limestone formation in St 3 ranged from 121.6 to 292.6 µg∙g–1 [35]. Similar to otoliths, limestone is an aragonite carbonate structure that is capable of binding with Sr, Mg, Ba and Zn in the form of dolomite minerals. There is a great abundance of these minerals in limestone [36]. This suggests that the leaching of Ba from the limestone formation has a causal relationship with the otoliths in group A due to the declining Ba content in water (Figure 4(c)).
No exact relationship can be defined from Figure 4(d) as the high content of Cd in water is not actively incorporated onto the otoliths. It was found that Cd levels in water did not have a significant relationship with pollution, salinity or both in sea bass otoliths (Figures 2(d), 3(d), Table 4). This is similar to the results of work by Milton & Chenery [7] The incorporation of Cd onto otoliths is not consistent, but it might be useful to trace the existence of Cd in water inhabited by fish. A high content of Zn in water and otoliths revealed that Zn derived from the water enters the body and is thus incorporated into otoliths (Figure 4(e)). The anthropogenic activities affected the content of Zn at all sampling stations especially at group A. In other aragonitic structures, a high content of Zn was recorded in corals at St 3 and St 4, supporting the enrichment of Zn in the water column at St 2, St 3 and St 4 [37]. The content of the coastal sediment nearby recorded Zn levels of as high as 28 µg∙g–1 [38]]. Even though residential area impacts are low in group A, human activities affect Zn content in both otoliths and water (Figures 2(e), 3(e), Table 3). Other elements are also present in high concentrations in Langkawi Island. Besides boat transportation within the island archipelago leading to oil leakage in the water, the cement factory and minerals such as sphelarite, hematite and smithsonite leaching from limestone might also contribute to increased levels of Zn [39]. This is supported by the results of Zn analysis from limestone soil at St 3; it was recorded to be as high as 186.33 µg∙g–1 [35]. All of these anthropogenic activities and the natural environment might also contribute to the high Zn content in water, otoliths and also in green-lipped mussels (Perna viridis) in Langkawi Island [25] However, the effect of anthropogenic activities is suspected to be the dominant cause.
3.4. Otoliths as Pollution Indicators Using EF and MPI
The elemental signatures in wild otoliths act as a baseline to estimate pollution in the study areas. Otoliths of cultured and wild sea bass were compared to assess the content of elements incorporated onto otoliths in natural with unnatural environments. This comparison might provide useful in determining natural elemental signatures as wild sea bass travel from rivers towards the sea and migrate between these water bodies [20]. Meanwhile, cultured fish are only exposed to the environment in which they are cultured and are thus affected by terrestrial input from riverine and/or sea-based activities.
Figure 5 shows that the contents of Sr, Mg and Ba were related to the conditions of water column as shows by wild sea bass otoliths. The content of Sr, Mg, Ba and Cd in St 22 show a low content of these elements rather than wild otolith (Figure 5) suggesting that less effect of Cd into the fish otoliths. Other stations such St 18 also show similar trends with St 22 except for Zn. The content of Zn in cultured fish otoliths was five times higher than in wild fish. Meanwhile, St 24, located in the west coast of Sabah, Kota Kinabalu shows a higher content of Cd in cultured fish than in wild fish. With reference to Figure 5, Wild 1 shows a higher content than cultured fish and Wild 2 (Figure 5). Sandakan wild sea bass otoliths had a high content of Ba suggesting that this fish experienced freshwater longer than saline water during its life span (Figure 5(c)). Cultured fish containing higher Zn content than wild fish suggests that Zn enrichment from anthropogenic and natural variables in cultured waters affects otolith chemistry. This comparison supports the proposition that fish cages and ponds in group B and C are still suitable for mariculture activities despite the high content of Zn revealed.
Several studies have been reported the use of otolith as a pollution indicator [7,15,40]. In this study, pollution was shown using EF and MPI. EFMg value was lower than 1, indicating that Mg content in otoliths was from natural sources as shown in Figure 6(a). EFBa and EFZn values were greater than 1 showing that there were slight anthropogenic influenced on otoliths (Figures 6(b) and 6(d)). EFCd was the highest, recording more than 10, indicating that anthropogenic impacts have an effect on otolith content even though Cd content in otoliths and water were low.
It was found that EFZn, EFBa and EFMg were the highest in group A thus indicating that tourism activities in Langkawi Island have an effect on water quality, thus affecting the otoliths of cultured fish (Figures 6(a), 6(b) and 6(d)). This supports the proposition that pollutants derived from boat traffic and tourism activity probably affects the Zn content in otoliths more than water. It also suggests that group C stations’ contaminants are derived
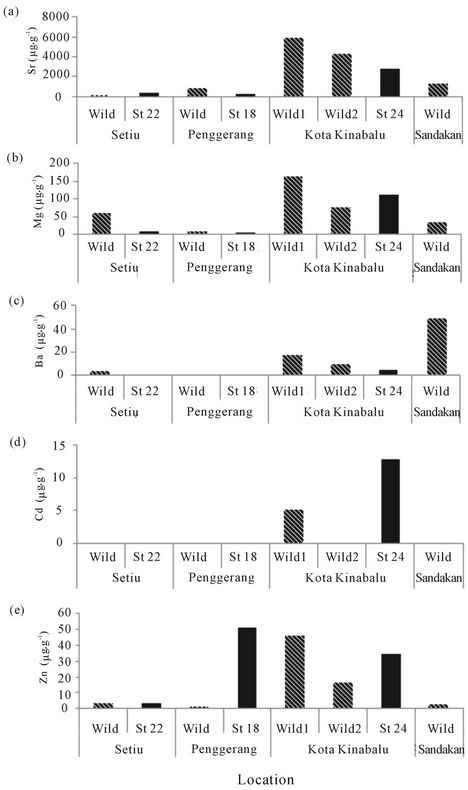
Figure 5. A comparison of the mean of element contents between cultured fish and wild fish obtained in each wild fish sampling location.
from industrialisation and shipping waste as the trend of EF in the study area was EFCd > EFBa > EFZn > EFMg.
Metal pollution index (MPI) values were evaluated for elements derived from anthropogenic activities only, such as Ba, Cd and Zn. However, Cd content in otoliths was below the detection level in most stations and thus too low to be quantified by MPI. On the other hand, Mg and Sr content were mainly derived from non-anthropogenic input such as salinity. A high MPI in group A and C suggest enrichment of Ba and Zn in these sampling stations (Figure 7). MPI also showed that pollution in group A exceeds Group C and Group B despite the anthropogenic activities. It also showed a similar trend in EF and supports the proposition that the pollution in areas of minimum anthropogenic activity was greater than sub-urban and industrialised areas. Nevertheless, Zn content in water and otoliths should be studied further in order to guarantee the safety of consumption of sea bass from the group A stations.
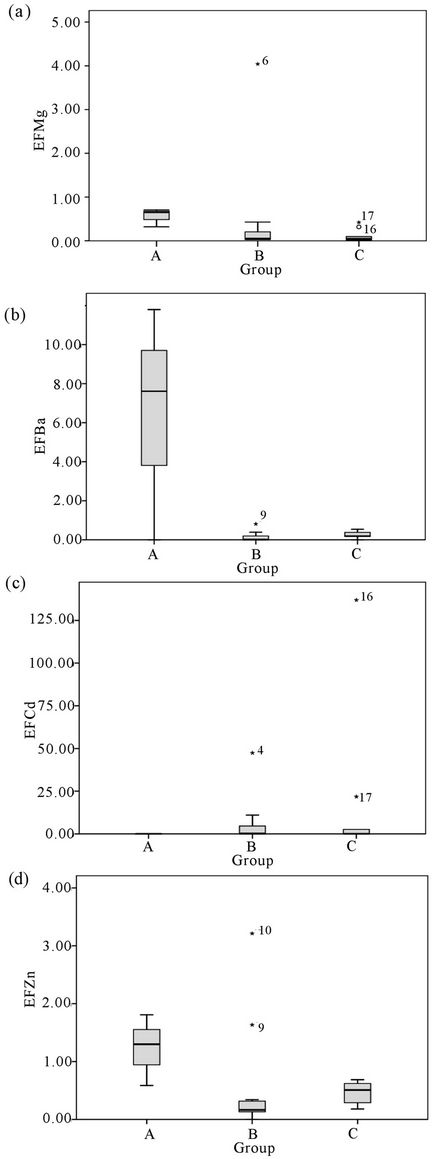
Figure 6. Enrichment factor (EF) of Mg, Ba, Cd and Zn of otoliths in Malaysia (mean ± SE).
Discriminant function analysis (DFA) was used to classify the suitability of the group of sampling locations. DFA classified 100% for group A, 71% for group B and 68.9% for group C (Figure 8). The most easily distin guishable group is Group A thus supporting the elevated
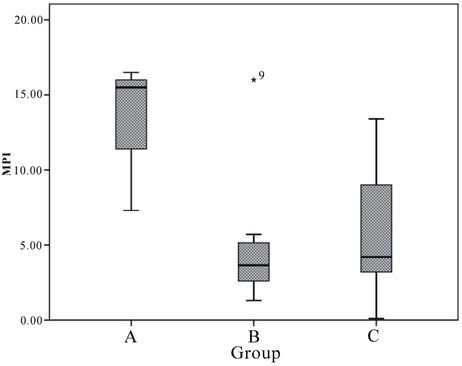
Figure 7. Marine pollution index (MPI) of Ba and Zn in cultured sea bass otoliths (mean ± SE).
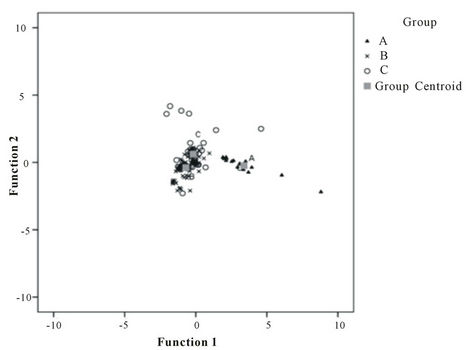
Figure 8. Canonical relationship between otoliths and the sampling location grouping.
contents of the elements. The significant difference of the elements grouped by anthropogenic impacts (p = 0.000) was based on 73.8% of the original group cases being correctly classified by region of sample collection (Figure 8). The grouping of the sampling locations based on anthropogenic activities and population of the sampling area was considered acceptable and can be used for future research. The elemental effects of each group were dependent mostly upon Mg, Zn and Ba, followed by Sr and Cd.
4. Conclusion
This study revealed that Ba content in otoliths can act as a tracer of salinity variation between freshwater and saline water inhabited by the fish. However, the influence of salinity on otoliths is considered a natural impact and therefore does not reflect anthropogenic-source pollution inputs. On the other hand, Sr content in otoliths was insignificant at all stations and was found to be unsuitable as a salinity marker. Heavy metal elements such as Cd and Zn that existed in the otoliths were from anthropogenic sources such as industrialisation and urban waste from around the sampling stations. The value of EF and MPI was used to ascertain pollution levels by using otoliths as an indicator but MPI had a greater effect than EF in Zn content specification. In line with these findings, urbanisation and industrialisation does not seem to have a greater influence on pollution levels than tourism activity, especially when compared to boating activities within the Langkawi Island archipelago. Thus, otoliths are able to indicate that Zn pollution in the study area is influenced by anthropogenic activities. The overall content of the elements in otoliths and water were Sr > Mg > Zn > Ba > Cd and Sr > Ba > Mg > Zn > Cd respectively.
5. Acknowledgements
The authors would like express highest gratitude to National Oceanography Directorate for the grant NOD/ R&D/02/01, Ministry of Science, Technology and Innovation, Malaysia (MOSTI) for the scholarship and UKM for the facilities. The heartiest appreciation also goes to all the fish culturist and Department of Fisheries (DOF), EKOMAR, lab assistant, lab members of LAOI for the help during sampling and laboratory works
REFERENCES
- S. G. Tan and C. K. Yap, “Biochemical and Molecular Indicators in Aquatic Ecosystems: Current Status and Further Applications in Malaysia,” Aquatic Ecosystem Health & Management, Vol. 9, No. 2, 2006, pp. 227-236. doi:10.1080/14634980600713620
- A. B. Jaafar, “Wastewater Management in Malaysia,” ICLARM Conference Proceedings 33, Phillippines, Ministry of the Environment, and Canada-ASEAN Centre, Singapox; Asian Development Bank, and International Center for Living Aquatic Resources Management, Philippines, 1992.
- A. Ismail and M. I. N. Asmah, “Copper, Zinc, Lead and Cadmium in Intertidal Molluscs and Sediment off Seberang Perai Coastline, Malaysia,” 4th Princess Chulabhorn International Science Congress, Bangkok, 1999.
- A. Ismail, B. A. G. Idris and R. Sukal, “Distribution of Heavy Metals in Sedminet of Port Kelang,” Proceedings of 12th Anniversary Seminar Malaysian Society of Marine Sciences, Universiti Malaya, Kuala Lumpur, 1989.
- C. K. Yap, A. Ismail and S. G. Tan, “Heavy Metal (Cd, Cu, Pb and Zn) Concentrations in the Green-Lipped Mussel Perna viridis (Linnaeus) Collected from Some Wild and Aquacultural Sites in the West Coast of Peninsular Malaysia,” Food Chemistry, Vol. 84, No. 4, 2004, pp. 569-575. doi:10.1016/S0308-8146(03)00280-2
- L. Alam, “Radioecology of Polonium-210 and Content of Heavy Metals in Kapar Coastal Area and Risk Assesment of Seafood Consumption,” University Kebangsaan Malaysia, Bangi, 2012.
- D. A. Milton and S. R. Chenery, “Sources and Uptake of Trace Metals in Otoliths of Juvenile Barramundi (Lates calcarifer),” Journal of Experimental Marine Biology and Ecology, Vol. 264, No. 1, 2001, pp. 47-65. doi:10.1016/S0022-0981(01)00301-X
- D. Milton, I. Halliday, M. Sellin, R. Marsh, J. StauntonSmith and J. Woodhead, “The Effect of Habitat and Environmental History on Otolith Chemistry of Barramundi Lates calcarifer in Estuarine Populations of a Regulated Tropical River,” Estuarine, Coastal and Shelf Science, Vol. 78, No. 2, 2008, pp. 301-315. doi:10.1016/j.ecss.2007.12.009
- S. E. Campana, “Chemistry and Compositions of Fish Otoliths: Pathways, Mechanism and Applications,” Marine Ecology Progress Series, Vol. 188, 1999, pp. 263- 297. doi:10.3354/meps188263
- G. R. Hoff and L. A. Fuiman, “Environmentally Induced Variation in Elemental Composition of Red Drum Sciaenops ocellatus Otoliths,” Bulletin of Marine Science, Vol. 56, No. 2, 1995, pp. 578-591.
- A. S. Hicks, G. P. Closs and S. E. Swearer, “Otolith Microchemistry of Two Amphidromous Galaxiids across an Experimental Salinity Gradient: A Multi-Element Approach for Tracking Diadromous Migrations,” Journal of Experimental Marine Biology and Ecology, Vol. 394, No. 1-2, 2010, pp. 86-97. doi:10.1016/j.jembe.2010.07.018
- L. Castello and J. P. Castello, “Anchovy Stocks (Engraulis Anchoita) and Larval Growth in the Sw Atlantic,” Fisheries Research, Vol. 59, No. 3, 2003, pp. 409-421. doi:10.1016/S0165-7836(02)00014-0
- T. S. Elsdon and B. M. Gillanders, “Fish Otolith Chemistry Influenced by Exposure to Multiple Environmental Variables,” Journal of Experimental Marine Biology and Ecology, Vol. 313, No. 2, 2004, pp. 269-284. doi:10.1016/j.jembe.2004.08.010
- C. D. B. Leakey, M. J. Attrill and M. F. Fitzsimons, “Multi-Element Otolith Chemistry of Juvenile Sole (Solea solea), Whiting (Merlangius merlangus) and European Seabass (Dicentrarchus labrax) in the Thames Estuary and Adjacent Coastal Regions,” Journal of Sea Research, Vol. 61, No. 4, 2009, pp. 268-274. doi:10.1016/j.seares.2008.12.002
- M. M. Ranaldi and M. M. Gagnon, “Zinc Incorporation in the Otoliths of Juvenile Pink Snapper (Pagrus Auratus Forster, The Influence of Dietary versus Waterborne Sources,” Journal of Experimental Marine Biology and Ecology, Vol. 360, No. 1, 2008, pp. 56-62. doi:10.1016/j.jembe.2008.03.013
- M. M. Ranaldi and M. M. Gagnon, “Trace Metal Incorporation in Otoliths of Black Bream (Acanthopagrus butcheri Munro), an Indicator of Exposure to Metal Contamination,” Water Air and Soil Pollution, Vol. 194, No. 1-4, 2008, pp. 31-43. doi:10.1007/s11270-008-9696-x
- S. R. Li, et al., “The Thermoluminescence of Carp Otoliths: A Fingerprint in Identification of Lake Pollution,” African Journal of Biotechnology, Vol. 10, No. 80, 2011, pp. 18440-18449. doi:10.5897/AJB11.2559
- A. R. Anwar and N. R. N. Husni, “Perancangan Pembangunan Sosio-Ekonomi Dan Perlancongan Untuk Kawasan Sekitar Kilim, Langkawi,” In: M. S. Leman, et al., Eds., Lembangan Kilim—Warisan Budaya Dan Sumber Asli Langkawi, Institut Alam Sekitar dan Pembangunan (LESTARI), 2005, pp. 3-11.
- H. L. Koh, “Permodelan Alam Sekitar Dan Ekosistem,” Universiti Sains Malaysia, Bangi, 2004.
- D. L. Grey, “An Overview of Lates calcarifer in Australia and Asia in Management of Wild and Cultured Sea Bass Barramundi (Lates calcarifer),” CIAR Proceedings, Vol. 20, 1987, pp. 24-30.
- T. K. Jan and D. R. Young, “Determination of Microgram Amounts of Some Transition Metals in Sea Water by Methyl Isobuthyl Ketone-Nitric Acid Successive Extraction and Flameless Atomic Absorption Spectrophotometry,” Analytical Chemistry, Vol. 50, No. 9, 1978, pp. 1250- 1253. doi:10.1021/ac50031a014
- J. Farrell and S. E. Campana, “Regulation of Calcium and Strontium Deposition on the Otoliths of Juvenile Tilapia, Oreochromis Niloticus,” Comparative Biochemistry and Physiology Part A: Physiology, Vol. 115, No. 2, 1996, pp. 103-109. doi:10.1016/0300-9629(96)00015-1
- B. D. Walther and S. R. Thorrold, “Water, Not Food, Contributes the Majority of Strontium and Barium Deposited in the Otoliths of a Marine Fish,” Marine Ecology Progress Series, Vol. 311, 2006, pp. 125-130. doi:10.3354/meps311125
- M. J. Chowdhury and R. Blust, “Bioavailability of Waterborne Strontium to the Common Carp, Cyprinus Carpio, in Complexing Environments,” Aquatic Toxicology, Vol. 58, No. 3-4, 2002, pp. 215-227. doi:10.1016/S0166-445X(01)00230-2
- C. K. Yap, A. Ismail and S. G. Tan, “Background Concentrations of Cd, Cu, Pb and Zn in the Green-Lipped Mussel Perna Viridis (Linnaeus) from Peninsular Malaysia,” Marine Pollution Bulletin, Vol. 46, No. 8, 2003, pp. 1044-1048. doi:10.1016/S0025-326X(03)00163-2
- L. Giusti, A. C. Williamson and A. Mistry, “Biologically Available Trace Metals in Mytilus Edulis from the Coast of Northeast England,” Environment International, Vol. 25, No. 8, 1999, pp. 969-981. doi:10.1016/S0160-4120(99)00066-5
- G. E. Bath, et al., “Strontium and Barium Uptake in Aragonitic Otoliths of Marine Fish,” Geochimica et Cosmochimica Acta, Vol. 64, No. 10, 2000, pp. 1705-1714. doi:10.1016/S0016-7037(99)00419-6
- B. J. Alloway and D. C. Ayres, “Chemical Principles of Environmental Pollution,” Water, Air, & Soil Pollution, Vol. 102, No. 1, 1998, pp. 216-218. doi:10.1023/A:1004986209096
- F. D. Por, “Hydrobiological Notes on the High-Salinity Waters of the Sinai Peninsula,” Marine Biology, Vol. 14, No. 2, 1972, pp. 111-119. doi:10.1007/BF00373210
- S. T. Ooi, M. Mokhtar and I. Komoo, “Kualiti Air Sungai Kilim, Langkawi: Kajian Kes Bagi Pengurusan Bersepadu Sumber Air,” In: M. S. Leman, et al., Eds., Lembangan Kilim (Warisan Budaya Dan Sumber Asli), Institut Alam Sekitar dan Pembangunan (LESTARI), 2005, pp. 221-232.
- R. J. Cassella, et al., “Multivariate Optimization of the Determination of Zinc in Diesel Oil Employing a Novel Extraction Strategy Based on Emulsion Breaking,” Analytica Chimica Acta, Vol. 690, No. 1, 2011, pp. 79-85. doi:10.1016/j.aca.2011.01.059
- O. Mustaffa and Y. Ishak, “Kedinamikan Penduduk Dan Pembangunan Ekonomi Di Lembangan Kilim: Cabarannya Terhadap Kelestarian Alam Sekitar,” In: M. S. Leman, et al., Eds., Lembangan Kilim (Warisan Budaya Dan Sumber Asli), Institut Alam Sekitar dan Pembangunan (LESTARI), 2005, pp. 33-52.
- S. E. Campana, et al., “Otolith Elemental Fingerprints as Biological Tracers of Fish Stocks,” Fisheries Research, Vol. 46, No. 1-3, 2000, pp. 343-357. doi:10.1016/S0165-7836(00)00158-2
- H. Choudhury and R. Cary, “Concise International Chemical Assessment Document 33: Barium and Barium Compounds,” Geneva, 2001.
- S. A. Rahim, et al., “Geochemical Composition of Soils Developed from Different Parent Materials in Pulau Langkawi,” In: A. Norhayati, et al., Eds., Selat Kuah— Warisan Budaya Dan Sumber Asli Langkawi, Jabatan Perhutanan Malaysia, Institut Alam Sekitar dan Pembangunan (LESTARI), Lembaga Pembangunan Langkawi (LADA), 2007, pp. 220-226.
- A. Ghaemi, M. Torab-Mostaedi and M. Ghannadi-Maragheh, “Characterizations of Strontium(Ii) and Barium(Ii) Adsorption from Aqueous Solutions Using Dolomite Powder,” Journal of Hazardous Materials, Vol. 190, No. 1-3, 2011, pp. 916-921. doi:10.1016/j.jhazmat.2011.04.006
- J. N. Lee and C. A. R. Mohamed, “Trace Metal Contents in the Porites Corals of Peninsular Malaysia,” International Journal of Environmental Research, Vol. 3, No. 1, 2009, pp. 85-94.
- W. M. R. Idris, et al., “Kandungan Logam Berat Di Dalam Sedimen Pantai Di Sekitar Pulau Langkawi,” In: A. Norhayati, et al., Eds., Selat Kuah—Warisan Budaya Dan Sumber Asli Langkawi, Jabatan Perhutanan Malaysia, Institut Alam Sekitar dan Pembangunan (LESTARI), Lembaga Pembangunan Langkawi (LADA), 2007, pp. 227- 234.
- J. Krobthong, M. Rachakornkij and V. Sricharoenchaikul, “Distributions of Cr, Ni, Cu and Zn in Hazardous Waste Co-Processing in a Pilot-Scale Rotary Cement Kiln,” Journal of Applied Sciences, Vol. 12, No. 1, 2012, pp. 22- 31. doi:10.3923/jas.2012.22.31
- M. M. Ranaldi and M. M. Gagnon, “Trace Metal Incorporation in Otoliths of Pink Snapper (Pagrus auratus) as an Environmental Monitor,” Comparative Biochemistry and Physiology Part C: Toxicology & Pharmacology, Vol. 152, No. 3, 2010, pp. 248-255. doi:10.1016/j.cbpc.2010.04.012
Appendix
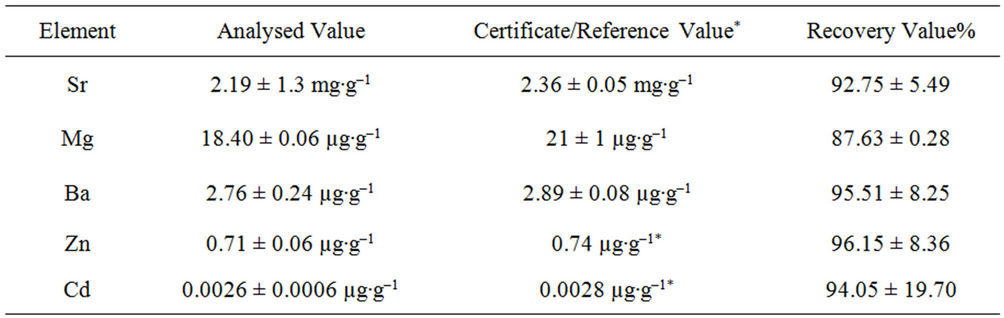
The analyzed value of triplicates of CRM No. 22 and the recovery (%) based on certificate and reference values.
NOTES
*Corresponding author.