Journal of Environmental Protection
Vol. 3 No. 9A (2012) , Article ID: 22964 , 9 pages DOI:10.4236/jep.2012.329135
Impact of the Transboundary Transport of Air Pollutants on Air Quality in Spain
![]()
Centro de Investigaciones Energéticas, Medioambientales y Teconológicas (CIEMAT), Air Pollution Unit, Madrid, Spain.
Email: m.garcia@ciemat.es
Received June 11th, 2012; revised July 8th, 2012; accepted August 4th, 2012
Keywords: Transboundary transport; air pollution
ABSTRACT
Although compliance with the European limit values for air pollutants has been achieved over large parts in Spain, some challenges remain for O3 on the maximum daily 8-hour mean and information limit values, for particulate matter on the PM10 annual and daily limit values and for NO2 on annual and hourly limit values. Transboundary transport of air pollutants has started to be recognized as a mechanism affecting air quality. Nevertheless, as a consequence of the complexity of atmospheric chemistry it is not easy to determine the importance of this effect. Photochemical models constitute an adequate tool to address this challenge, allowing the identification of pollutant pathways and the quantification of the influence of long-range transport of air pollutants. In this paper we evaluate the influence of out-of-Spain emissions on this non-compliance picture by using the CHIMERE photochemical model. For this purpose the model was run at a 0.2˚-horizontal resolution for a European domain. Although at this resolution not all the local effects can be captured, transboundary transport of air pollutants can be examined. Several simulations were performed considering different emission scenarios. To see all out-of-Spain emissions influence, all the emissions were set to zero, excepting those in Spain. This includes examining European and ships effects on air quality in Spain. A second simulation was performed setting to zero just European-countries emissions, to see the effect of Europe. The third and fourth simulations were carried out by setting to zero France and Portugal emissions respectively. Ozone has been found to be the pollutant more affected by this transboundary transport, in particular in the summer period. The model indicates that the incoming air masses contributed in 2009 to the non-compliance with the European normative regulating the maximum daily 8-hour mean.
1. Introduction
Although compliance with the European (EU) limit values for air pollutants has been achieved over large parts in Spain, some challenges remain for ozone (O3) on the maximum daily 8-hour mean and information limit values, for particulate matter on the PM10 annual and daily limit values and for NO2 on annual and hourly limit values. According to [1] at least one maximum daily eightour average concentration of ozone over 120 μg/m3 was observed in every EU Member State and in most of the other countries, in every summer month and most of the stations during summer 2011, as in all previous years. This target value was exceeded in 2011 for more than 25 days in a significant part of Europe comprising the following countries: 17 EU Member States (Austria, Belgium, Bulgaria, the Czech Republic, Cyprus, Germany, Greece, France, Hungary, Italy, Luxembourg, Malta, Poland, Portugal, Slovenia and Slovakia and Spain) and five other countries (Croatia, the former Yugoslav Republic of Macedonia, Liechtenstein, Serbia and Switzerland). As in previous years, the highest widespread concentrations occurred in the Mediterranean area, but also affected western and central Europe.
While local or regional emissions and environmental conditions are responsible for most of the environmental problems related to the exceedance of air quality standards, there is well-documented evidence for the long- istances transport of air pollutants. Pollutants emitted from natural or anthropogenic sources to the atmosphere may be advected over distances of hundreds to 1000’s of kilometres [2].
Quantifying the impact of long-range transport of air pollutants is an important priority to define strategies and plans to reduce air pollutant levels. Models consider all the physical and chemical processes involved in air pollutant concentration, providing an estimation of the impact of the long-range transport of pollutants. Their use can provide some insight on how emissions from distant areas can affect others. In this work we have applied a photochemical model (CHIMERE model) to determine the contribution of European emissions to air quality in Spain. The CHIMERE model has been extensively applied in Europe over the past years [3-5]. In Spain, the CHIMERE model has been applied to model gas and particle pollutants [6,7], and more recently, to model heavy metals [8].
2. Methodology
The CHIMERE model (2008c version) was applied to simulate a European-scale domain at 0.2˚ of horizontal resolution for the whole 2009. The model calculates the concentration of 44 gaseous species and both inorganic and organic aerosols of primary and secondary origin, including primary particulate matter, mineral dust, sulphate, nitrate, ammonium, secondary organic species and water. A detailed description of the model configuration and performances over Europe are presented in previous studies, using surface observations [9,10]. In Spain CHIMERE model performance has been evaluated in [6] and [7].
The WRF model, a fully compressible and non-hydrostatic model (http://www.wrf-model.org/index.php), forced by the National Centre for Environmental Prediction model (GFS) analyses, was used to obtain meteorological input fields. Emissions were derived from the annual totals of the EMEP (European Monitoring and Evaluation Programme) database for 2003 ([11], http:// www.ceip.at/). Original EMEP emissions were disaggregated taking into account the land use information, in order to get higher resolution emission data. Boundary conditions for the coarse domain were provided from monthly climatology from LMDz-INCA model [12] for gases concentrations and from GOCART model [13] for particulate species.
Simulations were performed for five different emissions scenarios: 1) Base case, with 2009 EMEP emissions, 2) emissions only from Spain to analyze out-ofSpain emissions impact, 3) a modification of EMEP emissions setting to zero all the European countries emissions 4) a modification of EMEP emissions setting to zero France emissions and finally 5) modification of EMEP emissions setting to zero Portugal emissions. To see out-of Spain emissions, differences between the base case and scenario 2 were calculated. European effects were obtained from the differences between the base case and scenario 3. France and Portugal effects were evaluated by comparing base case with scenarios 4 and 5, respectively. Differences were calculated as PCi[BC]— PCi[Ci], where PCi[BC] is the concentration of a given pollutant for the base case and PCi[Ci] its concentration at each of the other cases.
3. Results
3.1. O3
Figure 1 shows the annual mean concentration for ozone in 2009 for the base case. As it can be inferred from this figure, the highest values are located over the Mediterranean area and the Balearic Islands. Martin et al. [14] have recently assessed the air quality in Spain for 2009, with a combination of measurements and model methodology. This study indicated that the areas affected by exceedances of the maximum daily 8-hour mean target value (120 μg/m3, 25 exceedances permitted) are close to urban and industrial areas, affecting mainly several regions in the centre, south and Eastern Iberian Peninsula.
The limit value for public information (180 μg/m3) was also exceeded, although less than in 2008. Alert limit value (240 μg/m3) was exceeded only in a zone nearby a large industrial area in the centre of the Iberian Peninsula. The highest problems regarding normative compliance, according to Martin et al. report, are found in the Mediterranean area, especially in the North-Eastern Spain (Catalonia region).
The performance of the CHIMERE model in Spain at a 0.2˚-horizontal resolution has been previously evaluated in [6] and [7] for 2003, 2004 and 2005. For O3, the model demonstrated in rural areas to achieve the requirements proposed in typically-used statistics, such as those in [15] so as to consider a model adequate for air quality purposes.
In this paper we include some time series (Figure 2) showing model and observations at some EMEP monitoring sites to show how the model behaves at areas where the impacts are expected to be higher. The location of these sites is presented in Figure 1.
Differences between the base case and each emission scenario for ozone are presented in Figure 3 (annual basis) for each pollutant. According to the model, emissions out of Spain have a significant influence in the Southern
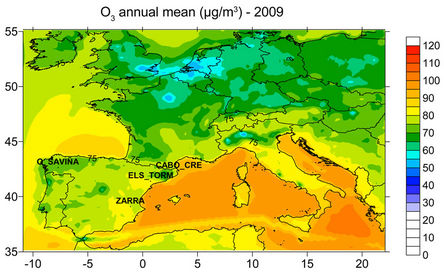
Figure 1. 2009 ozone mean concentration.
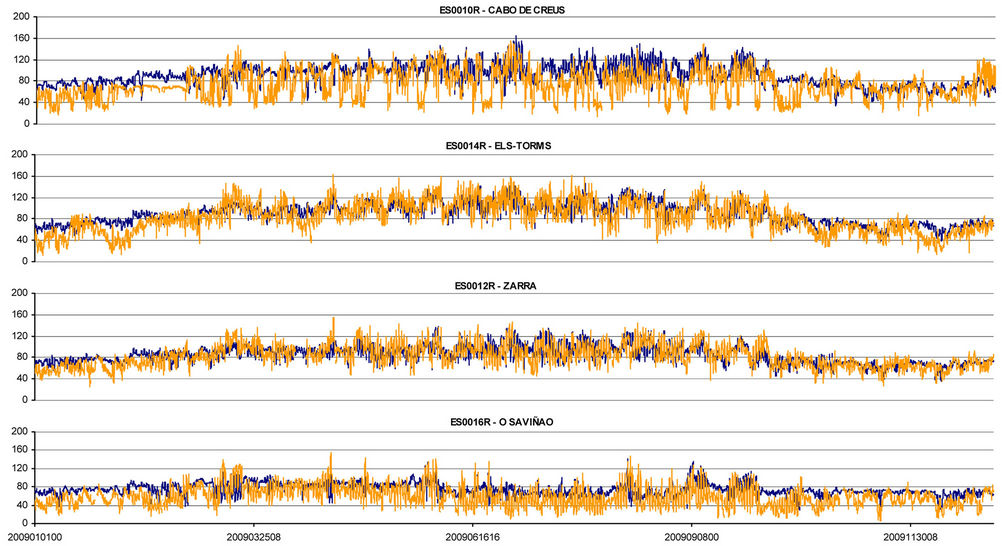
Figure 2. Comparison of time series showing hourly ozone concentration (µg/m3) estimated by CHIMERE model and measurements at several Spanish background air quality.
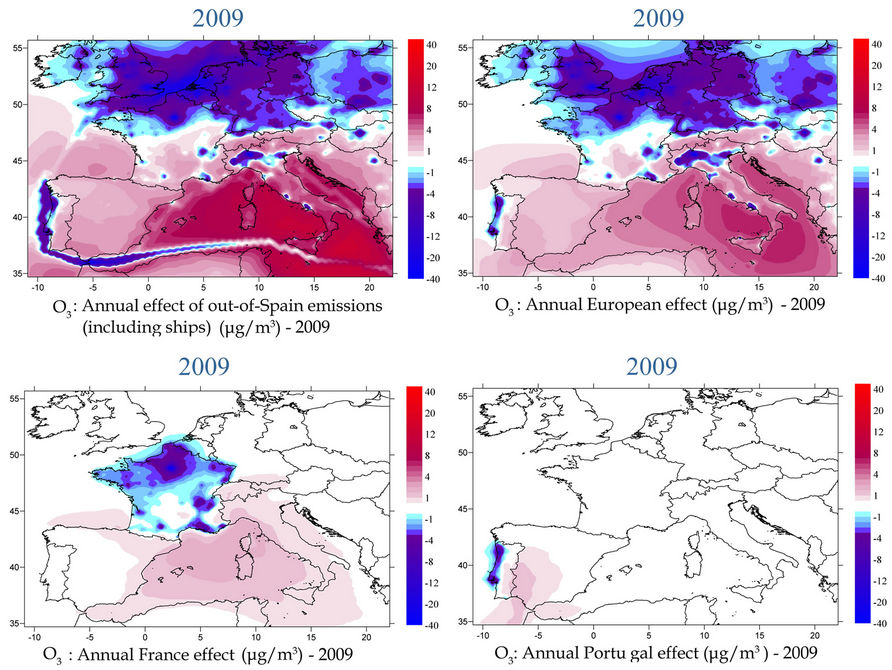
Figure 3. Effect of out-of-Spain (upper left map), European countries, (upper right map), France (lower left map) and Portugal (lower right map) emissions on annual 2009 ozone concentration in Spain.
and Eastern Spain, in special in the Balearic Islands. This influence is a consequence of the addition of ships effects and European countries effects. According to the model results, and comparing European effect with France effect, other countries (probably Italy) are affecting Spain air quality regarding O3. Also Portugal presents an influence area over the Southwestern Spain.
When looking at the monthly behaviour (Figures 4 and 5) the higher impacts of France and Portugal are observed over the summer period, mainly in August, when increments of 6 μg/m3 in the monthly average concentration are observed over Menorca Island due to France
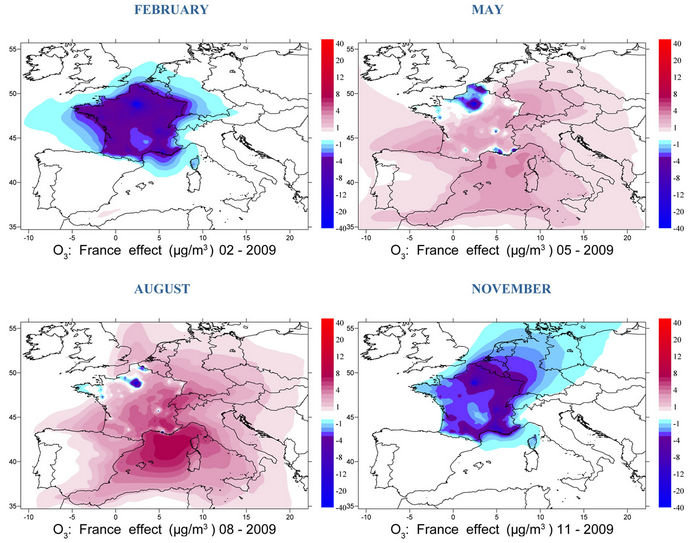
Figure 4. Impact of France emissions for several months.
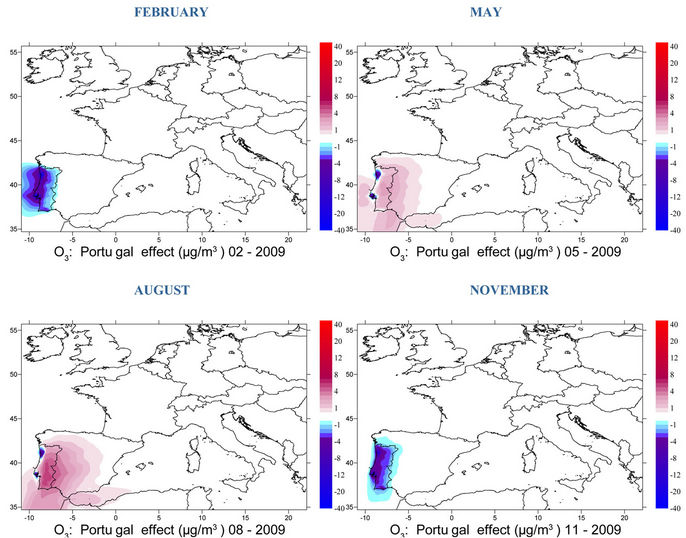
Figure 5. Impact of Portugal emissions for several months.
emissions and about 4 μg/m3 in the Southwestern Spain.
A map showing exceedances of the target value for ozone (120 μg/m3 in 8-hour average concentration) are in Figure 6. The areas in red indicate that more than 25 exceedances were estimated by the model.
The comparison between the base case (2009) and all the emission scenarios (Figure 7) shows that some of the areas in Spain failing to meet EU target value for ozone have a contribution of out-of-Spain emissions. These maps were calculated by comparing the exceedances in the base case with those in the different scenarios. Areas with more than 25 exceedances in the base but less than 25 for switched-off emissions are marked in dark pink colour, indicating that over those areas air pollution reaching Spain by transboundary transport could contribute to the non-compliance with European normative. Other parts of Europe could be also very affected by transboundary transport of air pollutants.
3.2. NO2
NO2 2009 mean concentration is presented in Figure 8.
NO2 is mainly an urban problem, as traffic being the principal contributor. Martín et al. (2011) have shown that exceedances of limit values are observed over urban areas, in special Madrid, where exceedances of the annual
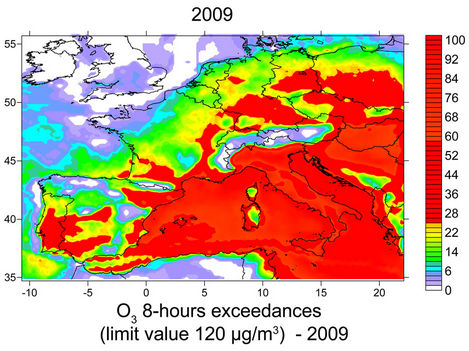
Figure 6. Exceedances of the target value for ozone (120 mg/m3 in 8-hour average concentration).
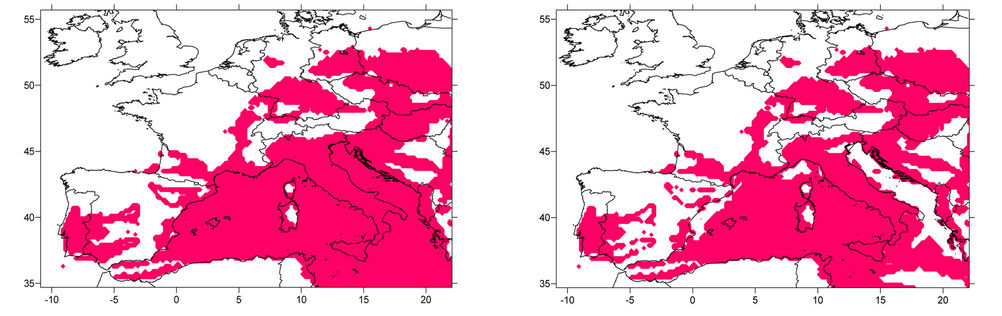
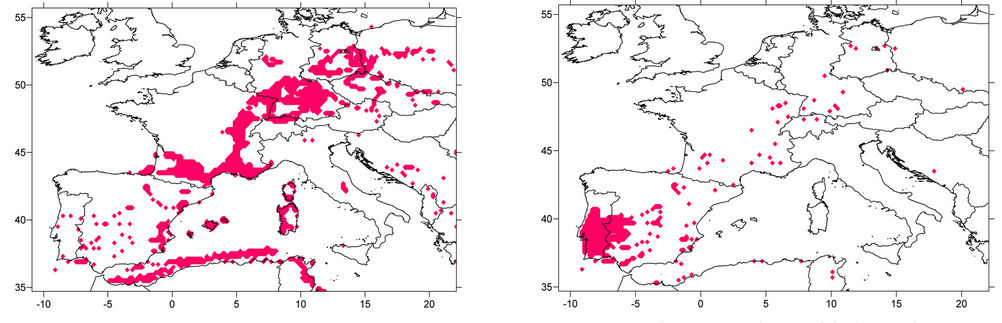
(a)(b) (c)(d)
Figure 7. Non-compliance of the target value for ozone (8-hour average; more than 25 exceedances in pink) with a contribution of out-of-Spain (a), European (b), France (c) or Portugal (d) emissions.
(40 μg/m3) and hourly (200 μg/m3) limit values were registered. Also in Oviedo some exceedances of both limit values were observed. In other urban areas such as Barcelona, Granada, Murcia, Valencia, Salamanca, A Coruña and Bilbao, just the annual limit value was exceded in 2009. These exceedances in urban areas are not captured by the model according at its resolution although model maxima values are also located over some urban areas (Madrid, Barcelona).
The estimated impacts of the different studied cases of European countries emissions (Figure 9) on the NO2 concentrations in Spain seem to be low, and just affecting Cataluña and Balearic Islands areas.
More important is the effect of ships, that can be observed by comparing the out-of-Spain emissions effect (top left) with the European effect (top right) in special in the Southern Spain and Balearic Islands.
3.3. SO2
The map of the 2009 mean annual SO2 concentration is illustrated in Figure 10. In general, air concentration is low and below the limit values.
European emissions do not seem to contribute to SO2 levels (Figure 11); some effects could be produced due to maritime traffic emissions, in special over the Gibraltar Strait and some coastal areas.
3.4. PM10
A contour map showing 2009 PM10 concentration in
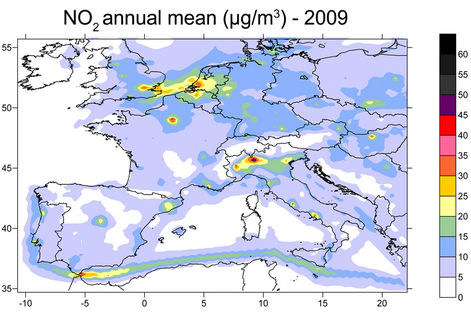
Figure 8. NO2 mean concentration for 2009.
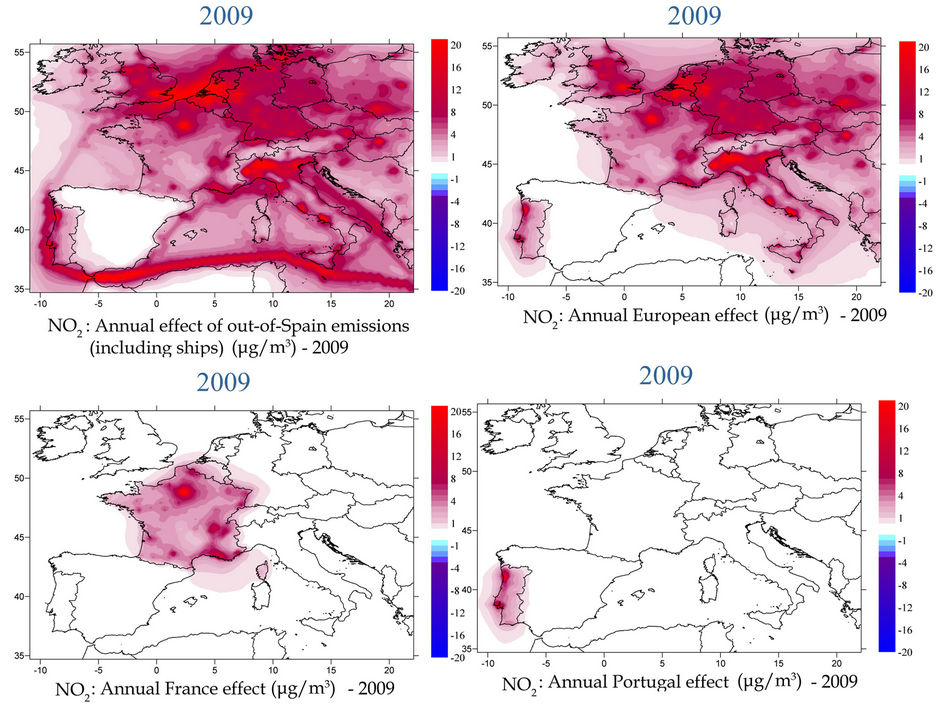
Figure 9. Effect of out-of-Spain (upper left map), European countries, (upper right map), France (lower left map) and Portugal (lower right map) emissions on annual 2009 NO2 concentration in Spain.
Spain is presented in Figure 12. The lowest values are located over remote areas, while the highest levels are found in Northern and North-Western Spain, and over the Mediterranean area, corresponding to urban areas, large industrial areas and the vicinity of thermal powers stations. Nevertheless, the model is considerably underestimating observed values, probably due to an underestimation of primary particles in Spain. Observed values in monitoring sites have registered some exceedances of the annual limit value in Asturias, Madrid, Andalucía and Cataluña.
Figure 13 indicates some weak influence of European transport over the North-eastern area that could be affecting Cataluña exceedances and over Balearic Islands. Besides France other contributors, probably Italy, could be enhancing PM10 air levels. Ships seem also to significantly contribute to PM10 concentration.
For the daily limit values, some exceedances are observed (not captured by the model) following a similar pattern to that found for the annual limit value (urban and industrial areas) although with more areas affected (Galicia, Asturias, Cantabria, País Vasco, La Rioja, Madrid, Castilla-La Mancha, Murcia, Comunidad Valencina, Andalucía y Cataluña). The largest impact of France emissions for 2009 was observed during March and April (Figure 14, showing monthly mean values). This effect
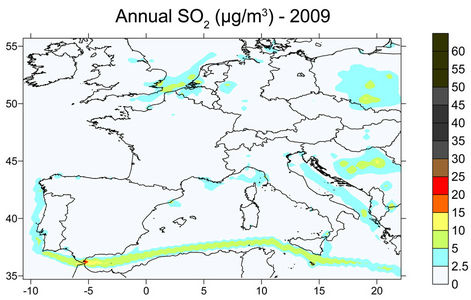
Figure 10. SO2 mean concentration for 2009.
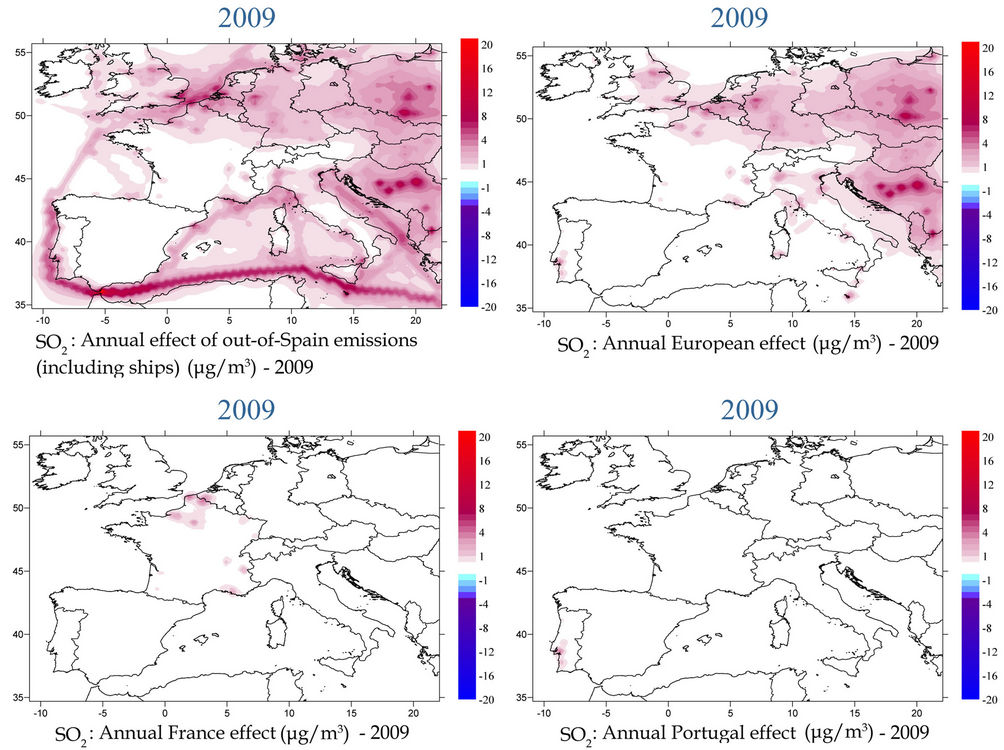
Figure 11. Effect of out-of-Spain (upper left map), European countries, (upper right map), France (lower left map) and Portugal (lower right map) emissions on annual 2009 SO2 concentration in Spain.
may have a minor effect on the compliance with air quality limit values in Spain, but the underestimation of the model for this pollutant does not allow concluding on this point.
4. Conclusions
An analysis of the contribution of out-of-Spain emission sources to air quality in Spain has been done by applying the CHIMERE photochemical model. Moreover, specific contributions were analysed, such as France, Portugal and ships contributions.
For ozone there is a clear impact of transboundary transport of air pollutants on air quality in Spain, espeally in the summer period. In fact, the model indicates that emissions from Portugal, France, ships, and also from other European countries (probably Italy) contribute to the non-compliance with European normative regardg the maximum daily 8-hour mean. European countries seem to have also some weak effect on PM10 air levels in Spain.
The study has shown that maritime traffic emissions can affect SO2, NO2 and PM10 concentration in coastal areas.
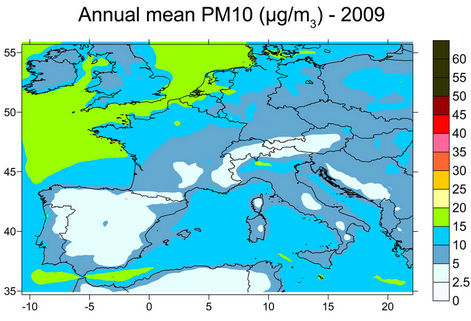
Figure 12. PM10 mean concentration for 2009.
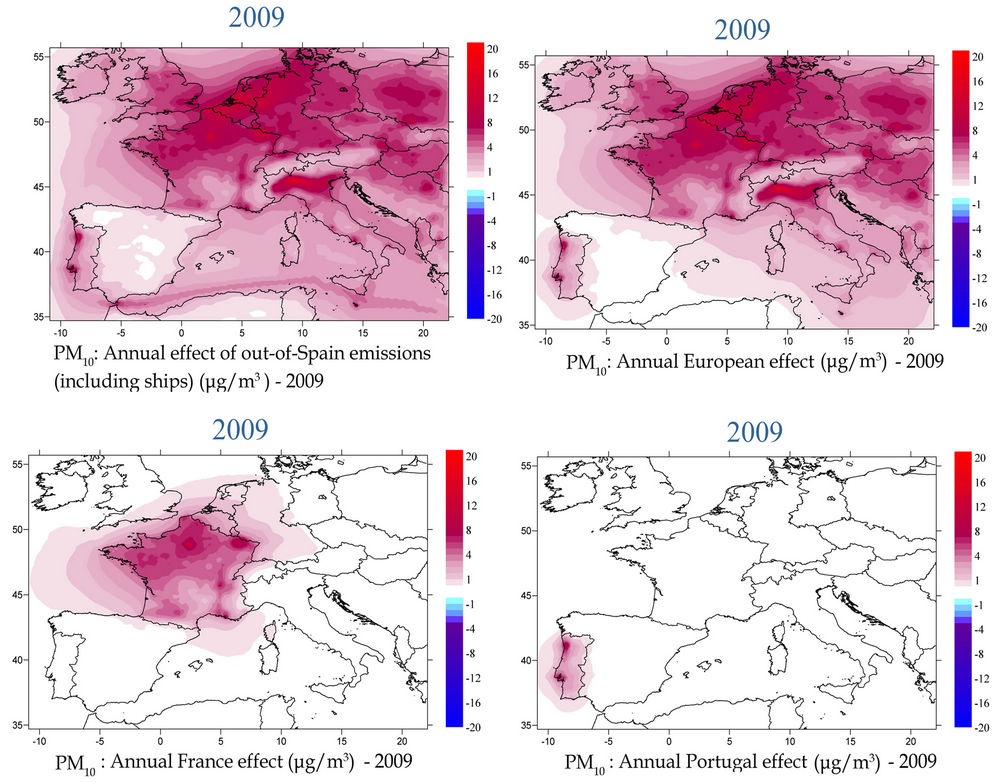
Figure 13. Effect of out-of-Spain (upper left map), European countries, (upper right map), France (lower left map) and Portugal (lower right map) emissions on annual 2009 PM10 concentration in Spain.
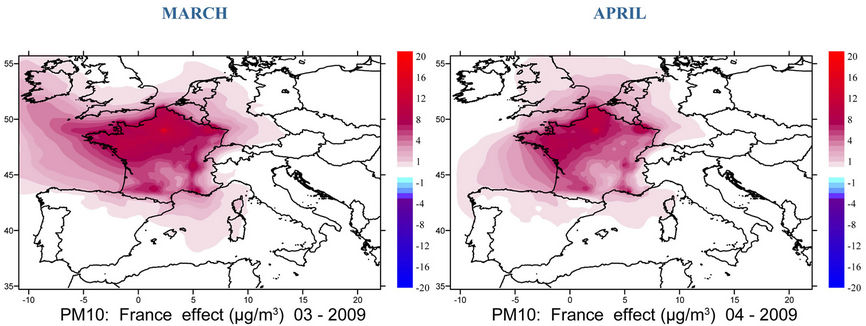
Figure 14. France effect on PM10 air levels in March and April 2009.
5. Acknowledgements
This work has been financed the Ministerio de Agricultura, Alimentación y Medio Ambiente in Spain.
REFERENCES
- European Environmental Agency, “Air Pollution by Ozone across Europe during Summer 2011. EEA Technical Report No 1/2012,” Overview of Exceedances of EC Ozone Threshold Values for April-September 2011, 2012.
- T. R. Oke, “Boundary Layer Climates,” Methuen, London and New York, 1978. doi:10.4324/9780203407219
- A. Hodzic, R. Vautard, B. Bessagnet, M. Lattuati and F. Moreto, “Long-Term Urban Aerosol Simulation versus Routine Particulate Matter Observations,” Atmospheric Environment, Vol. 39, No. 32, 2005, pp. 5851-5864. doi:10.1016/j.atmosenv.2005.06.032
- B. Bessagnet, A. Hodzic, R. Vautard, M. Beekmann, L. Rouil and R. Rosset, “Aerosol Modelling with CHIMERE —First Evaluation at Continental Scale,” Atmospheric Environment, Vol. 38, No. 18, 2004, pp. 2803-2817. doi:10.1016/j.atmosenv.2004.02.034
- A. Monteiro, R. Vautard, Borrego and A. I. Miranda, “Long-Term Simulations of Photo Oxidant Pollution over Portugal Using the CHIMERE Model,” Atmospheric Environment, Vol. 39, No. 17, 2005, pp. 3089-3101.
- M. G. Vivanco, et al., “An Evaluation of the Performance of the CHIMERE Model over Spain Using Meteorology from MM5 and WRF Models,” Computational Science and Its Applications, Vol. 5592, 2009, pp. 107-117.
- M. G. Vivanco, et al., “Multi-Year Assessment of Photochemical Air Quality Simulation over Spain,” Environmental Modelling & Software, Vol. 24, No. 1, 2009, pp. 63-73.
- M. G. Vivanco, et al., “Modelling Arsenic, Lead, Cadmium and Nickel Ambient Air Concentrations in Spain,” Proceedings of the 11th International Conference on Computational Science and Its Applications, Santander, 20-23 June 2011, pp. 243-246.
- H. Schmidt, C. Derognat, R. Vautard and M. Beekmann, “A Comparison of Simulated and Observed Ozone Mixing Ratios for the Summer of 1998 in Western Europe,” Atmospheric Environment, Vol. 35, No. 36, 2001, pp. 6277-6297. doi:10.1016/S1352-2310(01)00451-4
- R. Vautard, et al., “Paris Emission Inventory Diagnostics from ESQUIF Airborne Measurements and a Chemistry Transport Model,” Journal of Geophysics Research, Vol. 108, No. 17, 2003, pp. 8564-8585. doi:10.1029/2002JD002797
- V. Vestreng, K. Breivik, M. Adams, A. Wagener, J. Goodwin, O. Rozovskkaya and J. M. Pacyna, “Inventory Review 2005—Emission Data Reported to CLRTAP and under the NEC Directive—Initial Review for HMs and POPs, EMEP/MSC-W Technical Report 1/2005,” 2005.
- D. A. Hauglustaine, et al., “Interactive Chemistry in the Laboratoire de Meteorologie Dynamique General Circulation Model: Description and Background Tropospheric Chemistry Evaluation,” Journal of Geophysical Research, Vol. 109, 2004, Article ID: D04314. doi:10.1029/2003JD003957
- M. Chin, P. Ginoux, S. Kinne, B. N. Holben, B. N. Duncan, R. V. Martin, J. A. Logan, A. Higurashi and T. Nakajima, “Tropospheric Aerosol Optical Thickness from the GOCART Model and Comparisons with Satellite and Sunphotometer Measurements,” Journal of the Atmospheric Sciences, Vol. 59, No. 3, 2002, pp. 461-483. doi:10.1175/1520-0469(2002)059<0461:TAOTFT>2.0.CO;2
- F. Martín, et al., “Aplicación de Modelos Como Apoyo a la Evaluación Anual de la Calidad del Aire en España. Encomienda de Gestión 2010-2014 Entre el Ministerio de Medio Ambiente y el CIEMAT Para Trabajos en Materia de Calidad del Aire, Energía y Evaluación Ambiental.”
- T. W. Tesche, et al., “Improvement of Procedures for Evaluating Photochemical Models. Draft Final Report Prepared for California Air Resources Board,” Radian, Sacramento, 1990.