Journal of Environmental Protection
Vol. 3 No. 5 (2012) , Article ID: 19524 , 5 pages DOI:10.4236/jep.2012.35053
Semi-Quantitative PCR for Quantification of Hepatotoxic Cyanobacteria
![]()
1Institute of Biological Sciences, São Paulo State University, Rio Claro, Brazil; 2Department of Biological Sciences, Luiz de Queiroz College of Agriculture, University of São Paulo, Piracicaba, Brazil; 3Departamento de Gestão Ambiental, Instituto Federal de Educação, Ciência e Tecnologia do Sul de Minas Gerais—Campus Inconfidentes, Inconfidentes, Brazil.
Email: barros_sg@hotmail.com, *mbitt@usp.br
Received March 8th, 2012; revised April 9th, 2012; accepted May 6th, 2012
Keywords: Cyanobacteria; Microcystis; Competitive PCR; mcyB; cpcBA
ABSTRACT
Blooms of microcystin-producing cyanobacteria are a problem worldwide. Microcystin is a liver hepatotoxin commonly found in bodies of water and is produced mainly by the genus Microcystis. The aim of the present study was to develop and assess a competitive PCR method for the quantification of toxic and non-toxic Microcystis cells using the cpcBA and mcyB genes, which are respectively involved in the formation of phycocyanin and biosynthesis of microcystin. For the acquisition of competitor DNA, amplification sequences were carried out of the “cell DNA equivalent” of microcystin-producing (BCCUSP18) and non-microcystin-producing (BCCUSP03) strains of Microcystis spp. using primers described in the literature as well as others designed for the present study. The method was successfully developed, as competitor DNA was constructed and co-amplified with the target DNA. Competitive PCR proved to be useful in quantifying toxic and non-toxic cells of Microcystis spp. strains, representing a helpful methodology tool to study isolated toxin-producing cyanobacteria.
1. Introduction
Cyanobacterial blooms have become increasingly frequent in freshwater systems worldwide, causing countless adverse effects on public health and the environment. One of the greatest problems is that these organisms produce toxins with hepatotoxic and neurotoxic effects [1-3]. These toxins are released in water through cell lysis and remain dissolved for varying periods of time. Among the cyanobacteria capable of producing toxins is genus Microcystis Kützing ex Lemmermann, which produces several microcystin isoforms (hepatotoxins). Microcystin damages liver cells, especially through disruption of cytoskeleton components [3].
The lack of observable morphological differences between toxic and non-toxic colonies by optical microscope makes molecular detection of the potentially micro-cystinproducing genotype quite useful.
In Brazil, concerns over cyanobacteria and cyanotoxins increased following the incident in Caruaru, Pernambuco in 1996 [4]. Decree 518/2004 was the first legal mechanism to mandate the monitoring of cyanobacteria and cyanotoxins in public water supply reservoirs. That document sets 2.0 × 10⁴ cyanobacteria cells per milliliter and 1.0 μg·L–1 of microcystins as the maximum levels allowed in crude samples and treated water, respectively [5], in tune with the recommendations set by the World Health Organization [6].
The quantification of cyanobacteria cells using Sedgwick-Rafter or sedimentation chambers [7] is made difficult by the dense aggregates that are formed, hindering cell distinction [8].
The monitoring of cyanobacteria in public supply reservoirs could be made easier by applying quicker methods able to overcome the difficulty in cell visualization in colonial individuals. This requires the development and employment of sensitive methods that can guarantee the detection and quantification of these cyanobacteria at low cost. In that task, highlight is given to molecular detection of the potentially microcystin-producing genotype. Using PCR assays, molecular detection aims to investigate the existence of mcy genes in the populations, which are responsible for coding of the enzyme complex (microcystin synthetase), along with polyketide synthase.
Competitive PCR is based on the co-amplification of the target gene and a competitor DNA of known concentration; both can be amplified by the same primer [9]. Assuming there is a copy of the studied gene in the genome of the organism, once quantified the number of copies of the gene can be converted to the number of chromosomes, and consequently to the number of cells [10].
The objective of this study was to develop and investigate the applicability and efficiency of the competitive PCR method to quantify toxic and non-toxic Microcystis cells. To that end, nucleotide sequences named “competitor DNA” were obtained for phycocyanin (PC) genes and for the mcyB gene microcystin synthetase. The accuracy of the competitive PCR technique was later assessed against a cell count by optical microscope.
2. Materials and Methods
2.1. Strains and Environment Samples
The study used strains Microcystis sp. BCCUSP18 and BCCUSP03 from the “Brazilian Cyanobacteria Collection—University of São Paulo” (BCCUSP), microcystinproducing and non-producing, according to [11,12], respectively, under controlled lighting conditions (30 µmol·m–2·s–1), photoperiod (14:10 hours, light-dark) and temperature (21˚C ± 0.5˚C), BG-11 culture medium [13] modified according to [14].
2.2. Cell Quantification
The samples were quantified using a Fuchs Rosenthal hemocytometer with the aid of an Olympus binocular microscope. A minimum of 400 cells were counted in order to achieve an error of approximately 10% for a confidence level of 95% [15].
2.3. DNA Extraction
Single-mL aliquots of the culture and environment sample containing a quantified number of cells were used to extract the DNA according to the methodology of [16]. This made it possible to relate the volume of the extracted DNA solution to the corresponding cell number, which was expressed as the number of “cell DNA equivalent” (hereby referred to as CDE in this study).
2.4. Competitor DNA Construction
Competitor DNA was synthesized from consecutive amplifications, as performed by [17], as shown in Figure 1. The phycocyanin intergenic spacer (PC-IGS), considered a housekeeping gene in cyanobacteria, was amplified, as was the mycB gene involved in the biosynthesis of microcystin. Amplifications were carried out in a GeneAmp PCR System 9700 thermal cycler (Applied Biosystems, USA) using the pureTaq Ready-To-Go PCR Beads kit (GE Healthcare, Piscataway, NJ, USA), 20 µM of each primer, 5 to 10 ng of DNA and ultrapure water (Mili-Q, Millipore, USA) to fill a 25 µL reaction. Primers and amplification conditions are shown in Table 1.
The amplification products were visualized by 1.2% agarose gel electrophoresis stained with ethidium bromide (2.0 µg·mL–1). The quantity and purity of competetor DNA were measured using a Nanodrop ND-1000 spectrophotometer (Nano-Drop Technologies, Wilmington, DE, USA).
2.5. Competitive PCR
Trials were carried out in triplicate to evaluate the amplification efficiency of the different competitor DNA constructed. A total of four ten-fold dilutions of competitor mcyB (7.4 × 10⁻² ng, 7.4 × 10⁻³ ng, 7.4 × 10⁻⁴ ng or 7.4 × 10⁻⁵ ng) and competitor cpcBA (6.6 × 10⁻³ ng, 6.6 × 10⁻⁴
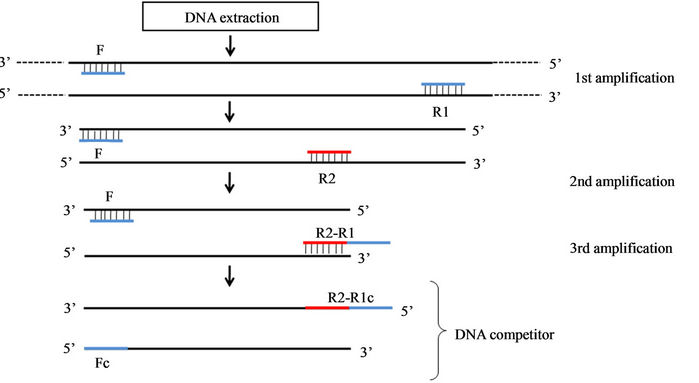
Figure 1. Phases of competitor DNA construction. F. forward primer obtained in Neilan et al. (1995); R1. Reverse primer obtained in Neilan et al. (1995); R2. Reverse primer designed in the present study; R2-R1. Reverse primer with combined R1 and R2 synthesis; Fc. Genomic region complementary to forward primer F; R1/R2c. Genomic region complementary to reverse primer R1.
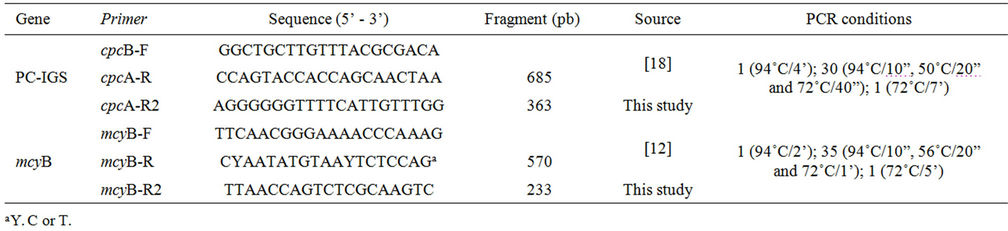
Table 1. Primers and conditions of the reactions used to construct the competitor DNA.
ng, 6.6 × 10⁻⁵ ng or 6.6 × 10⁻⁶ ng) were used, along with 2.0 × 10⁴ CDE from toxic and non-toxic strains.
Amplifications were carried out in a GeneAmp PCR System 9700 thermal cycler (Applied Biosystems, USA) using the pureTaq Ready-To-Go PCR Beads kit (Amersham, Piscataway, NJ), 20 µM of each primer, 2.0 × 10⁴ CDE, competitor mcyB or competitor cpcBA and ultrapure water (Mili-Q, Millipore, USA) to fill a 25 µL reaction.
A control was performed for the target DNA (Ct), using only target DNA in the amplification, without competitor DNA. A control was also performed for the competitor DNA, without target DNA (Cc).
The assay was carried out to investigate the amount of competitor DNA at which the amplification of target DNA (2.0 × 10⁴ cell DNA equivalents) and competitor DNA would be equivalent. The optical densities (OD) of the bands of amplified target and competitor DNA were measured using Kodak Digital Science 1D 3.6 software from the digital image of the 1.2% agarose gel stained with ethidium bromide (2.0 µg·mL–1); the obtained data were used to plot a line graph in Excel 2007 (Microsoft, USA).
2.6. Quantification by Competitive PCR
Competitor DNA and increasing quantities of CDE from DNA extracted from the different strains were amplified to obtain the standard curve.
The amplifications, reaction controls and visualization of amplified DNA in agarose gel were carried out as previously described.
The linear regression equation for each assay was obtained using SAS statistical software for Windows (SAS Institute, Inc.), interposing the log10 of the ratio between the ODs of the target and competitor DNA on the X-axis, and the log10 of the quantity of target DNA CDE on the Y-axis.
3. Results and Discussion
It was identified that 3.7 × 10⁻³ ng of competitor mcyB and 6.6 × 10⁻⁵ ng of competitor cpcBA co-amplified with DNA of BCCUSP18 cells were enough to quantify 2.0 × 10⁴ CDE of toxic cells. For strain BCCUSP03 this value was 3.3 × 10⁻⁴ ng of competitor cpcBA. Visual observations in the digital image of agarose gel, as well as analysis of the obtained OD graphic data, confirmed the results (Figure 2).
From the assays of competitor cpcBA with cells from the different strains, 1.84 × 10⁴ cells of Microcystis sp. were obtained. The quantification of toxic cells using co-amplification with competitor mcyB was 1.54 × 10⁴ cells of Microcystis sp. BCCUSP18 (Table 2).
Cell counts and real-time PCR analysis in strains of microcystinand nodularin-producing cyanobacteria using mcyE and ndaF, respectively, suggest there are 1.3 copies of these genes per cell [19]. Those authors normalized the toxigenic potential for one copy of the genes per cell. Our results with genes cpcBA and mcyB, for strain BCCUSP18, are comparable to those of [19] as the cpcBA:mcyB ratio was equal to 0.94. The ratio between copy number of cpcBA and cell number in BCCUSP03 was 1.07.
As is known through genetic sequencing, Microcystis spp. has only one copy of the mcy operon [20] and two copies of gene PC [21]. As such, the results found herein express the number of copies of genes mcyB and cpcBA in the genome of this cyanobacterium. [22,23] found similar results in the quantification of mcyB and cpcBA by real-time PCR. Both concluded that the ratio between mcyB and cpcBA is 1:1.
Quantifying toxic cells, either by competitive PCR or real-time PCR, includes the possibility that intrinsic errors can affect the results [24]. Nevertheless, it is believed that the data obtained in this study allowed a standardization of the competitive PCR technique with high reproducibility, as represented by highly significant coefficients of explanation of the line (R2) values; it is less onerous than real-time PCR and can be applied in experiments with isolated cultures of toxic and non-toxic cells.
4. Conclusion
In conclusion, it can be affirmed that the methodology developed to construct competitor DNA was successful, allowing the co-amplification of the target and competi-
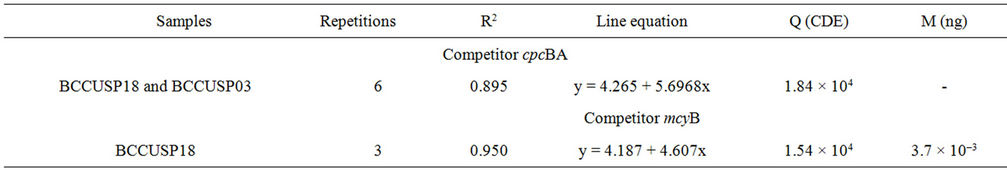
Table 2. Quantitative analysis of strains and environment sample using competitive PCR. R2. Coefficient of explanation of the line; Q. Quantification by competitive PCR; M. Mass of competitor DNA used in competitive PCR.
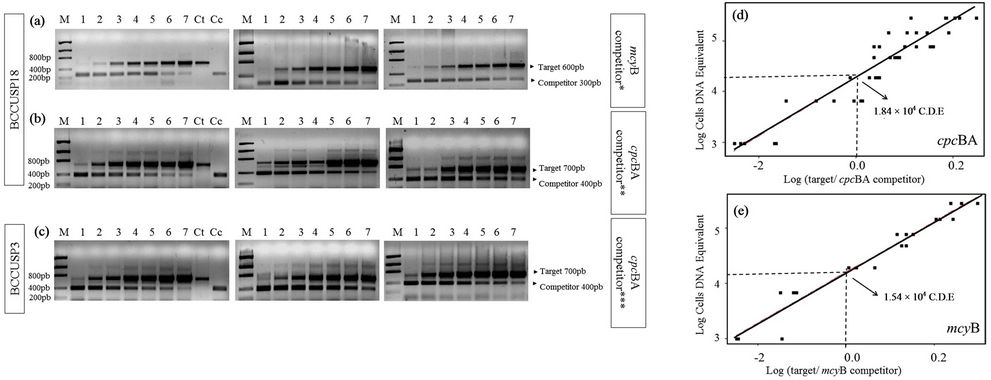
Figure 2. Agarose gels with competitive PCR assays for strains BCCUSP03 and BCCUSP18 and their respective graph analyses. (a) Competitor mcyB with BCCUSP18; (b) Competitor cpcBA with BCCUSP18; (c) Competitor cpcBA with BCCUSP3; M. Low DNA Mass LadderTM; 1. 1.0 × 10³ CDE; 2. 7.0 × 10³ CDE; 3. 2.0 × 10⁴ CDE; 4. 5.0 × 10⁴ CDE; 5. 8.0 × 10⁴ CDE; 6. 1.5 × 10⁵ CDE; and 7. 3.0 × 10⁵ CDE. Ct. Target DNA controle; Cc. Competitor DNA control; (*). 3.7 × 10⁻³ ng, (**). 6.6 × 10⁻⁵ ng; (***). 3.3 × 10⁻⁴ ng; (d) Amplification with competitor cpcBA; (e) Amplification with competitor mcyB.
tor DNA with high reproducibility. Competitive PCR showed potential for use in scientific studies as a less onerous alternative to real-time PCR, and as an option for water source monitoring, abiding by the limits of Brazilian legislation.
5. Acknowledgements
This work was supported by grants from “Fundação de Amparo à Pesquisa do Estado de São Paulo” (Proc. 2007/ 57672-0) and CNPq (Proc. 301739/2011-0)—Brazilian agencies for the promotion of Science.
REFERENCES
- W. W. Carmichael, “The Toxins of Cyanobacteria,” Scientific American, Vol. 270, No. 1, 1994, pp. 78-86. doi:10.1038/scientificamerican0194-78
- K. Sivonen and G. Jones, “Cyanobacterial Toxins,” In: I. Chorusand and J. Bartram, Eds, Toxic Cyanobacteria in Water: A guide to their Public Health Consequences, Monitoring and Management, Für WHO Durch, London (E & FN Spon /Chapman & Hall), 1999, p. 416.
- I. Chorus, I. R. Falconer, H. J. Salas and J. Bartram, “Health Risks Caused by Freshwater Cyanobacteria in Recreational Waters,” Journal of Toxicology and Environmental Health, Part B: Critical Reviews, Vol. 3, No. 4, 2000, pp. 323-347. doi:10.1080/109374000436364
- E. M. Jochimsen, W. W. Carmichael, J. An, D. Cardo, S. T. Cookson, C. E. M. Holmes, M. B. C. Antunes, D. A. Melo-Filho, M. L. Tereza, V. S. T. Barreto, S. M. F. O. Azevedo and W. R. Jarvis, “Liver Failure and Death after Exposure to Microcystin Toxins at a Hemodialysis Center in Brazil,” The New England Journal of Medicine, Vol. 338, No. 13, 1998, pp. 873-878. doi:10.1056/NEJM199803263381304
- Regulation MS 518/2004, “Guidelines for Drinking Water Quality,” Official Law Reports, 26 March 2004, Section I, p. 266.
- World Health Organization, “Guideline for Drinking Water Quality,” 2nd Edition, Geneva, 1998, pp. 95-110.
- I. Chorus and J. Bartram, “Toxic Cyanobacteria in Water: A Guide to Public Health Significance, Monitoring and Management,” Für WHO Durch, London, (E & FN Spon /Chapman & Hall), 1999, p. 416.
- C. Bernard, P. Monis and P. Baker, “Disaggregation of Colonies of Microcystis (Cyanobacteria): Efficiency of Two Techniques Assessed Using an Image Analysis System,” Journal of Applied Psychology, Vol. 16, No. 2, 2004, pp. 117-125. doi:10.1023/B:JAPH.0000044774.38561.44
- P. D. Siebert and J. M. Larrik, “Competitive PCR,” Nature, Vol. 359, No. 6395, 1992, pp. 557-558. doi:10.1038/359557a0
- M. Yoshida, T. Yoshida, Y. Takashima, R. Kondo and S. Hiroishi, “Genetic Diversity of the Toxic Cyanobacterium Microcystis in Lake Mikata,” Environmental Toxicology, Vol. 20, No. 3, 2005, pp. 229-234. doi:10.1002/tox.20102
- M. C. Bittencourt-Oliveira, “Detection of Potencial Microcystin-Producing Cyanobacteria in Brazilian Reservoirs with a mcyB Molecular Marker,” Hamful Algae, Vol. 2, No. 1, 2003, pp. 51-60. doi:10.1016/S1568-9883(03)00004-0
- M. C. Bittencourt-Oliveira, V. Piccin-Santos and S. Gouvêa-Barros, “Microcystin-Producing Genotypes from Cyanobacteria in Brazilian Reservoirs,” Environmental Toxicology, 2010. doi:10.1002/tox.20659
- R. Rippka, J. Deruelles, J. B. Waterbury, M. Herdman and R. Y. Stanier, “Generic Assigments, Strain Histories and Properties of Pure Cultures of Cyanobacteria,” Journal of General Microbiology, Vol. 111, No. 1, 1979, pp. 1-61.
- M. C. Bittencourt-Oliveira, “Development of Microcystis aeruginosa (Kützing) Kützing (Cyanophyceae/Cyanobacteria) under Cultivation and Taxonomic Implications,” Algological Studies, Vol. 99, 2000, pp. 29-37.
- R. R. L. Guillard, “Division Rates,” In: J. R. Stein, Ed., Handbook of Phycological Methods: Culture Methods and Growth Measurements, Cambridge University Press, London, 1973, pp. 289-311.
- S. O. Rogers and A. J. Bendich, “Extration of DNA from Milligram Amounts of Fresh Herbarium and Mummified Plant Tissues,” Plant Molecular Biology, Vol. 5, No. 2, 1985, pp. 69-76. doi:10.1007/BF00020088
- T. Yoshida, Y. Yuki, S. Lei, H. Chinen, M. Yoshida, R. Kondo and S. Hiroishi, “Quantitative Detection of Toxic Strains of the Cyanobacteria Genus Microcystis by Competitive PCR,” Microbes and Environments, Vol. 18, No. 1, 2003, pp. 16-23. doi:10.1264/jsme2.18.16
- B. A. Neilan, D. Jacob and A. E. Goodman, “Genetic Diversity and Phylogeny of Toxic Cyanobacteria Determined by DNA Polymorphisms within the Phycocyanin Locus,” Applied and Environmental Microbiology, Vol. 61, No. 11, 1995, pp. 3875-3883.
- J. Al-Tebrineh, M. M. Gehringer, R. Akcaalan and B. A. Neilan, “A New Quantitative PCR Assay for the Detection of Hepatotogenic Cyanobacteria,” Toxicon, Vol. 57, No. 4, 2011, pp. 546-554. doi:10.1016/j.toxicon.2010.12.018
- Y. Tanabe, K. Kaya and M. M. Watanabe, “Evidence for Recombination in the Microcystin Synthetase (mcy) Genes of Toxic Cyanobacteria Microcystis spp.,” Journal of Molecular Evolution, Vol. 58, No. 6, 2004, pp. 633-641. doi:10.1007/s00239-004-2583-1
- T. Kaneko, N. Nakajima, S. Okamoto, I. Suzuki, Y. Tanabe, M. Tamaoki, Y. Nakamura, F. Kasai, A. Watanabe, K. Kawashima, Y. Kishida, A. Ono, Y. Shimizu, C. Takahashi, C. Minami, T. Fujishiro, M. Kohara, M. Katoh, N. Nakazaki, S. Nakayama, M. Yamada, S. Tabata and M. M. Watanabe, “Complete Genomic Structure of the BloomForming Toxic Cyanobacterium Microcystis aeruginosa NIES-843,” DNA Research, Vol. 14, No. 6, 2007, pp. 247-256. doi:10.1093/dnares/dsm026
- R. Kurmayer and T. Kutzenberger, “Application of RealTime PCR for Quantification of Microcystin Genotypes in a Population of the Toxic Cyanobacterium Microcystis spp.,” Applied and Environmental Microbiology, Vol. 69, No. 11, 2003, pp. 6723-6730. doi:10.1128/AEM.69.11.6723-6730.2003
- E. Schober, M. Werndl, K. Laakso, I. Korschineck, K. Sivonen and R. Kurmayer, “Interlaboratorial Comparison of Taq Nuclease Assays for the Quantification of the Toxic Cyanobacteria Microcystis sp.,” Journal of Microbiological Methods, Vol. 69, No. 1, 2007, pp. 122-128. doi:10.1016/j.mimet.2006.12.007
- J. H. Ha, T. Hidaka and H. Tsuno, “Quantification of Toxic Microcystis and Evaluation of Its Dominance Ratio in Blooms Using Real-Time PCR,” Environmental & Science Technology, Vol. 4, No. 3, 2009, pp. 812-818. doi:10.1021/es801265f
NOTES
*Corresponding author.