Creative Education
Vol.08 No.08(2017), Article ID:77699,10 pages
10.4236/ce.2017.88091
Adoptability of Peer Assessment in ESL Classroom
Sumie Matsuno
Aichi Sangyo University College, Okazaki, Japan

Copyright © 2017 by author and Scientific Research Publishing Inc.
This work is licensed under the Creative Commons Attribution International License (CC BY 4.0).
http://creativecommons.org/licenses/by/4.0/


Received: June 10, 2017; Accepted: July 15, 2017; Published: July 18, 2017
ABSTRACT
In ESL class, a teacher in charge of the class usually evaluates all the students’ performances, where using peer assessment may be a good way to confirm or modify the teacher assessment. In this study, whether peer assessment can be adopted in class is considered using FACET analysis. Since this is a regular small English class in Japan, the participants are 18 ESL university students and one teacher. First, one misfitting rater is eliminated and all the other raters including the teacher are included as assessors. The rater measurement report shows that, after eliminating one rater, no raters are misfits. The FACET map shows that most of them, including the teacher, are lenient raters. In addition, only a few unexpected responses are detected. Overall, this study concludes that peer assessment can be reasonably used as additional assessment in class.
Keywords:
Peer Assessment, Oral Presentation, ESL University Students, FACET Analysis

1. Introduction
Assessment is an important activity in any educational setting; however, it is quite a burden for teachers. Especially when they must evaluate their students’ oral performances, it may cause some troubles since they can often see those performances only once unless they record them. In those situations, peer assessment can be an additional assessment method. Peer assessment involves students in making judgments of their peers’ work. Although numerous attempts have been made by scholars to show educational effectiveness of peer assessment (Brown, 2004; Li, 2017; Liu & Li, 2014; Pope, 2001) , some research results suggest that peer assessment could not be useful for formal assessment in class (Anderson, 1998; Cheng & Warren, 1999) . In fact, there is little agreement as to adoptability of peer assessment as additional assessment in class. Therefore, this study is intended as an investigation of whether peer assessment can be reasonably adopted along with teacher assessment in EFL classroom.
2. Literature Review
Studies on peer assessment have been conducted both in L1 (English as a first language) and L2 (English as a second/foreign language) settings. In L1 setting, it is often controversial whether peer assessment is meaningful since students tend to be doubtful of the worth of peer assessment and they often feel uncertain and uncomfortable by assessing peers (Anderson, 1998) . Domingo, Martinez, Gomariz, & Gamiz (2014) also mention that assessing more than thirty peers make them not assess seriously. Although peer assessment is skeptical in terms of effectiveness, many research results proved that peer assessment gave various benefits in educational settings such as promoting student learning (Liu & Li, 2014; Pope, 2001) and students’ motivation, autonomy and responsibility (Brown, 2004; Pope, 2001) . Li (2017) researched 77 students participating in a peer assessment activity and found that peer assessment could be meaningful in classrooms if it was anonymous and/or students were trained.
Regarding L2 settings, Cheng & Warren (1999) claimed that correlations between teacher raters and peer raters varied depending on the tasks and the situations (1999). On the other hand, some studies have shown that peer assessment is interrelated with instructor assessment (Jafarpur, 1991; Patri, 2002; Saito & Fujita, 2004) . Saito (2008) proved that training could improve the quality of peer assessment. Matsuno (2009) also found that peer-assessment were internally consistent and showed few bias interactions. Moreover, Jones & Alcock (2014) found high validity and inter-rater reliability by asking students to compare pairs of scripts against one another and concluded that the students performed well as peer assessors.
As you can see from the literature review, there is little agreement as to adoptability of peer assessment as formal assessment. Therefore, the present study is conducted with the aim of giving further evidence of whether peer assessment can be adopted in EFL class.
3. The Current Study
3.1. Procedure
Eighteen university students gave a presentation for about three minutes in English. They major in engineering in one of national universities in Japan. They take the English class as a requirement class and they learn how to make an effective English presentation in class. This is the regular small English as a foreign language class in Japan, where only one teacher teaches the class. Hence, in this class, the raters are one teacher (T) and 18 students (R1 - R18). The presenters are also 18 students (P1 - P18). Peer assessment often engages students in both roles as assessor and assesses, which is the case in this study, too. During and after each presentation, the teacher and the students evaluated the presentations based on five domains. Domains refer to aspects or characteristics of essay quality that are analyzed and separately scored. In the present study, five domains are assessed: posture, eye contact, gestures & voice inflection, visuals, and content. Each domain was scored on a 3-point scale holistically. The rater assigned a score of 1, 2, or 3, representing a presentation that ranged from “inadequate” to “OK” to “Good”. The raters also wrote some comments toward each presenter. Before the presentation, the teacher explained what each domain is and how to rate the presentations thoroughly, using the domains, for about three successive classes (each class is 90 minutes). The textbook Speaking of Speech (Harrington & LeBeau, 2009) published by Macmillan language house was utilized in class. In the three successive classes, the students learned the physical message (Unit 1 to Unit 3), where posture, eye contact, gestures, and voice inflection were covered. In addition, visuals and content were explained by the teacher. The presenters were asked to make effective visuals using either Microsoft PowerPoint or hand-written posters. Regarding content, they were asked to choose one speech among informative speech, layout speech, and demonstration speech. They watched the model presentation and were explained when they get good or poor scores.
3.2. Analysis
Multifaceted Rasch analysis is conducted using the FACETS computer program, version 3.80.0 (Linacre, 2017) . In the analysis, presenters, raters, and domains are specified as facets. The output of the FACETS analysis reports a FACETS map. The FACETS map provides visual information about differences that might exist among different elements of a facet such as differences in severity among raters. Presenter ability logit measures are estimated concurrently with the rater severity logit estimates and domain difficulty logit estimates. These are placed on the same linear measurement scale, so they are easily compared. The FACETS analysis also reports an ability measure and fit statistic for each presenter, a severity measure and fit statistic for each rater, and a difficulty estimate and fit statistic for each domain. It also shows unexpected responses, which may cause misfitting presenters, raters, or domains. In this study, the teacher’s assessment is included along with the peer assessment because whether using both peer assessment and teacher assessment would be beneficial or not will be scrutinized.
3.3. Initial Analysis
Based on Linacre (2012) and Engelhard & Wind (2016) , the values from 0.5 to 1.5 (the logit scale) of infit and outfit mean-square statistics are considered as “productive for measurement” (Linacre, 2012: p. 15) . Unlike raw test scores in which the distances between points may not be equal, the logit scale is a true interval scale. Infit and outfit mean-square statistics are summaries of residuals that describe departures from model expectations at the individual facet level. As an initial analysis, misfitting presenters, raters, and domains are examined, and one presenter and one rater are detected as misfits. Values more than 1.50 of fit statistics indicate that these presenters or raters are idiosyncratic compared with the other presenters or raters. Values less than 0.50 indicate that these presenters or raters simply have too little variation. The infit mean square value of R1 is 1.10. On the other hand, outfit mean square value of R1 is 1.73, which means there are some unexpected responses. The outfit statistic is useful because it is particularly sensitive to outliers, or extreme unexpected observations (Engelhard & Wind, 2016) . The following is R1’residuals plot using the logit scale. As you can see from the plot, R1 has an extreme score. Because of this, R1 is detected as a misfit [Figure 1].
Further examining R1’s ratings, R1 rated P14’s visuals and content extremely severely, although he rated other presenters leniently, giving most of the domains of the other presenters the highest score 3.
Regarding the misfitting presenter, P14 is a misfit. He was a very funny person in class. He was actively engaged in his presentation; however, he forgot to bring his USB and his visuals were poor. Since six raters gave bad scores on his visuals, he is detected as a misfit. This may be strange, but the peer raters often assessed their peers leniently, but they assessed P14’s visuals severely, which caused misfit to the Rasch model.
From a pedagogical point of view, all student presentations must be evaluated because they are a graded class presentation regardless of their degree of fit to the Rasch model; on the other hand, when it has been determined that some student raters did not assess the presentations seriously or did not meet the expectations of the Rasch model, their ratings can be justifiably eliminated in order to improve the precision of the ability estimates. Therefore, one misfitting presenter is included and one rater is eliminated in the further analysis.
3.4. The Results
3.4.1. Summary Statistics
The following is the summary statistics of the multifaceted Rasch measurement [Table 1].
In this table, all of the presenters, raters, and domains seem to be acceptable because they are in the acceptable range between 0.5 and 1.5 of infit and outfit mean square statistics.
The reliability of separation statistic indicates how well individual elements
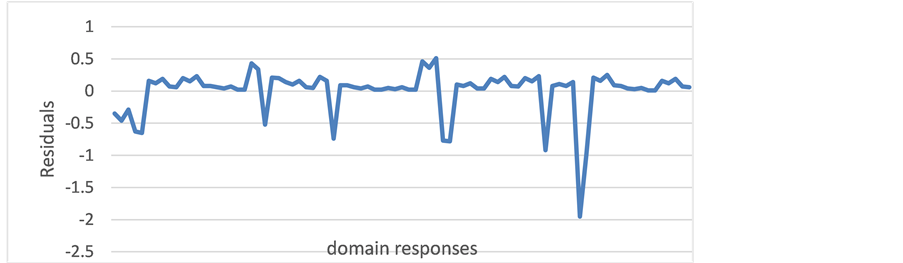
Figure 1. R1 residual response plot.

Table 1. Summary statistics.
within a facet can be differentiated from one another. In addition, a chi square statistic determines whether the element within a facet can be exchangeable. As can be seen in the table, the overall differences between elements within the presenter, rater, and domain facets are significant, based on the chi-square statistics (p < 0.05). The reliability of separation for presenters is quite high. This finding of a high reliability of separation statistic for presenters suggests that there are reliable differences in the judged locations of each presenter’s ability on the logit scale. For the raters, a high reliability of separation statistic was observed for raters (0.94), which suggest that there are significant differences among the individual raters in terms of severity. This is not ideal for raters; however, this is often the case in real classroom settings. In addition, domains are significantly different, which suggests the difficulty of the domains is different.
3.4.2. The Rater’s Measurement Report
The following is the detailed rater’s measurement report [Table 2].
From the left, each column shows rater ID’s, rater severity, error, infit mean square values, and outfit mean square values. As mentioned earlier, mean square values of 0.5 to 1.5 are utilized. After eliminating the one rater (R1), no rater is identified as misfits. This indicates that the raters are self-consistent across writers and domains, which is a good sign to use peer assessment as an additional assessment in class.
3.4.3. The FACETS Map
The following figure [Figure 2] is the Facet map. The first column is the logit scale
Table 2. The rater’s measurement report.
that represents presentation achievement. As mentioned earlier, the logit scale is a true interval scale. The next three columns display the logit-scale locations for the three facets: presenters, raters, and domains. In order to interpret the logit-scale locations of the three facets, raters and domains are centered at zero (mean set to zero), and only the average location of the presenter facet is allowed to vary. The second column displays the presenter locations (n = 18). As can be seen in the map, many of the presenters are located in the upper part of the map, which suggests that the presenters often obtain good ratings on their presentations. This is because the presenters who are located higher on the logit scale receive higher ratings, and the presenters who are located lower on the logit scale receive lower ratings. The third column shows raters’ severity locations; the raters who are located higher on the logit scale are more severe; that is, they assign lower ratings more often. The raters who are located lower on the logit scale are less severe; that is, they assign higher ratings more often. As can be seen, many raters are quite lenient since they are below 0.00 logit. Finally, the locations of the domains on the logit scale reflect the difficulty. The domains that are located higher on the logit scale are associated with more severe ratings, and the domains that are located lower on the logit scale are associated with less severe ratings. In this map, gesture & voice inflection is the most severely rated because it obtains severe scores and content and visuals are the least severely rated since they obtain lenient scores. The last column shows each point on the 3-point rating scale used in this analysis.

Figure 2. The FACET map.
3.4.4. Unexpected Responses
The following unexpected responses were detected by the FACET analysis [Table 3].
As can be seen in the table, most of the unexpected responses are related to visuals. As mentioned in the initial analysis, P14 was evaluated unexpectedly lower on the visuals. R17 rated P4’s content low. When checking his comments, it was found that he felt that P4’s content did not include enough information. On the other hand, P9’s content evaluated by R16 did not fit Rasch’s expectation, but his comments were related to the gesture but not the content, so why P9’s content evaluated by R16 did not fit Rasch’s expectation is unknown. R17 rated P3’s posture lower than Rasch expectation, and his comments revealed that P3 moved his body too much, which made the score of posture low. These unexpected responses are fairly few because the total responses were 1530. Out of 1530, only 10 responses are unexpected, which may be a good sign to use peer assessment as additional assessment.
3.5. Pedagogical Implications
Although students often assess their peers leniently, we still can see the location of presenters’ abilities in the FACETS map. In fact, according to peer and teacher’s assessments, P16 gave the best presentation in class, which was consistent to what the teacher felt. Moreover, the result that P1 gave the worst presentation was also consistent to the teacher’s reaction. Using the Multifaceted Rasch analysis, teachers may confirm or modify their ratings, which is probably beneficial in classroom setting. Since only one teacher rating all the presenters could fall in danger, it may be necessary to use peer assessment as additional assessment. In this study, the teacher rater is lenient as well as peer raters, since her logit is below 0.00 logit. The presenters probably followed what the teacher explained in class and conducted good presentations. On the other hand, although in this study, using the three successive classes, students were taught what each domain is and how to rate peers’ presentations thoroughly, if they had had more time to practice rating, their ratings could have been improved more. Especially, in this
Table 3. Unexpected responses.
study, how to rate visuals and content should have been explained more thoroughly. Since the students did not have enough skills to evaluate those domains, they had some unexpected responses. After giving some time to practice their ratings and after eliminating misfitting raters, using Mutifacted Rasch analysis may be a good choice. Teachers may compare their assessments with those of peer assessments. They also can check the students’ comments, which may help them understand why the students assign their scores. Those proceedings could make teachers’ assessment be in good quality. As much as they can, they should try to improve the quality of their assessment.
Cite this paper
Matsuno, S. (2017). Adoptability of Peer Assessment in ESL Class- room. Creative Education, 8, 1292-1301. https://doi.org/10.4236/ce.2017.88091
References
- 1. Anderson, R. S. (1998). Why Talk about Different Ways to Grade? The Shift from Traditional Assessment to Alternative Assessment. 7 New Directions for Teaching and Learning, 4, 6-16. [Paper reference 2]
- 2. Brown, D. (2004). Language Assessment: Principles and Classroom Practice. New York: Longman. [Paper reference 2]
- 3. Cheng, W., & Warren, M. (1999). Peer and Teacher Assessment of the Oral and Written Tasks of a Group Project. Assessment & Evaluation in Higher Education, 24, 301-314. https://doi.org/10.1080/0260293990240304 [Paper reference 2]
- 4. Domingo, J., Martinez, H., Gomariz, S., & Gamiz, J. (2014). Some Limits in Peer Assessment. Journal of Technology and Science Education, 4, 12-24. [Paper reference 1]
- 5. Engelhard, G., & Winds, S. A. (2016). Exploring the Effects of Rater Linking Designs and Rater Fit on Achievement Estimates within the Context of Music Performance Assessment. Educational Assessment, 21, 278-299. https://doi.org/10.1080/10627197.2016.1236676 [Paper reference 2]
- 6. Harrington, D., & LeBeau, C. (2009). Speaking of Speech. Tokyo: Macmillan Language House. [Paper reference 1]
- 7. Jafarpur, A. (1991). Can Naive EFL Learners Estimate Their Own Proficiency? Evaluation and Research in Education, 5, 145-157. https://doi.org/10.1080/09500799109533306 [Paper reference 1]
- 8. Jones, I., & Alcock, L. (2014). Peer Assessment without Assessment Criteria. Studies in Higher Education, 39, 1774-1787. https://doi.org/10.1080/03075079.2013.821974 [Paper reference 1]
- 9. Li, L. (2017). The Role of Anonymity in Peer Assessment. Assessment & Evaluation in Higher Education, 42, 645-656. https://doi.org/10.1080/02602938.2016.1174766 [Paper reference 2]
- 10. Linacre, J. M. (2012). Many-Facet Rasch Measurement: Facets Tutorial. http://winsteps.com/tutorials.htm [Paper reference 2]
- 11. Linacre, J. M. (2017). FACETS: Computer Program for Many Faceted Rasch Measurement (Version 3.80.0). Chicago, IL: Mesa Press. [Paper reference 1]
- 12. Liu, X., & Li, L. (2014). Assessment Training Effects on Student Assessment Skills and Task Performance in a Technology-Facilitated Peer Assessment. Assessment & Evaluation in Higher Education, 39, 275-292. https://doi.org/10.1080/02602938.2013.823540 [Paper reference 2]
- 13. Matsuno, S. (2009). Self- , Peer- , and Teacher-Assessments in Japanese University EFL Writing Classrooms. Language Testing, 26, 75-100. https://doi.org/10.1177/0265532208097337 [Paper reference 1]
- 14. Patri, M. (2002). The Influence of Peer Feedback on Self- and Peer-Assessment of Oral Skills. Language Testing, 19, 109-131. https://doi.org/10.1191/0265532202lt224oa [Paper reference 1]
- 15. Pope, N. (2001). An Examination of the Use of Peer Rating for Formative Assessment in the Context of the Theory of Consumption Values. Assessment & Evaluation in Higher Education, 26, 235-246. https://doi.org/10.1080/02602930120052396 [Paper reference 3]
- 16. Saito, H. (2008). EFL Classroom Peer Assessment: Training Effects on Rating and Commenting. Language Testing, 25, 553-581. https://doi.org/10.1177/0265532208094276 [Paper reference 1]
- 17. Saito, H., & Fujita, T. (2004). Characteristics and User Acceptance of Peer Rating in EFL Writing Classrooms. Language Teaching, 8, 31-54. https://doi.org/10.1191/1362168804lr133oa [Paper reference 1]