Energy and Power Engineering
Vol. 5 No. 1 (2013) , Article ID: 26443 , 11 pages DOI:10.4236/epe.2013.51008
Simulation of Power Flow and Protection of a Limited Bus Grid System with Injected Solar Power
Department of Electrical and Computer Engineering, Curtin University Sarawak, Miri, Malaysia
Email: nader.b@curtin.edu.my
Received October 29, 2012; revised November 30, 2012; accepted December 14, 2012
Keywords: Grid Systems; Solar Power; Overvoltage; Overcurrent Relay; Bi-Directional Inverter; Relay Current Setting
ABSTRACT
In recent years, injection of renewable energy such as solar power into the power grid is increasing. However, inclusion of large-scale intermittent-type renewable energy requires better management in proper understanding of grid’s variable characteristics and its protection systems. In this paper, the investigation on overvoltage issue is illustrated. Overvoltage in distribution feeder occurs when large amount of solar power is injected at low power demand. Another investigation is on false operation of overcurrent relays due to reverse power to the 33 kV loads. The potential solutions to the two issues are illustrated in the small-sized power grid system using bi-directional inverters on AC buses in charging battery banks and adjusting the relay current settings. The benefits of solar power injection are illustrated whereby output power from generators is decreased and transmission losses are reduced. Electrical Transient Analysis Program (ETAP) was used for investigations.
1. Introduction
In recent years, many countries have largely deployed renewable technologies and mostly, allow distributed power generation at the low-voltage distribution network [1]. With large-scale emergence of intermittent-type of renewable energy such as solar power on the grid system, it becomes a challenge to the grid operators to properly manage the grid system operation [2]. The load flow parameters and power flow direction on the grid system become more difficult to be predicted. Power flow changes from uni-directional power flow to bi-directional power flow [3]. Based on [4], the current conventional grid system is not ready for large-scale distributed generation.
Under Malaysia’s ninth development plan, renewable energies such as solar power were planned to be included in the grid system [5]. Malaysia is aiming to have minimum of 220 MW of solar power in the composition of energy mix by year 2020 [6]. With proper grid management, large-scale injection of solar power will benefit the grid system. The most promising way to ensure the reliability of the grid system after large-scale integration of on grid solar power is to identify the issues and solutions before implementation.
The power demand from generator is reduced when there is solar power injection in the grid and hence, no additional power station is required to be built [7]. With large-scale injection of solar power, some of the generators such as gas turbine generators can be halted in operation. Reference [8] noted reduction in transmission losses after having solar power in the grid system.
In Malaysia, the allowable three-phase distribution voltage range is in between –6% and +10% of the normal distribution voltage of 400 V [9]. Overvoltage in distribution feeder is possible due to large amount of solar power injection at low power demand. Reference [10] concluded that overvoltage occurs during weekend when the loads are low but large amount of solar power injection on the distribution feeder. Reference [11] suggests implementing large storage devices on the distribution feeder to avoid overvoltage issue. In this paper, usage of bi-directional inverter in [12] in solving the overvoltage issue is discussed where the bi-directional inverter functions as either inverter or converter.
The protection scheme for conventional radial grid system is based on the full load current and the short circuit current at each bus. However, there is now bi-directional power flow in the grid system. Hence, adjustment on the settings of the overcurrent relay is required with reference to the distributed generation [13]. False operation of the grid’s protection system causes the reliability of the grid to be a main concern.
2. System Description
2.1. Grid System and Distribution Feeder
A small 50 Hz grid system of ten buses with overcurrent protection system is constructed in ETAP as in Figure 1. There are three buses at extra high voltage level developed in ring main system. Four transmission lines are developed in which one is transmitting 132 kV while the rests are for 275 kV. The current and power flow simulations are based on Newton-Raphson method. There are two clustered loads of voltage 33 kV and 0.23 kV. A distribution feeder is developed with three buses consisting of single-phase loads as shown in Figure 2.
2.2. Transmission Lines and Underground Cable Parameters
The specifications of the transmission lines in the grid system are tabulated in Table 1 and that of the underground cables in the distribution feeder are shown in Table 2.
2.3. Loads Modelling in Distribution Feeder
The loads of the distribution feeder at different hour of the day as shown in Figure 3 is based on the scaleddown version of real-time power demand of New South Wales on June 28, 2012. Bus 1 and Bus 2 of the distribution feeder has equal amount of loads.
3. Simulation Results and Analysis
Under Heading 3, the reduction of output power from generator and decrease in transmission losses at different level of solar power injection are illustrated. Furthermore, the overvoltage issue due to large-scale injection of solar
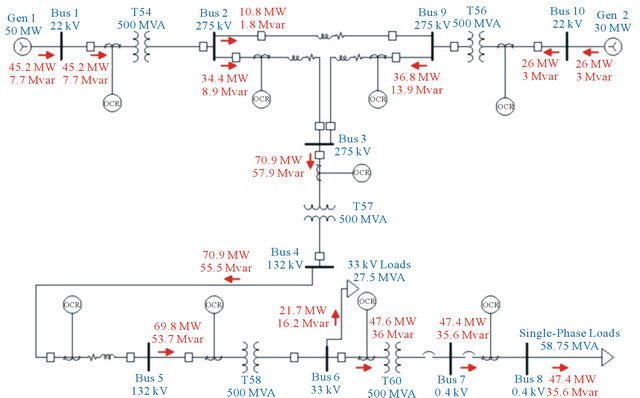
Figure 1. Example of grid system developed in ETAP.
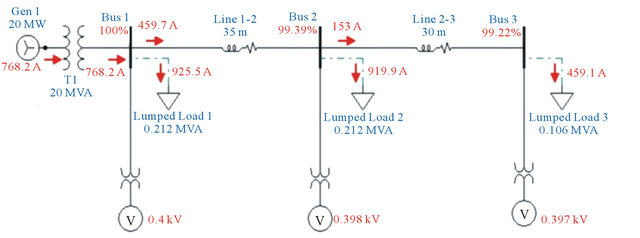
Figure 2. Example of distribution feeder developed in ETAP.
Table 1. Transmission lines parameters.
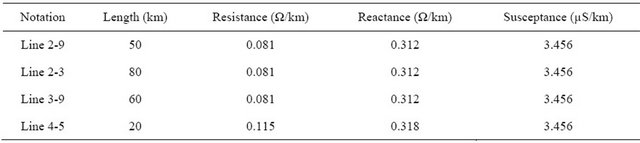
Table 2. Underground cables parameters.
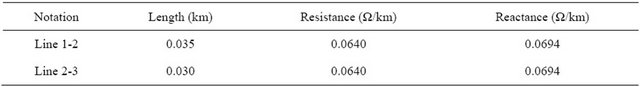
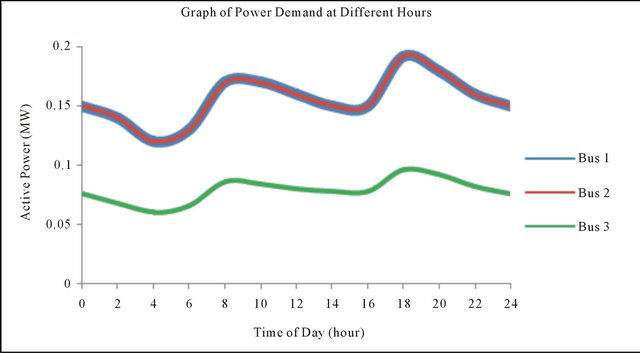
Figure 3. Power demand of each bus in distribution feeder.
power into the distribution feeder at low power demand is illustrated. Next, the false operation of the overcurrent relays due to large amount of reverse power flow to 33 kV bus is also discussed.
3.1. Reduction of Output Power from Generators and Decrease in Transmission Losses
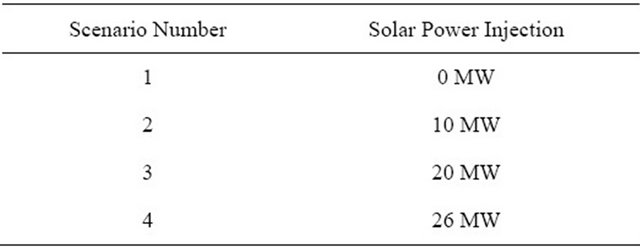
There are two cases which are used in illustrating the decrease in output power of generator when there is solar power injection. The parameters of the power generation and loads are tabulated in Table 3. The solar power injection into the grid system in the first case is shown in Table 4.
In Figure 4, the output power from the swing generator is observed to reduce with the injection of solar power into the grid system. In every scenario, the output power from the swing generator reduces in proportion to the increase in solar power injection. Hence, at similar loadings, some of the gas turbine generators can be halted in operation. This reduces the combustion of fossil fuels and less greenhouse emission to the environment. The curve showing the output power of swing generator as derived in ETAP deviates away from the anticipated curve. The anticipated curve predicts the reduction of output power from swing generator equal to the amount of solar power injection. The deviation between the anticipated curve and the power curve of swing generator is the transmission losses.
Since the anticipated curve parameter is higher than the power curve of the generator, it is concluded that the transmission losses are reduced with solar power injection. Case 2 illustrates in details the reduction in transmission lines losses with increase in solar power injection into the grid system. Figure 4 shows the reduction in
Table 3. Power generation and demands of Case 1.
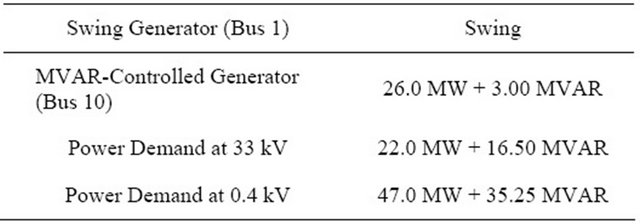
Table 4. Solar power injection of Case 1.
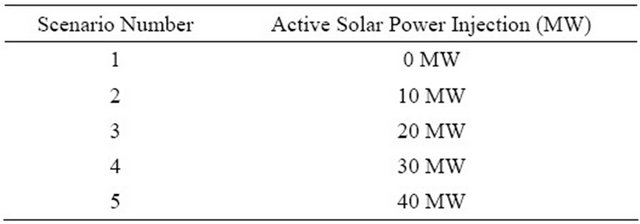
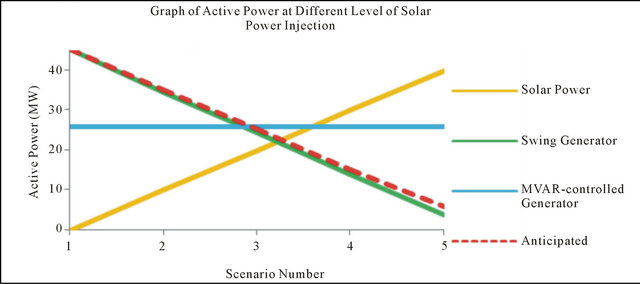
Figure 4. Graph of reduction of output power from generator in proportion to the increase in solar power injection.
output power from swing generator after injection of solar power in different scenarios.
In Case 2, the power generation and demands are the same as in Table 3. However, the generation of MVARcontrolled generator is manually reduced in ETAP based on the exact amount of solar power injection into the grid. Table 5 shows the active solar power injection in different scenario simulated.
Figure 5 shows the output power from the swing generator in Case 2 and the anticipated output power. Figure 6 shows the manual reduction of the output power of MVAR-controlled generator which is inversely proportional to the level of solar power injection into the grid.
It is predicted that by having solar power supplying to the loads, the amount of power output from MVARcontrolled generator can be reduced by the same amount and hence, the swing generator output power will be constant. However, in Case 3, the output power of swing generator is not constant but reduces with increasing solar power injection which is shown in Figure 5. The deviation of the power curve of swing generator and the anticipated curve is explained by the power loss in the transmission lines. With no solar power injection in the grid, the amount of output power from swing generator is equal to the total power demand of the loads and also the power loss in the transmission lines.
With solar power injection into the grid, the power across the tranmission lines is lesser and hence, lesser
Table 5. Solar power injection of Case 2.
transmission losses which lead to less power generation required from the swing generator.
3.2. Overvoltage Issue
With the power demand as shown in Figure 3 for each bus in the distribution feeder, the bus voltage at different hour of the day was obtained through simulation in ETAP. Without solar power injection, the bus voltages are well within the acceptable range of operating voltage at every hour of the day. Figure 7 shows the bus voltages with and without solar power injection in the distribution feeder.
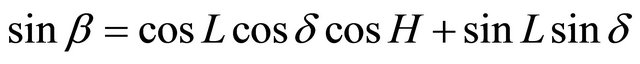
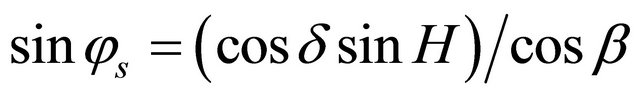
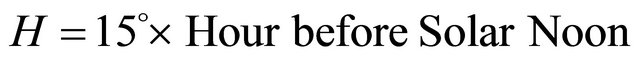
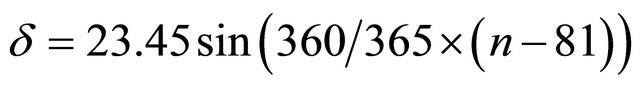
In the first case, the amount of solar power injected to each bus of the distribution feeder is illustrated in Figure 8. The solar power injection in Figure 8 is the scaleddown version of solar power generation at Kalgoorie, Western Australia. Equations (1)-(4) were used in calculating the altitude and azimuth angle.
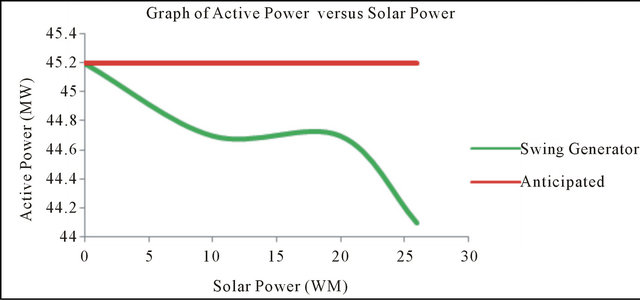
Figure 5. Graph of power from swing generator and the anticipated curve.

Figure 6. Graph of output power of MVAR-controlled generator.
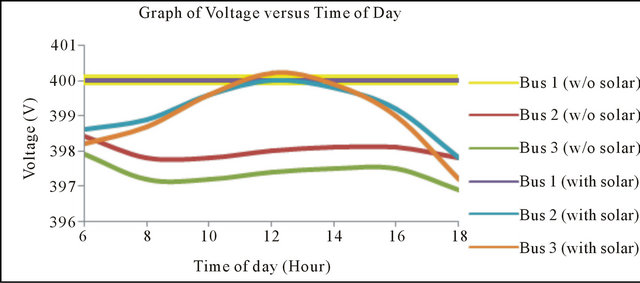
Figure 7. Bus voltages with and without solar power injection.
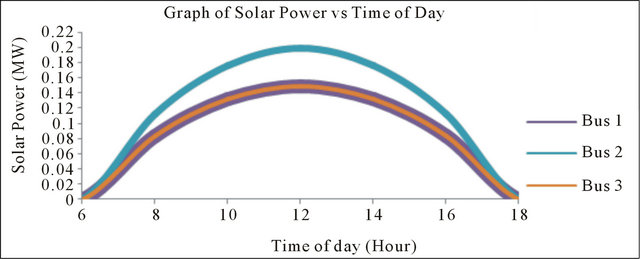
Figure 8. Solar power injection at each bus in Case 1.
 (1)
(1)
 (2)
(2)
 (3)
(3)
 (4)
(4)
where
β = altitude angle,
 = azimuth angleL = latitude,
![]() = solar declination on 21st day of the monthH = hour anglen = first day of each month.
= solar declination on 21st day of the monthH = hour anglen = first day of each month.
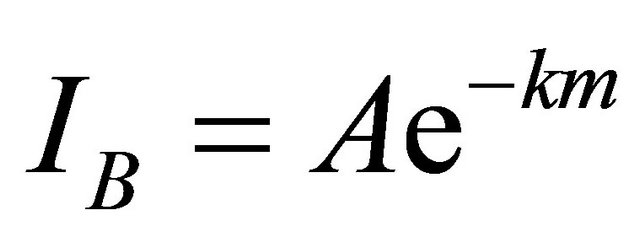
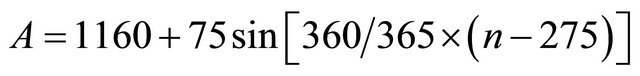
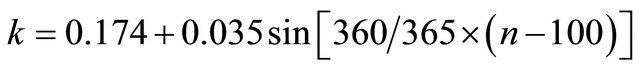
Next, the hourly clear-sky insolation on PV array on 21st day of each month of a year for horizontal collector was calculated using Equations (5)-(12).
 (5)
(5)
 (6)
(6)
 (7)
(7)
 (8)
(8)
 (9)
(9)
 (10)
(10)
 (11)
(11)
 (12)
(12)
where IB = beam of radiationA = “apparent” extraterrestrial fluxk = optical depthm = air-mass indexIBH = direct beam radiation for horizontal collectorβ = altitude angleIDH = diffuse radiation on horizontal collectorC = sky diffuse factorIc = total radiation on collector.
After calculation of the hourly clear sky insolation on the PV array on 21st day of the month, the obtained results were adjusted to practical value using Equation (13).
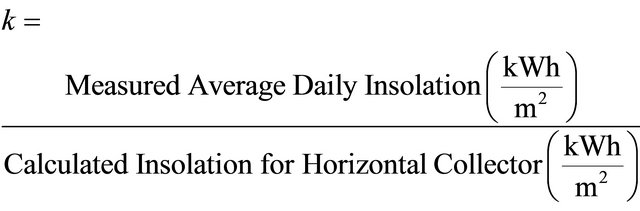 (13)
(13)
The measured average daily insolation is the practical data provided by National Climate Centre, Australia. In January, the measured average daily insolation is 7.861 kWh/m2.
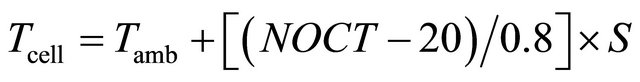
Next, the total clear sky insolation was multiplied by the value of k. The area of the module was assumed. The total power at terminals and the power loss in each degree rise in temperature were calculated using Equations (14)-(16).
 (14)
(14)
 (15)
(15)
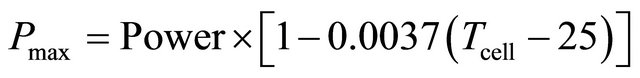 (16)
(16)
where Tamb = 33.7˚C (assumed for January)NOCT = Nominal Operating Cell Temperature = 45˚CS = 1 kW/m2.
The power loss due to dirt and mismatch for horizontal collector was determined using Equations (17) and (18) calculated the final maximum power.
 (17)
(17)
 (18)
(18)
Based on the total final maximum power determined for every hour of the day in January, the results were scaled down and shown in Figure 8.
The bus voltages after injection of solar power, as shown in Figure 7, illustrate a rise in the bus voltages. However, the bus voltages remain within the acceptable range and demonstrates a better voltage regulation compared to when there is no solar power injection into the distribution feeder.
In the second case, the solar power injection of Bus 1 and Bus 2 remain constant. As for Bus 3, there is a large increase in solar power injection as shown in Figure 9.
The third case is the amount of solar power injection of all buses are scaled by factor of 18 of Case 1. The operating bus voltages were measured in ETAP and shown in Figures 10 and 11 respectively for Case 2 and 3.
In both Case 2 and Case 3, it is observed that the voltage at Bus 3 in between 11:30 am to 12:30 pm has increased to more than the maximum allowable voltage of 440 V. Both cases illustrate the overvoltage issue due to large-scale solar power injection at low power demand.
3.3. False Operation of Overcurrent Protection Systems
In uni-directional power flow grid system, the protection systems are set by considering the full load current associated with each relay and the time discrimination of the
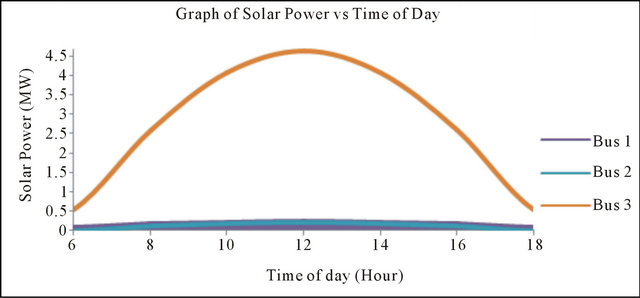
Figure 9. Solar power injection at each bus in Case 2.
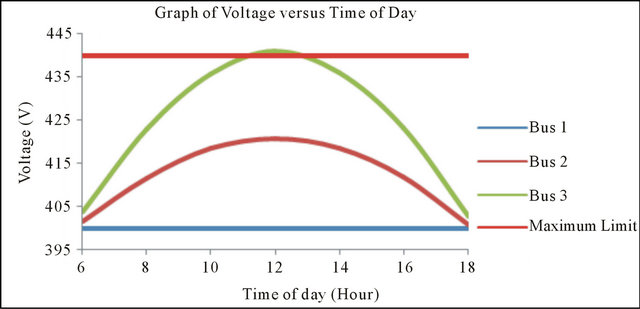
Figure 10. Operating bus voltages of Case 2.
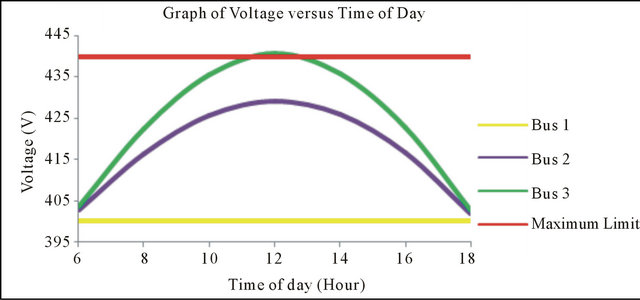
Figure 11. Operating bus voltages of Case 3.
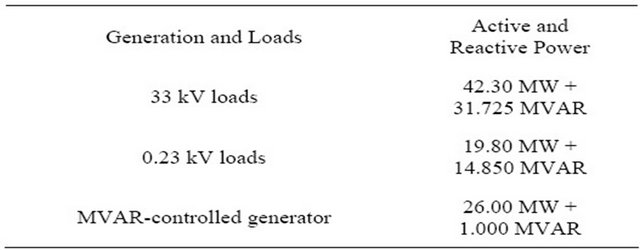
relays. In simulating Case 1 which different amount of solar power is injected into the grid, the loads and MVAR-controlled generation of Case 1 are as shown in Table 6.
Figure 12 shows an example scenario where the reverse power flows from 0.4 kV bus to 33 kV bus in supplying of power to the loads at 33 kV due to injection of large amount of solar power at the 0.4 kV bus. The figure also includes the location of the two affected relays, Relay 33 and 11.
Table 6. Power generation and demands of Case 1.
Figures 13 and 14 illustrate the amount of current flowing through the primary side of the current transformer associated to Relay 33 and 11 respectively and their respective relay pickup current.
At active solar power injection of 45 MW and above, the current flowing through the primary side of current transformer associated with Relay 11 and 33 exceeds the pickup current. This is as shown in Figures 13 and 14 respectively. The loads at 0.4 kV bus is lesser than that of in 33 kV bus. In conventional grid system, the pickup current is set to meet the full load current of the lesser low-voltage loads and the associated fault current.
Hence, large amount of solar power injection into the grid and reverse power in supplying to 33 kV loads has possibility of exceeding the pickup current of the relays.
Under this condition, there is no reverse power flow to the generator but circuit breaker is tripped as signaled by either Relay 33 or Relay 11. Hence, at active solar power injection of 45 MW and above, there is false operation of overcurrent protection system which is designed for uni-directional power flow grid system.
4. Potential Solutions
Having illustrated the overvoltage issue and false operation of overcurrent protection systems due to large amount of solar power injection, there are several solutions which are applicable to avoid the issues before implementation of the renewable energies on the grid. However, only one potential solution to each issue is illustrated in this paper.
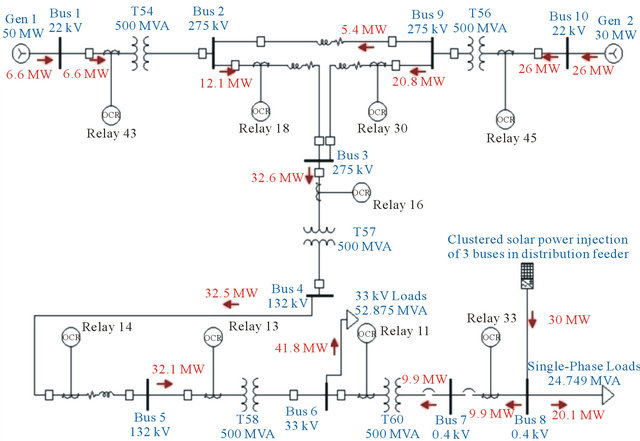
Figure 12. Grid system showing reverse power flow to 33 kV loads.
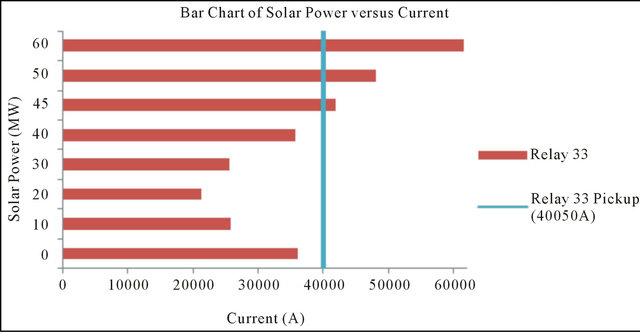
Figure 13. Current at primary side of CT of Relay 33 and its pickup current.
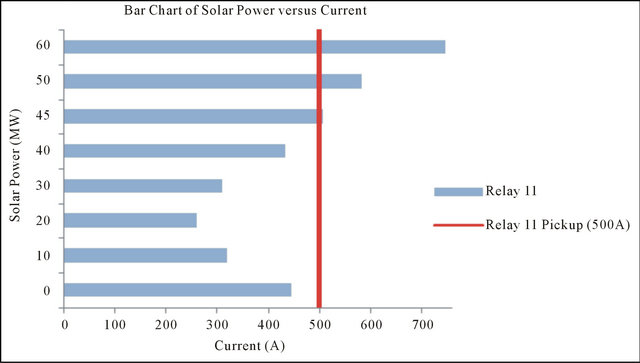
Figure 14. Current at primary side of CT of Relay 11 and its pickup current.
4.1. Overvoltage Issue
In solving the overvoltage issue without reducing the amount of solar power injection at the low-voltage network, one potential solution is to use bi-directional inverters in interfacing the battery banks with the buses in the distribution feeder. The bi-directional inverters and battery banks are to be installed by the grid operator to ensure the bus voltages are within the acceptable range.
In ETAP, the bi-directional inverter is illustrated using an inverter and a charger with combination to a double-throw switch. In between 10 am to 4 pm, the solar power injection in the distribution feeder is high but low power demand. Hence, at this time interval, the bi-directional inverter works as a charger, taking portion of the power from the AC buses and charging the battery banks. During night time, the bi-directional inverter works as an inverter, converting DC power of the battery banks to supply to AC buses for the loads. The charging mode of the bi-directional inverter is shown in Figure 15.
The parameters of the single battery bank used in ETAP are shown in Table 7.
By charging the battery banks using bi-directional inverter from 10 am to 4 pm, the new bus voltages measured in ETAP remain in the acceptable range. The resulted new bus voltages are as tabulated in Table 8.
4.2. False Operation of Overcurrent Protection Systems
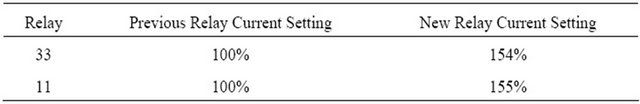
In order to mitigate the risk of false operation of Relay 33 and Relay 11 due to reverse power flow to 33 kV bus under normal grid condition, the relay current settings are adjusted based on the maximum bi-directional current flow across the primary side of the associated current transformer, whichever direction where the current is greater. Considering the maximum active solar power injection is 60 MW, the new relay current settings are tabulated in Table 9 with comparison to the previous relay current settings.
Hence, the pickup current of Relay 11 and 33 are increased. With the new pickup current, Relay 33 and 11 will not operate at maximum active solar power injection of 60 MW. Hence, there is no possibility of false tripping due to reverse power flow to 33 kV loads. However, all relays have to be re-graded to ensure of the correct operation time during fault.
5. Conclusion
In conclusion, solar power injection reduces the output power from generators and decreases the transmission losses. Governments encourage solar power injection to reduce the greenhouse emission to the environment through less power generation from the power stations. However, overvoltage in distribution feeder due to solar power injection is to be avoided. The potential solution is to interface battery banks with the distribution feeder using bi-directional inverters without reducing the amount of solar power at the low-voltage network. Another issue is false operation of overcurrent protection system. This issue can be mitigated by adjusting the relay current setting and the pickup current of the relays which experience bi-directional power flow. The adjustment of the relay current setting is based on the maximum current flowing across the current transformers in both directions. However, all relays have to be re-graded to ensure correct operation time during fault. In consumers’ perspective, solar power injection reduces their electricity bill
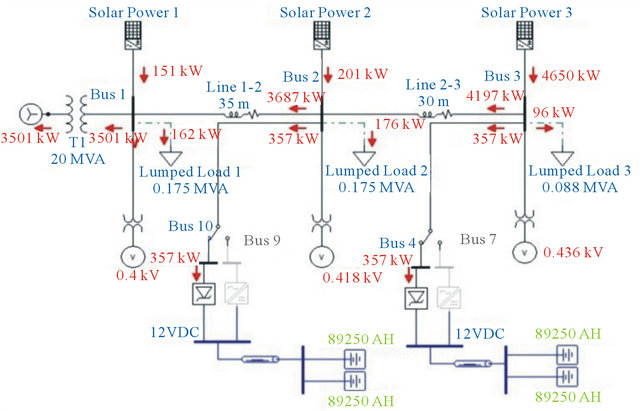
Figure 15. Charging mode of bi-directional inverter.
Table 7. Specifications of the battery bank.
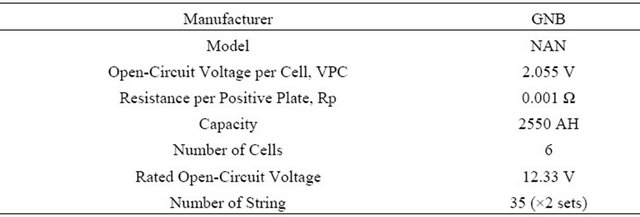
Table 8. New bus voltages after addition of battery banks.
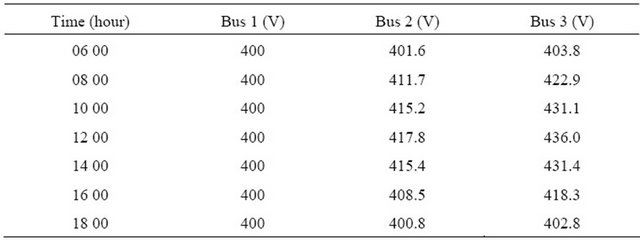
Table 9. Relay current setting of Relay 33 and Relay 11.
and at the same time, assists in reducing the power demand from generators and decrease the transmission losses.
REFERENCES
- T. Degner, G. Arnold, et al., “Increasing the PhotovoltaicSystem Housing Capacity of Low Voltage Distribution Networks,” Proceedings of 21st International Conference on Electricity Distribution, Frankfurt, 6-9 June 2011, pp. 1243-1246.
- G. Bartels, “Combating Smart Grid Vulnerabilities,” Journal of Energy Security, 2011. http://www.ensec.org/index.php?option=com_content&view=article&id=284:combating-smart-grid-vulnerabilities&catid=114:content0211&Itemid=374
- X. Fang, S. Misra, et al., “Smart Grid—The New and Improved Power Grid: A Survey,” IEEE Communications Survey and Tutorials (COMST), Vol. 1, 2011, pp. 1-38.
- R. Bartlett, “Encouraging Grid Security with Distributed Generation,” 2012. http://www.ourenergypolicy.org/encouraging-grid-security-with-distributed-generation/
- H. Hashim and S. H. Wai, “Renewable Energy Policies and Initiatives for a Sustainable Energy Future in Malaysia,” Renewable and Sustainable Energy Reviews, Vol. 15, 2011, pp. 4780-4787. doi:10.1016/j.rser.2011.07.073
- Ministry of Energy, Green Technology and Water, “Oil, Gas and Energy,” ETP Annual Report, 2011.
- P. Denholm and M. Mehos, “Enabling Greater Penetration of Solar Power via the Use of CSP with Thermal Energy Storage,” US Department of Energy, 2011, pp. 5-25. doi:10.2172/1030440
- T. V. Ramachandra, R. Jain and G. Krishnadas, “Hotspots of Solar Potential in India,” Renewable and Sustainable Energy Reviews, Vol. 15, No. 1, 2011, pp. 3178-3186. doi:10.1016/j.rser.2011.04.007
- S. Tenaga, “Guidelines for Electrical Wiring in Residential Buildings,” Suruhanjaya Tenaga, Putrajaya, 2008, p. 6.
- Y. Ueda, et al., “Detailed Performance Analyses Results of Grid-Connected Clustered PV Systems in Japan—First 200 Systems Results of Demonstrative Research on Clustered PV Systems,” Proceedings of 20th European Photovoltaic Solar Energy Conference Proceedings, Barcelona, 6-10 June 2005, pp. 2466-2469.
- S. Ali, N. Pearsall, et al., “Impact of High Penetration Level of Grid-Connected Photovoltaic Systems on the UK Low Voltage Distribution Network,” International Conference on Renewable Energies and Power Quality, Santiago de Compostela, 28-30 March 2012, pp. 1-4.
- D. Trowler and B. Whitaker, “Bi-Directional Inverter and Energy Storage System,” Texas Instruments, Arkansas, 2008, pp. 1-29.
- F. M. Combrink and P. T. M. Vaessen, “Low Voltage, but High Tension,” Electrical Power Quality and Utilisation, Vol. 2, 2006, pp. 21-25.