World Journal of Condensed Matter Physics
Vol.2 No.2(2012), Article ID:19092,5 pages DOI:10.4236/wjcmp.2012.22016
Domain Wall Width in Different Ferroelectrics via Perturbation Route
![]()
1Department of Electrical Engineering & Computer Science, University of Toledo, Toledo, USA; 2Department of Materials Science, Pennsylvania State University, University Park, USA; 3Department of Materials Science and Engineering, University of Florida, Gainesville, USA; 4Dumkal Institute of Engineering and Technology, West Bengal University of Technology, Dumkal, India; 5Department of Mathematics, Government College of Engineering & Leather Technology, Kolkata, India.
Email: asisbanerjee1000@yahoo.co.in
Received December 2nd, 2011; revised February 21st, 2012; accepted February 28th, 2012
Keywords: Ferroelectrics; Domain Width; Impurity Effect; Poling Field
ABSTRACT
The domains are of fundamental interest for engineering a ferroelectric material. The domain wall and its width control the ferroelectric behavior to a great extent. The stability of polarization in the context of Landau-Ginzburg free energy functional has been worked out in a previous work by a perturbation approach, where two limits of domain wall width were estimated within the stability zone and they were also found to correspond well with the data on lithium niobate and lithium tantalate. In the present work, it is shown that this model is valid for a wide range of ferroelectric materials and also for a given ferroelectric, such as lithium niobate with different levels of impurities, which are known to affect the domain wall width.
1. Introduction
Below Curie temperature, the ferroelectricity is a very important property in solids that arises in certain crystals in terms of spontaneous polarization [1]. The ferroelectric behavior is commonly explained by the rotation of domains and domain walls that are present in the crystal with uniform polarization [2-4], which is non-linear in terms of hysteresis of polarization (P) and the electric field (E) vectors. In Ref. [4], we used the Landau-Ginzburg free energy (G) functional to explain this interesting behavior by giving perturbations on P, E and G (at the center of the domain wall, termed as x0) by taking the spatial variation of these parameters in terms of ordinary differential equations. This was based on a static soliton solution of Lines and Glass [5]. By treating it as an eigenvalue problem, the critical values of non-dimensional polarization (Pc) were found within the zone of stability through a linear Jacobian transformation. These values were estimated to lie between 1 and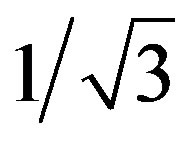 , which also showed the possibility of a large memory. The corresponding limits of half the domain wall width, i.e. higher limit at non-dimensional
 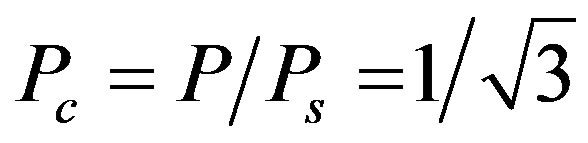 and lower limit at Pc = 1 (i.e. P = Ps) were also found in the case of lithium tantalate and lithium niobate ferroelectric crystals, whose switching and hysteresis behavior have been extensively studied [2,6]. While a lot of work has been done on domain wall and estimation of its half width, not much work has been done on the stability aspect [4] and on the dynamic behavior of the ferroelectric materials [7].
In ferroelectrics literature, the width of the domain walls has been very controversial, with many authors claiming that the walls are very wide. The pioneering work of Zhirnov, Vanderbilt et al., Yacoby et al. and Roytburd are mentioned in Ref. [7]. It is worth noting that an extensive first principle calculation by Vanderbilt group [8,9] (see the references therein) showed that this apparent width results instead from time-averaging data, which are based on rather wide spatial excursions taken by such domain walls.
It is quite pertinent to mention that the first principle calculations have not established a stability zone for polarization in a given ferroelectric, due to various assumptions involved in such study and uncertainty due to correct estimate of born effective charge, as pointed out by Vanderbilt [9]. Moreover, there is a wide difference of values between those calculated by such studies (»0.5 nm) and the powerful experiments by HRTEM images and other means (from about 1.5 - 2.1 nm up to about 4 - 6 nm) [10] (see the other references therein). Yacoby group has done an extensive work on phase transitions in ferroelectric materials through temperature dependence of the wall widths [11] (also see the references therein) in terms of a phenomenological model that quantitatively accounts for both displacive type and order-disorder type properties of pervoskites, and also by Roytburd [12]. In an impressive study by Bhattacharya and co-workers on the evolution of domain pattern involving electrostatic potential, a relation was developed between domain switching and electromechanical actuation [13,14] (see the references therein). Landis and co-workers [15] also did an interesting work on the evolution of domain structures from the continuum thermodynamic framework taking a phase-field modeling approach. In Ref. [4], a stability zone was found out by giving perturbation in the middle of the domain wall and a simple equation was derived for the domain wall width, which shows a relation with impurity contents in the ferroelectrics. Recently, Floquet and Valot did some XRD work on barium titanate and related the presence of twin walls with different concentrations of point defects [16]. In the literature, there is too much discussion on impurity effect on the domain formation and domain wall width, but it does not seem to be quite an easy task [3,17-19].
Without going into a debate on the merits of first principle studies and different experimental data, it can be safely said that a theoretical model must have a wider validity in terms of its applicability for a wider class of ferroelectrics with various preparation techniques and even with different measurement procedures. Moreover, the motivation of the present effort is to emphasize on various uncertainties that can be tackled if we assume a perturbation model, i.e. fluctuations in different concerned variables that are used to describe ferroelectricity in terms of some so-called “material parameters” such as saturation polarization (Ps) in C/m2 and coercive field (Ec) in kV/cm.
The basic formulations of this paper can be found out in Ref. [4] wherefrom Equation (26b) we get.
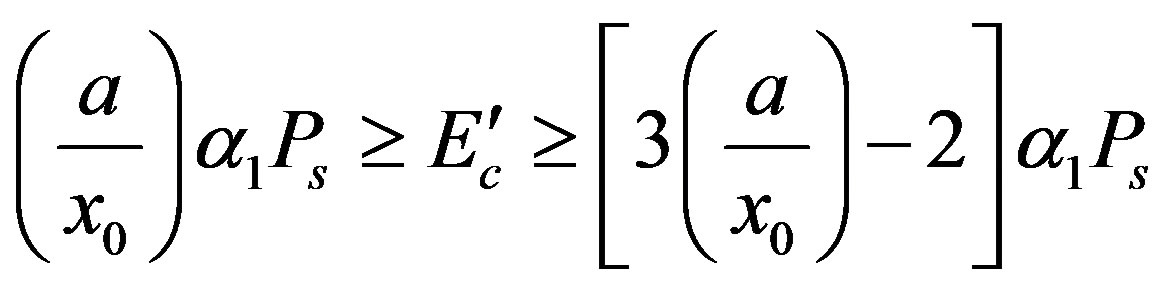 (1)
(1)
Solving the left hand and right hand inequalities for x0 gives the criterion for upper and lower limit of domain wall width as XL and XU. Thus, within the zone of stability, the lower and upper limits of half the domain wall width (XL and XU) were found as:
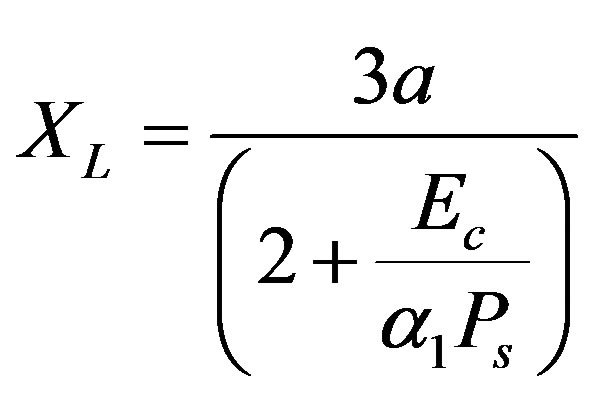 (2)
(2)
 (3)
(3)
when the non-dimensional Pc values are 1 and  respectively. The first value of Pc seems to refer to the most “stable situation” (i.e. an equilibrium situation) and the second one indicates the “limit of stability” in the P vs. E hysteresis diagram [4]. Here, a is the lattice spacing in nm, a1 is the first coefficient of the Landau-Ginzburg polynomial in m/F that is calculated from the dielectric data (e33), and the other terms have their usual meaning.
It is noteworthy that after the zone of stability, the system becomes chaotic. The temporal chaotic dynamics has been studied in details in Ref. [7]. Similar kind of work in the spatial regime is subject of our future work. On the issue of minimization of energy, it should be mentioned that after getting the eigenvalues from Equation (17), Equation (21) and Equation (22) were derived in Ref. [4], which in turn gives the above inequality Equation (26) incorporating the critical polarization value Pc [4]. In this way the fundamental minimum energy condition is implemented in deriving XL and XU. As we are dealing with the system without any interaction, so the treatment done here is for a single domain, and then in other studies, as in Ref. [20] and Ref. [21], we also considered the many body dynamics of such systems with an interaction constant. Hence, the study done here is only for local energy criterion, which has also got a global appeal. It should also be indicated that our formulations are based on non-dimensional terms, and as the driving field (E) in Ref. [4] contains the coercive field term (Ec), which in turn is related to the impurity content [17,21].
Our preliminary estimate of the “half width” of such domain walls for only one crystal data of near-stoichiometric lithium niobate (LN) and lithium tantalate (LT) showed that the lower limit corresponds well with the result of Padilla et al. [8] and the higher limit agrees well with that found by Gopalan et al. [2]. The present work was undertaken to see the validity of these equations, based on a continuum model of Landau-Ginzburg, on both LN and LT crystals with a wider variety of impurity contents (read Ec values). Moreover, wherever the material parameters such as Ps and Ec are known from a voluminous literature on the subject, the above equations were also used for those materials for the same objective.
2. Results and Discussion
It should be mentioned that the conventional solutions for the domains can also be tackled by variational problem by taking care of many terms in the Hamiltonian [20]. Furthermore, the study carried out by Vanderbilt et al. [8,9] and Gopalan et al. [2] show the domain size by ab-initio calculation and experimental techniques respectively. In our case, we do such calculations by a well-known method such as perturbation technique. This is a very important point in this paper. So, our perturbation approach not only bench-marks the problem, but also shows a good correspondence with the values obtained by the above two methods in terms of easier calculations and much realistic value. Although in Ref. [4], the model has been presented for single domain i.e. with zero dipole-dipole and other interactions, this kind of treatment may also be found in Ref. [20].
The coercive field data with different impurity contents for LN crystals have been collected from Ref. [17], wherein a lot of data from Gopalan et al. [19] are also included, and those for LT crystals are taken from Tian et al. [2,18]. The values of saturation polarization have been made to vary linearly between the two extremes, since they do not seem to show significant variations with impurity content. Although a table is not shown here with the relevant data, these data are available in the above literature, particularly in Ref. [19].
For both these cases, it is seen that irrespective of the impurity content (read, different Ec values), the lower limit of “half the domain wall width” (DWW) is remarkably constant at 0.74 - 0.77 nm, which is just about 1.5 times the lattice spacing of these crystals (i.e. 3 times the lattice spacing for the “full width”, (see Zhirnov et al. in Ref. [7])). Since, this represents the most stable situation, it can be said that in the lower limit, the DWW will vary between 1 - 2 lattice spacing and the observed value might result from a time-averaging mechanism, as explained in the Section 1. As will be shown below, this is also true for a wider class of ferroelectric materials. Whatever may be the “averaging” mechanism, it can be stated that the lower limits of DWW will not go below or above 1.5 times the lattice spacing that are based on the experimental data.
The upper limit of half of DWW shows a large variation with the experimental impurity content or coercive field data. It is quite interesting to plot these values of XU against impurity content, as shown in Figure 1. This upper limit falls sharply up to a particular impurity content (0.133 mol%) that corresponds to an Ec value equal to 40 kV/cm for LN crystals, and then it decreases asymptotically towards the congruent side. This is the most interesting observation in that Gopalan et al. found it relatively easier to work in this zone for the hysteresis study with an appropriate thickness of the sample [2,6,21].
The data for LT crystals with lower Ec values (1.61, 13.9, 17 and 210 kV/cm respectively) than those of LN crystals are not plotted here due to the paucity of the data in the intermediate range and also due to the lack of precision of the impurity contents, but they show the same trend as that of LN crystals when plotted against Ec values. Qualitatively speaking, the lower values of XU for LT crystals (2213, 257, 211 and 19 nm respectively) show their relative usefulness as non-linear optical materials from the application point of view [19].
We have also analyzed 7 more ferroelectric crystals with a wider variety of chemical and physical characteristics with important implications for non-linear optical and other applications. However, it has been observed that here again the lower limit of DWW (XL) is almost constant at 1.810 - 1.883 nm and it is equal to about 1.5 (1.454 - 1.499) times the lattice spacing (i.e. again the “full width” is found to be equal to 3 times the lattice spacing). At the outset, these data encompass quite a wide range of ferroelectric materials, where our perturbation model for estimating DWW seems to be valid, obviously assuming that the L-G equation is valid for all such crystals. However, the question can be raised about samarium and calcium doped lead titanates and barium titanate that are not included in our analysis since these data do not fall in the smooth curve of Figure 2, these materials are known to undergo a first order phase transition.
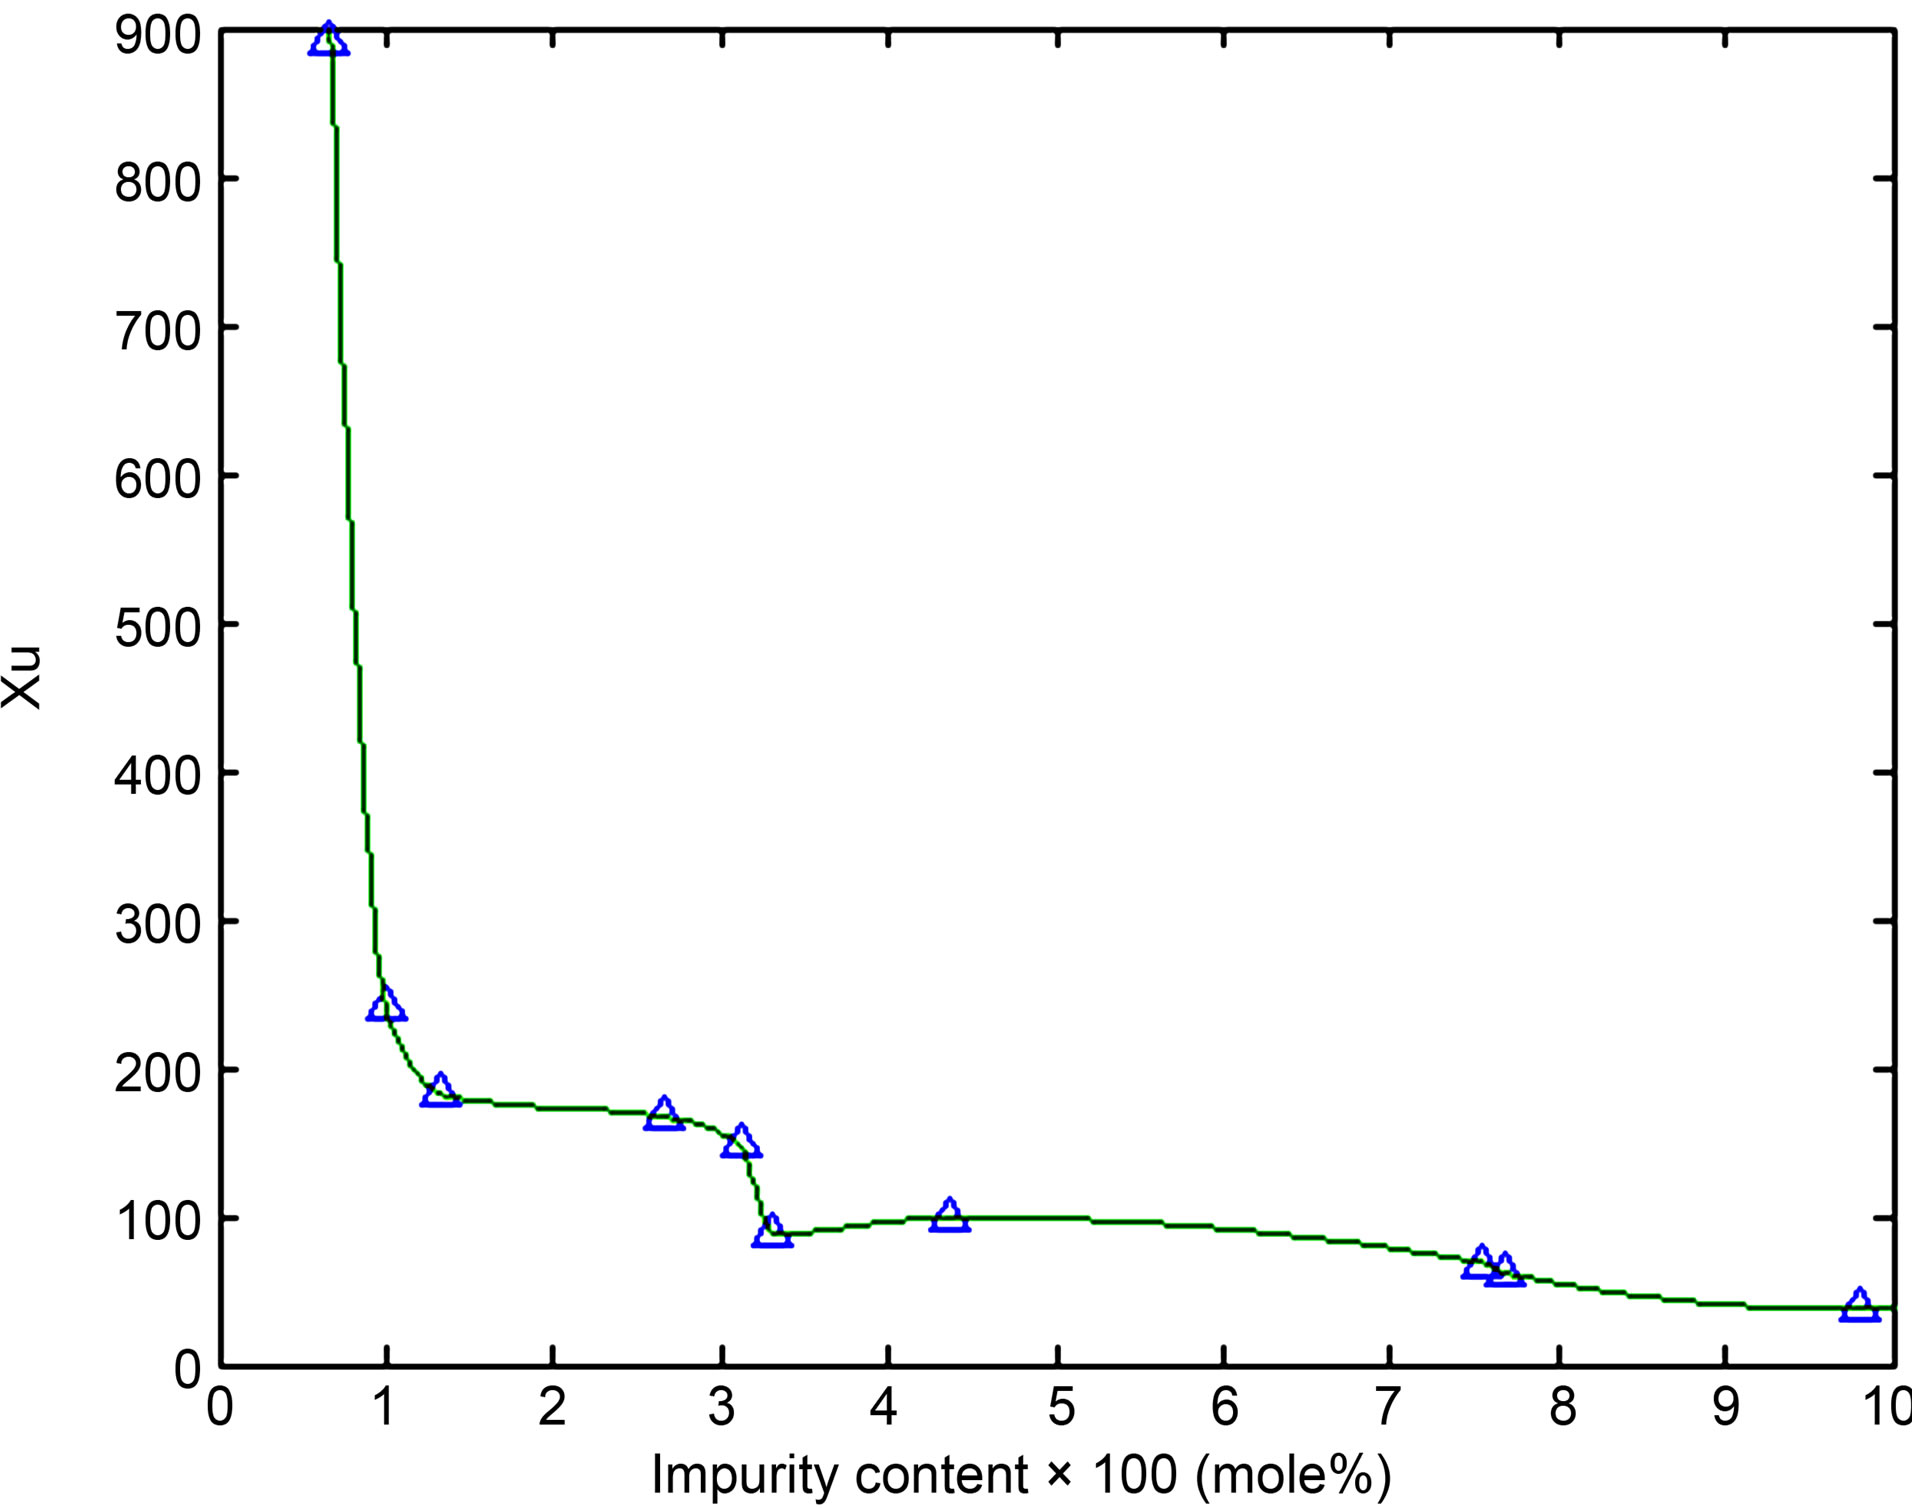
Figure 1. Upper limit of half the domain wall width in nm against impurity content (mol% × 100) for lithium niobate ferroelectrics.
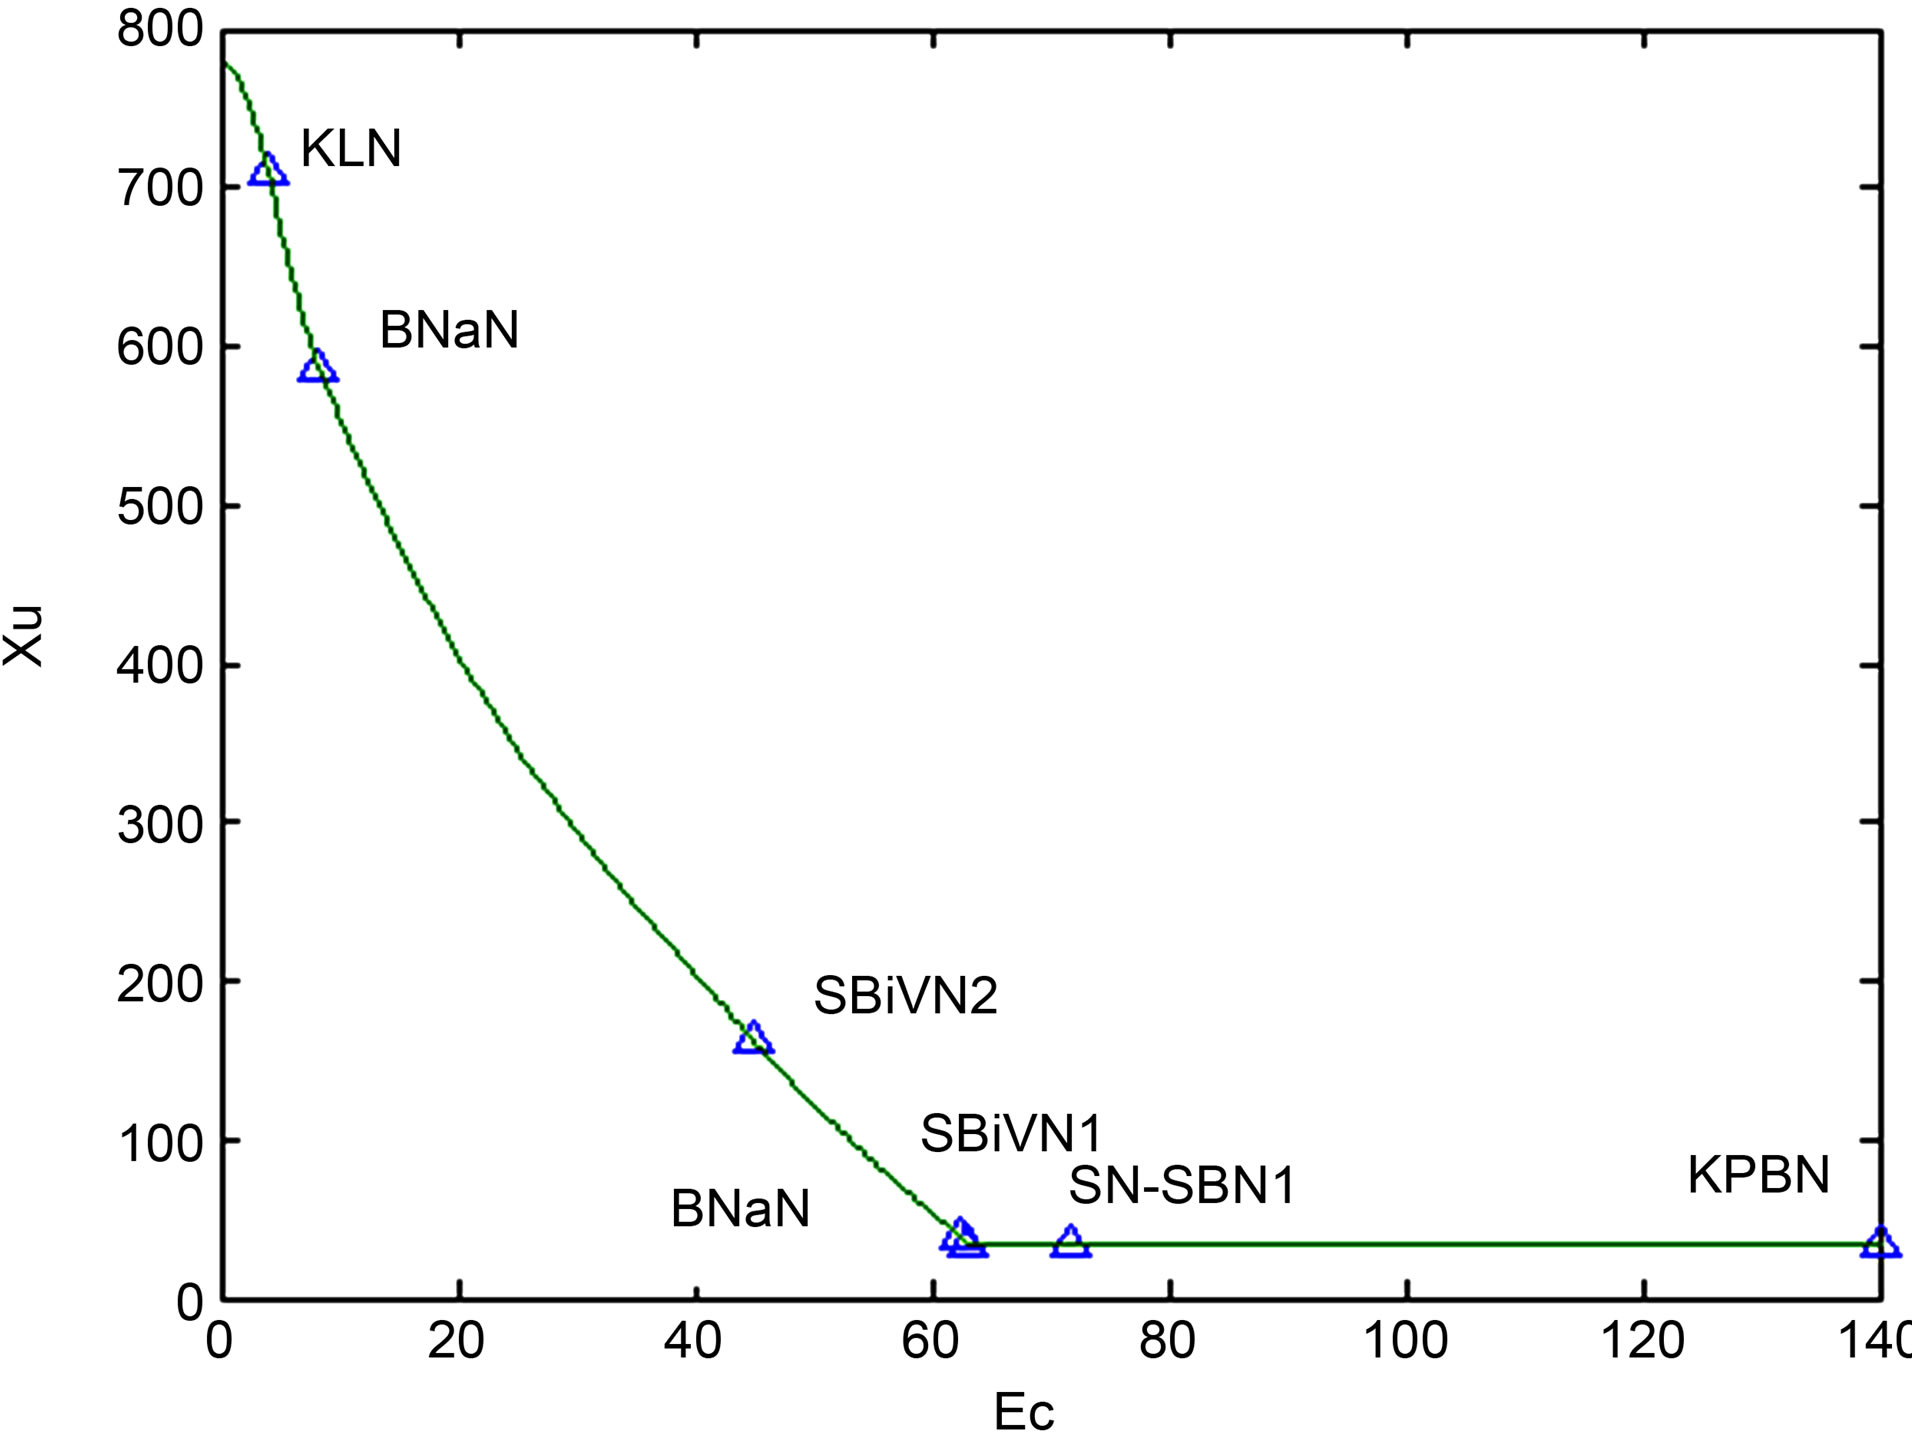
Figure 2. Upper limit of half the domain wall width in nm against coercive field in kV/cm for a very wide range of ferroelectric crystals (triangles represent 7 samples with known dielectric data).
These materials might contain different levels of impurities, even they are not known with precision. However, the plot of XU vs. Ec (read, impurity content) is shown in Figure 2. The behavior is quite similar to that shown for LN crystals from XU value of 709 nm (i.e. Ec = 4 kV/cm) for KLN crystal up to a low value around 36 nm (i.e. Ec = 45 kV/cm) for SBiVN crystal, and then it remains almost constant towards higher Ec values (i.e. congruent side). It is to be noted that this near constant value is 19 - 38 nm, which is about  to 1 order of magnitude higher than that found by Floquet and Valot by a combination of HRTEM images and XRD data [10,16], as mentioned in the Section 1. However, it is difficult to explain this anomaly at this stage, considering that both the preparation techniques (incorporating different levels of impurities) and measurement procedures (i.e. experimental errors) could be quite different from sample to sample.
A large variation of the XU value seems to indicate a wide variation in the impurity levels. It is quite pertinent to mention that in our above model, no effect of the crystal strain is included, as done by Gopalan et al. [3], and also by Bhattacharya and coworkers [13,14] and others [15], which is expected to decrease the dielectric constant and thereby increase the value of the Landau coefficient, which is so fundamental in the estimation of DWW. However, from such an interesting correspondence of experimental data with our perturbation model on various ferroelectric crystals, it is our considered opinion that the “observed trend” (as shown in Figures 1 and 2) might not change significantly, if we take strain energy into account. There is a need of more work in this area, particularly on the effect of impurity and strain on the domain wall width from a dynamic point of view, as also emphasized by Gopalan et al. [3].
This work shows that due to fluctuation in both the driving force and order parameter, the lower limit of DWW is remarkably constant showing its independence on the switching behavior or Ec, whereas the upper limit of DWW shows a relatively stronger functional dependence on the impurity content (i.e., on Ec) at the initial values before showing the asymptotic behavior that might indicate the beginning of a pinning effect. This signifies the need to work with near-stoichiometric samples containing some impurities for photonic and other applications [20-23]. It is pertinent to mention here that for lithium nobate system, after the third point from the left of Figure 1, all the other points can be approximated by a straight line. At this third point, the switching field is 40 kV/cm (equivalent to an “antisite niobium defects” content of 0.133 mole%), where there is an effect of pinning observed [24]. This was recently described by a detailed quantum calculations of two-phonon bound state (TPBS) by phonon hopping coefficient via Fourier Grid Hamiltonian method through our discrete Hamiltonian [21,23], as detailed in Ref. [24]. For the data of other ferroelectrics, a detailed quantum calculations are being carried out, although in this case (Figure 2) the breaking point is around 40 - 45 kV/cm .
3. Conclusion
The perturbation or fluctuation model shows the lower limit of half the domain wall width to be remarkably constant due to some averaging mechanism taking place within a given crystal system during switching study for a wide variety of crystals and for a given crystal with different impurity contents, which signifies the most stable situation. The upper limit of half the width, after an initial decrease, shows an asymptotic behaviour with the coercive field (read, impurity content) after a particular value for both lithium niobate and lithium tantalate crystals respectively, whereas it is almost constant for other ferroelectrics towards the congruent side. An attempt will be made in future to use the “switching data” for estimating the temporal width of these domain walls from a dynamic system analysis, as done on such materials [7]. Moreover, the strain data instead of being normalized into L-G equation should be explicitly included in this type of model. This work not only shows the establishment of our simple mathematical model for domain wall width, but also it predicts a sort of critical point of impurity in various ferroelectrics, after which the wall width becomes almost asymptotic. Detailed quantum calculations already show some changes due to pinning in lithium niobate system [24] and for other ferroelectrics, micro-level calculations would be the future directions of study.
4. Acknowledgements
The authors would like to thank Professor V. Gopalan, Dept. of Materials Science, Penn State University (USA) for many helpful suggestions and comments.
REFERENCES
- H. Fu and R. E. Cohen, “Polarization Rotation Mechanism for Ultrahigh Electromechanical Response in Single-Crystal Piezoelectrics,” Nature, Vol. 403, No. 6767, 2000, pp. 281-283. doi:10.1038/35002022
- S. Kim, V. Gopalan and A. Gruverman, “Coercive Fields in Ferroelectrics: A Case Study in Lithium Niobate and Lithium Tantalite,” Applied Physics Letters, Vol. 80, No. 15, 2002, pp. 2740-2742. doi:10.1063/1.1470247
- D. A. Scrymgeour, V. Gopalan, A. Itagi, A. Saxena and P. J. Swart, “Phenomenological Theory of a Single Domain Wall in Uniaxial Trigonal Ferroelectrics: Lithium Niobate and Lithium Tantalate,” Physical Review B, Vol. 71, No. 18, 2005, pp. 184110-184122. doi:10.1103/PhysRevB.71.184110
- A. K. Bandyopadhyay and P. C. Ray, “Perturbation Analysis and Memory in Ferroelectric Materials,” Journal of Applied Physics, Vol. 95, No. 1, 2004, pp. 226-230. doi:10.1063/1.1630698
- M. E. Lines and A. M. Glass, “Principles and Applications of Ferroelectrics and Related Materials Clarendon,” Clarendon Press, Oxford, 1977.
- V. Gopalan and T. E. Mitchell, “Wall Velocities, Switching Times, and Stabilization Mechanism of 180˚ Domains in Congruent LiTaO3 Crystals,” Journal of Applied Physics, Vol. 83, No. 2, 1998, pp. 941-954. doi:10.1063/1.366782
- A. K. Bandyopadhyay, P. C. Ray and V. Gopalan, “Dynamical Systems Analysis for Polarization in Ferroelectrics,” Journal of Applied Physics, Vol. 100, No. 11, 2006, pp. 114106-114109. doi:10.1063/1.2388124
- J. Padilla, W. Zhong and D. Vanderbilt, “Heterovalent and A-Atom Effects in A(B'B″)O3 Perovskite Alloys,” Physical Review B, Vol. 59, No, 3, 1996, pp. 1834-1839. doi:0.1103/PhysRevB.59.1834
- B. Meyer and D. Vanderbilt, “Ab initio Study of Ferroelectric Domain Walls in PbTiO3,” Physical Review B, Vol. 65, No. 10, 2002, pp. 104111-104121. doi:10.1103/PhysRevB.65.104111
- N. Floquet, C. M. Valot, M. T. Mesnier, J. C. Niepce, L. Normand, M. Thorel and R. Kilaas, “Ferroelectric Domain Walls in BaTiO3: Fingerprints in XRPD Diagrams and Quantitative HRTEM Image Analysis,” Journal of Physics III, Vol. 7, No. 6, 1997, pp. 1105-1128. doi:10.1051/jp3:1997180
- Y. Girshberg and Y. Yacoby, “Ferroelectric Phase Transitions and Off-Centre Displacements in Systems with Strong Electron-Phonon Interaction,” Journal of Physics: Condensed Matter, Vol. 11, No. 48, 1999, pp. 9807-9822. doi:10.1088/0953-8984/11/48/337.
- A. L. Roytburd, “Elastic Domains and Polydomain Phases in Solids,” Phase Transitions B, Vol. 45, 1993, pp. 1-34. doi:10.1080/01411599308203516
- W. Zhang and K. Bhattacharya, “A Computational Model of Ferroelectric Domains. Part II: Grain Boundaries and Defect Pinning,” Acta Materialia, Vol. 53, No. 1, 2005, pp. 199-209. doi:10.1016/j.actamat.2004.09.015
- W. Zhang and K. Bhattacharya, “A Computational Model of Ferroelectric Domains. Part I: Model Formulation and Domain Switching,” Acta Materialia, Vol. 53, No. 1, 2005, pp. 185-198. doi:10.1016/j.actamat.2004.09.016
- Y. Su and C. M. Landis, “Continuum Thermodynamics of Ferroelectric Domain Evolution: Theory, Finite Element Implementation, and Application to Domain Wall Pinning,” Journal of the Mechanics and Physics of Solids, Vol. 55, No. 2, 2007, pp. 280-305. doi:10.1016/j.jmps.2006.07.006
- N. Floquet and C. Valot, “Ferroelectric Domain Walls in BaTiO3: Structural Wall Model Interpreting Fingerprints in XRPD Diagrams,” Ferroelectrics, Vol. 234, No. 1, 1999, pp. 107-122. doi:10.1080/00150199908225285
- W. Yan, et al., “The Relationship between the Switching Field and the Intrinsic Defects in Near-Stoichiometric Lithium Niobate Crystals,” Journal of Physics D: Applied Physics, Vol. 39, No. 1, 2006, pp. 21-24. doi:10.1088/0022-3727/39/1/004
- L. Tian, V. Gopalan and L. Galambos, “Domain Reversal in Stoichiometric LiTaO3 Prepared by Vapor Transport Equilibration,” Applied Physics Letters, Vol. 85, No. 19, 2004, pp. 4445-4447. doi:10.1063/1.1814436
- V. Gopalan, V. Dierolf and D. A. Scrymgeour, “DefectDomain Wall Interactions in Trigonal Ferroelectrics,” Annual Reviews Materials Research, Vol. 37, 2007, pp. 449- 489. doi:10.1146/annurev.matsci.37.052506.084247
- A. K. Bandyopadhyay, P. C. Ray and V. Gopalan, “Solitons and Critical Breakup Fields in Lithium Niobate Type Uniaxial Ferroelectrics,” European Physical Journal B, Vol. 65, No. 4, 2008, pp. 525-531. doi:10.1140/epjb/e2008-00356-9
- A. K. Bandyopadhyay, P. C. Ray, L. Vu-Quoc and A. R. McGurn, “Multiple-Time-Scale Analysis of Nonlinear Modes in Ferroelectric LiNbO3,” Physical Review B, Vol. 81, No. 6, 2010, pp. 064104-064114. doi:10.1103/PhysRevB.81.064104
- A. K. Bandyopadhyay, P. C. Ray and V. Gopalan, “An Approach to the Klein-Gordon Equation for a Dynamic Study in Ferroelectric Materials,” Journal of Physics: Condensed Matter, Vol. 18, No. 16, 2006, pp. 4093-4100. doi:10.1088/0953-8984/18/16/016
- P. Giri, S. Ghosh, K. Choudhary, Md. Alam, A. K. Bandyopadhyay and P. C. Ray, “Importance of Damping on Nanoswitching in LiNbO3-Type Ferroelectrics,” Physica Scripta, Vol. 83, No. 1, 2011, Article ID 015702. doi:10.1088/0031-8949/83/01/015702.
- A. Biswas, K. Choudhary, A. K. Bandyopadhyay, A. K. Bhattacharjee and D. Mandal, “Quantum Pining-Transition Due to Charge Defect in Ferroelectrics,” Journal of Applied Physics, Vol. 110, No. 2, 2011, pp. 024104-024111. doi:10.1063/1.3607298